bitcoin long trade setup ALL trading ideas have entry point + stop loss + take profit + Risk level.
hello Traders, here is the full analysis for this pair, let me know in the comment section below if you have any questions, the entry will be taken only if all rules of the strategies will be satisfied. I suggest you keep this pair on your watchlist and see if the rules of your strategy are satisfied. Please also refer to the Important Risk Notice linked below.
Disclaimer
BTCUSDT.5L trade ideas

BTCUSDTIt seems that the price of $110,000 is a strong resistance for Bitcoin, and as long as the price is below $110,000, its trend is bearish, and we can consider the targets of $107,000 and $105,000 for it.

BTCUSD | Long | Breakout Above Value Area High | (July 4, 2025)BTCUSD | Long | Breakout Above Value Area High | (July 4, 2025)
1️⃣ Insight Summary
Bitcoin is showing strong bullish momentum after consolidating sideways. We recently pushed from $99,000 to around $110,750, and now eyes are on whether it can hold above the value area high or break even higher.
2️⃣ Trade Parameters
✅ Bias: Long (bullish)
✅ Entry Zone: Around $111,000 — watch for a clear reaction at this level (especially if retested).
✅ Stop Loss: Below $99,000 — this protects against a deeper pullback if bulls lose control.
✅ TP1: $111,874
✅ TP2: $121,000
✅ TP3 (final target): $135,000
3️⃣ Key Notes
We’re currently seeing buyers step in around the VWAP and higher value area levels, suggesting strong support from big players. Keep an eye on correlated markets like S&P 500 — a possible correction there might temporarily affect Bitcoin’s strength. Always wait for a solid reaction (a bounce or strong volume confirmation) before entering. Avoid chasing blindly; confirm that big players are interested at that level.
The idea of entering on a second touch can offer better risk-reward. The first touch often shows strength, while the second touch is usually the safer entry for many traders.
4️⃣ Follow-up Note
I’ll keep monitoring this setup and share updates if Bitcoin approaches key levels or shows reversal signs.
Please LIKE 👍, FOLLOW ✅, SHARE 🙌 and COMMENT ✍ if you enjoy this idea! Also share your ideas and charts in the comments section below! This is the best way to keep it relevant, support us, keep the content here free, and allow the idea to reach as many people as possible.
Disclaimer: This is not financial advice. Always conduct your own research. This content may include enhancements made using AI.

Bitcoin is in a downward trend.Hello dear friends.
Considering the trend of Bitcoin, it is expected that this Bitcoin will fall to around $100,000.
❌Please note that this is just a prediction, so be careful with your capital.

PULL BACKFriends as per my analysis btc is forming an inverse head and shoulder pattern. with in a couple of days we will see a pull back up 101k area.

Bitcoin shortBitcoin has lost the daily level, has been rejected by weekly level
Not only, but also Bitcoin has lost weekly open, previous week's high and Monday high
I am currently short


"BTC to $108,800 – How Likely Is It?"Bitcoin is showing strong bullish momentum as key technical indicators align in favor of a major breakout. With increasing institutional interest, rising ETF inflows, and a favorable macroeconomic environment, BTC appears to be setting up for a potential rally toward the $108,800 level. Historical price action also suggests that once Bitcoin breaks past major resistance zones, it often surges rapidly. If the current support levels hold and buying pressure continues, the $108,800 target may be closer than expected.

BTCUSDT Daily – Bullish Engulfing = Big Move?Whenever we've seen a bullish engulfing candle on the daily timeframe, it’s often followed by a strong upward move. This pattern has repeated consistently throughout the current cycle.
🔹 The recent daily close shows a clean bullish engulfing right off the 50 EMA support.
🔹 Previous purple zones also highlight areas where similar engulfing candles led to sharp rallies.
🔹 Price is once again reclaiming momentum after a liquidity sweep — a classic accumulation signal.
📈 If history repeats, we could be eyeing another leg higher toward the $112K–$115K zone.
Pattern Psychology:
"This bullish engulfing isn’t just a candle — it's a sentiment shift, where buyers overpower sellers completely in one session."
🔹EMA Bounce Strategy:
"Price is using the 50 EMA as a trampoline — a typical smart money support zone."
🔹 Rejection of Breakdown Narrative:
"The fakeout below 100,582 support could be a classic bear trap, setting up for a liquidity-driven rally."
🔹 Pivot Zone Reaction:
"Immediate pivot zone (102,292) reclaimed — price now in a favorable position to target next R1 around 110,000."
🔹 Historical Context:
"This setup mirrors the March bounce, where similar structure and RSI/MACD confluence led to a 12% surge."
⚠️ Disclaimer:
This is not financial advice or a buy/sell recommendation. Analysis is for educational purposes only.
All chart markings and interpretations are original.

BTC - Isn't it obvious where it will go?BTC shorts not likely here - needs movement to top for further down momemntum!

SHORTYou’re right to be cautious around the $107K–$108K zone—it’s a pivotal area. A slight dip could happen, but the broader trend and institutional backing suggest more upside if resistance yields. Watch $105K–$106K support and $108K–$110K resistance closely. To 103K

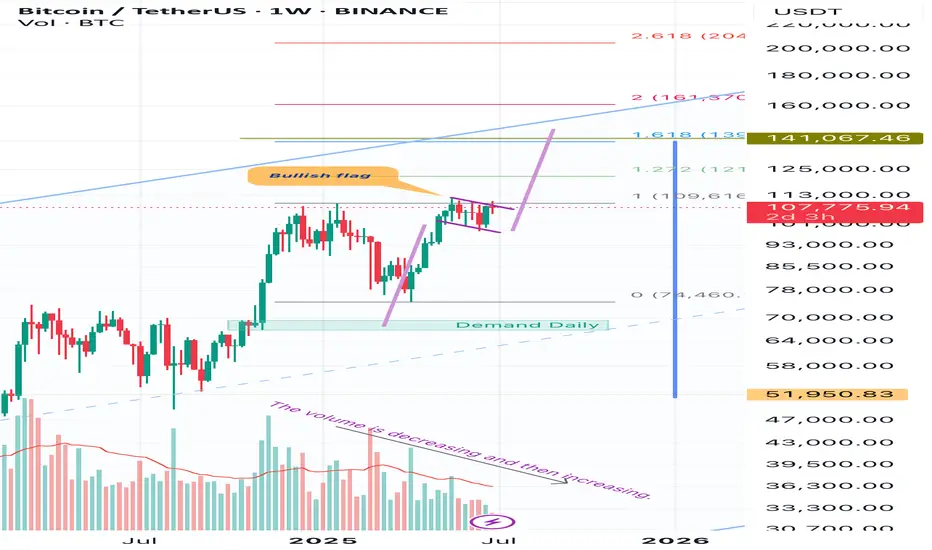
BtcusdtHello friends, in these important days of the markets, I wanted to share an analysis of Bitcoin with you. I think it is in a bullish flag and the target is 136,000 and within reach. It is 140,000. And I think that considering that the volume is decreasing, this indicates that with a sudden increase in volume, it will exit this bullish flag upwards with great intensity and speed.
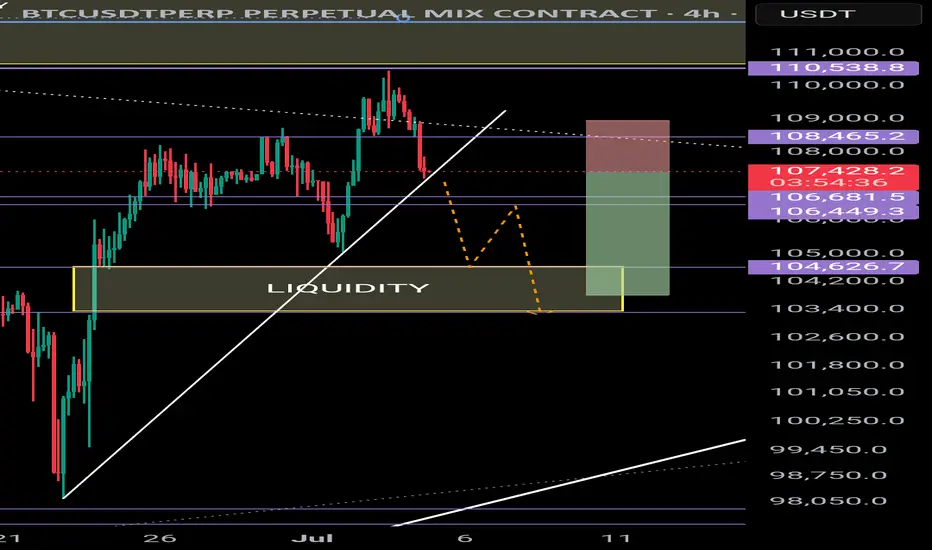
BTC correction - target4H
A break below the uptrend (white line) could result in a move down to 103,400 📉 which would fill a Fair-value-gap and grab liquidity.
Short position:
-3% vs +1%
2.3:1 Reward to Risk
All this just before Fedwire implements ISO20022?#bitcoin #btc price attempted a breakout but today failed with dumps. There "may" be other attempts but while ISO20022 subject is approaching, isn' t it wise to think about #xrp and other ISO20022 licenced coins will overperform the others (BTC, ETH, SOL and all other non iso certified coins) in near future? Not financial advice.

BITCOINTHE pullback into structure will be watched ,if the daily candle gets rejects on the daily trendline, then the buy holds .if they fail then the daily cross supply roof will send price tanking
the price action is playing a quick one ,technically i wasn't expecting a break of 4hr demand descending trendline line acting as support floor. patience is key, allow the daily candle to close for clear directional bias..
the uptrend future will lie on daily candle close and the weekly candle close will be the final verdict.
trading is 100% educated probability, so don't take personal, even when your analysis are wrong ,accept it and try again.
overall, resilience and consistency are what will distinguish you from other traders.
do have a happy blessed weekend.
we coming new week on money and winnings .
#btc #bitcoin #gold #silver #copper

Bitcoin will Bearish conformed Structureon Thursday Bitcoin Price briefly reclaimed at 110K this morning as macro tailwinds and institutional flows lifted crypto but analysis say clear catalyst is still needed to break all time high after the long impulsive rally earlier in the year.
BTC has been trading with in descending channel on the daily time frame looking after the Long time price will needs break and catch there Support 105K Level if the price stays below more then could next zone formed 102K
You may find more details in the chart i need support from you Guys And feel free to share your thoughts other views in the comments.

Bitcoin Technical Analysis – Key Supports in Focus🔥 Bitcoin Technical Analysis – Key Supports in Focus
Bitcoin (BTCUSDT) is currently going through a correction after its recent rally. All eyes are now on the $107,000 support level. If this zone holds, we might see a bullish bounce from here.
⚠️ However, if BTC loses this support, the next strong demand zone lies at $105,300 — a critical level to watch for any potential reversal.
📈 On the upside, if bulls take control and price rebounds, the first target would be $113,700, followed by $117,800 as the next major resistance.
🧠 Smart traders are watching these levels closely — don’t miss the next move.
🔔 Follow for more real-time insights, clean charts, and professional TA!
#BTC #Bitcoin #CryptoTrading #BTCUSDT #TechnicalAnalysis #TradingViewIdeas #SupportAndResistance

BTC shorting opportunity comes againBTC climbed above 108000 again, and the short-term bullish power was slightly stronger. According to the current strength, BTC still has room for growth, but it is still under pressure in the 109000-110000 area in the short term; if there is no major positive news, BTC may find it difficult to break through the resistance area in the short term under the current conditions, and may even experience stagflation and retreat again after approaching the resistance area.
Therefore, I think shorting BTC with the help of the resistance area is still the first choice for short-term trading. We can boldly short BTC in the 108500-109500 area and look towards the target area around 106000 again.

HolderStat┆BTCUSD retesting of the trend lineKUCOIN:BTCUSDT has pushed above 107,000 and reclaimed key levels after breaking from triangle and consolidation zones. Structure supports a move toward the 112,000 resistance zone (ATH). Higher lows and strong rallies continue to define the trend.

BTC vs DXY – Macro Setup at a Crossroads
Looking at BTC and DXY on the weekly, we’ve seen 3 key periods so far. In the first two, the pattern was clear: BTC went up, DXY went down.
Now we’re in the third period: what’s next?
👉 Has the move already played out?
👉 Is it happening now?
👉 Has DXY bottomed and BTC topped, or will DXY go lower while BTC climbs?
Macro conditions may help guide us.
BTC looks strong — supported by ETF inflows, on-chain strength, and institutional demand.
DXY looks weak — with softer economic data and rising expectations for rate cuts.
In my view, tariffs are likely to weigh heavier on DXY than BTC, favoring more upside for BTC.
The recent Big Beautiful Bill could also add fuel to BTC while adding pressure on DXY.
Always take profits and manage risk.
Interaction is welcome.

A Comprehensive Analysis !!!This market has shown disregard for technical patterns, and every time the price approaches historically significant levels, it reveals its true intentions and disappoints us. This cycle tends to repeat.
In my opinion, we’re likely to see one more drop in Bitcoin’s price. After that, instead of continuing the expected downtrend from the pattern, the price could break the descending formation and experience a strong upward move.
Stay Awesome , CobraVanguard.

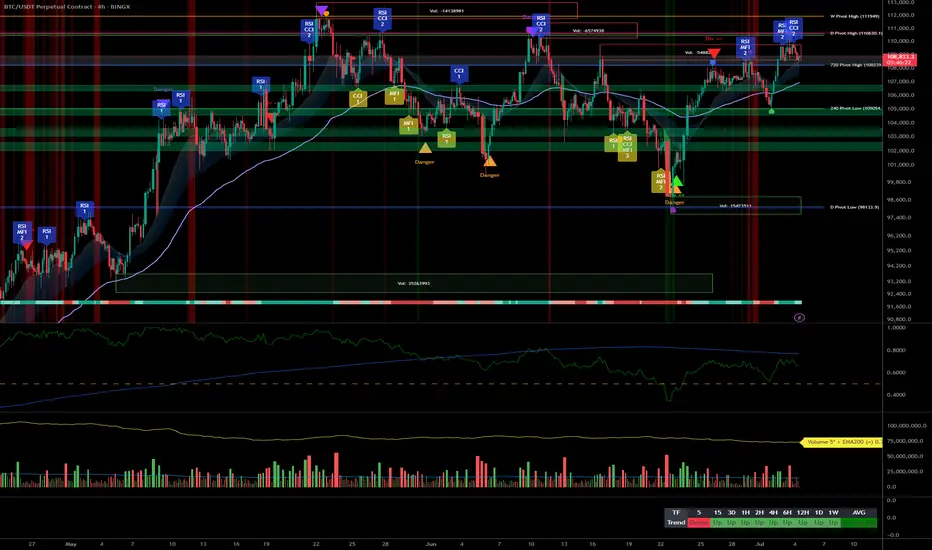
Bitcoin Analysis: Risk under 108k, aiming 111k+ in continuation__________________________________________________________________________________
Technical Overview – Summary Points
__________________________________________________________________________________
Momentum: Strong uptrend across all major timeframes (MTFTI “up”). Buyers remain in control; daily/4H/1H structure robust.
Key supports: 108,239.1 (720min Pivot, critical transversal support), 105,054.7 (240min Pivot), 99,581 (240min Pivot). Active defense seen on 108,239.1 at all timeframes.
Main resistances: 110,630.1 (1D), 110,483.1 (240min), 111,949 (W). The 110–111k area acts as the short-term ceiling.
Volume: Moderate activity, no spikes or climaxes, slight intensification noted on the 30min during key tests.
Risk On / Risk Off Indicator: “STRONG BUY” signal on all Tfs ≥30min, contributing to marked bullish momentum. Minor short-term divergence only on 15min.
Multi-TF behavior: ISPD DIV and Investor Satisfaction are neutral, no extreme behavioral stress; psychology is balanced, neither panic nor euphoria.
__________________________________________________________________________________
Strategic Summary
__________________________________________________________________________________
Overall bias: Bullish, synchronized multi-timeframes, dominant bullish liquidity.
Opportunities: Optimal long entries on validated pullback to 108,239.1, add on breakout of 110,630–111,949. Gradual partial take profit recommended in the 111k area.
Risk zones: Invalidation below 108,239.1 (confirmed H2 close), risk of further correction toward 105k then 99.5k; suggested swing stop under 108,000.
Macro catalysts: No major event, global markets stable. Geopolitical tensions monitored, low short-term impact.
Action plan: Prioritize “buy the dip” on pivots, active monitoring for any breakout/failure. Dynamic stop management, partial profit-taking on extension.
__________________________________________________________________________________
Multi-Timeframe Analysis
__________________________________________________________________________________
1D: Very strong daily structure, high momentum, intermediate supports near 98k/100.5k. Watch for major resistances at 108–111k.
12H/6H/4H: Ranging below 110–111k resistance, no fragility. Supports 108,239.1 and 105,054.7 holding, no selling pressure detected. Watch for breakout/impulse.
2H/1H: Buy zone if maintained >108,239.1, risk of sell-off below this pivot toward 105k. Price is ranging, momentum remains positive.
30min/15min: Consolidation on supports. 15min: temporary divergence on the Risk On / Risk Off Indicator but bullish structure intact unless a clean break below 108,239.1.
Risk On / Risk Off summaries: Dominant “strong buy” tone, synchronized momentum, only weak short-term divergence. No behavioral stress (ISPD DIV neutral everywhere).
__________________________________________________________________________________
Cross-analysis and recommendations
__________________________________________________________________________________
Momentum: Bullish environment sustained as long as >108,239.1. Continued upside bias if breakout above 110–111k is confirmed.
Risks: No major vulnerabilities detected. Very low probability of a local top, except in the case of exogenous macro shock.
Macro & On-chain: Stable newsflow, no distribution from HODLers or significant new inflows. Preferred strategy: swing trading in trend direction, tight stop under the main pivot.
__________________________________________________________________________________
Decision summary
__________________________________________________________________________________
Preferred scenario: Hold long >108,239.1, add on validated pullback, look for breakout with volume extension to 111k+.
Risk management: Stop under 108,000, partial profit-taking in the 110,630–111,949 area.
No immediate macro constraints: Use this calm window to ride the trend.
Monitoring: Resilience of the main support, any sudden geopolitical shocks.
BTC/USDT keeps a clear bullish bias, favoring swing or trend-following strategies as long as key pivots hold. Buy the dips remains optimal while technical structure holds; strict stop management is advised pending any “breakout fail”.
BTC - Bullish retest to ATH?Made a composite profile of that little range we had last week.
We took out the lower npoc, then took out the higher npoc and the internal equal highs (which was the only short I see for now)
I'm looking for 107.2-3 to get a bullish reaction, long from there into a clean-up of the 112k highs.
If the July 2nd lows don't hold, I'd look for the 101k npoc, or maybe a frontrun of that at the imbalance fill around 103k.
