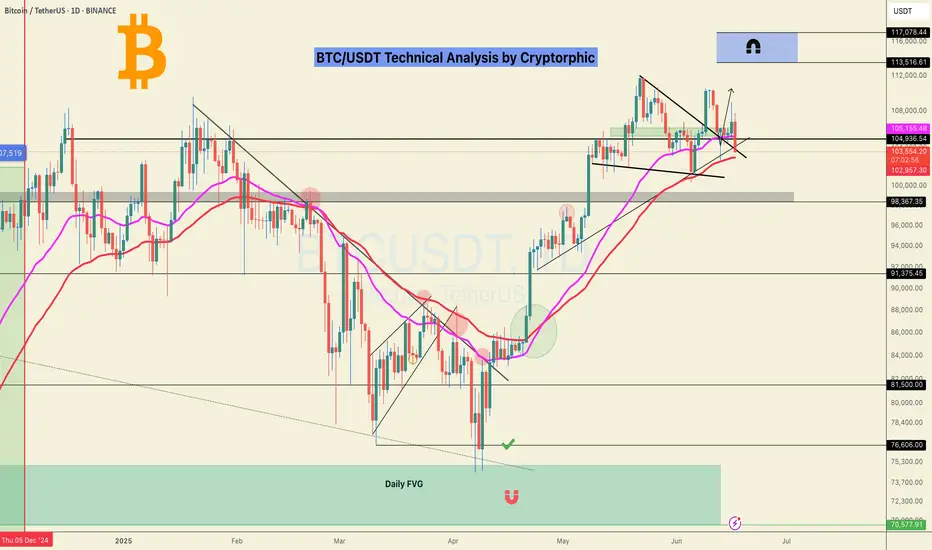
#BTC Update Urgent. CRYPTOCAP:BTC Update:
Bitcoin is making another attempt to test the $102K support level.
Expecting a bounce around the 100k area if we reach there.
This level is holding strong, backed by two key EMAs and high liquidity concentration.
Just be careful with longs.
Monday’s pump faded quickly, a clear sign of weakness.
This is exactly why staying on the sidelines was the right call.
If you're holding stables, you're not losing in this volatility.
I’ll continue monitoring the price action closely.
It’s better to enter higher with solid confirmations than to gamble on local dips.
Altcoins are still struggling; stay cautious.
More updates soon.
Stay tuned.
Do hit the like button if you like it.
Thank you
#PEACE
BTCUSDT.5L trade ideas
Bitcoin Retests Broken Channel | Bounce to $110k?Bitcoin is currently retesting the broken downward channel. This selloff was a market shock reaction due to Israel's airstrikes on Iran. Price found support around $103k, at the daily timeframe 50SMA. The daily 50SMA also served as support in the previous drop to $100k last week.
In the chart's red circle is likely where many long leveraged positions had their stop losses or liquidation levels. We can safely assume this event was a liquidity hunt as Bitcoin remains strong above $100k. A healthy pullback to retest.
Historically, we have seen similar market shock selloffs like this. One example is the 1st of October 2024 Iran strikes on Israel. Bitcoin crashed 5% from $63k to $60k. What followed after was a recovery to over $100k, never seeing $60k again.
Will Bitcoin recover?
We still have multiple bullish developments. Institutions are becoming increasingly interested in Bitcoin, the US Bitcoin reserve, SEC x Ripple case settlement, SOL ETF approval, Fed rate cuts, among others.
Provided that the conflict does not escalate, once the market panic reaction is over, we can expect a healthy bullish continuation, as long as Bitcoin remains above $100k.
We also have a massive pool of short liquidity above $111k. Once we break above this level it will be a short-squeeze to $120k.

Excellent Trade yesterday! Today's PlayHere are the scalp plays I am watching today. A few continuation plays in to demand and a reaction off supply. Lets see what the NY brings.

$BTCUSD Predictions support line
Bitcoin traders, get ready for an epic ride! This chart shows BTC still has to hit the price target from the Cup & Handle breakout, pushing it toward a major channel resistance! Once it peaks, a bear market could kick in, driving prices down to the support line. Buckle up for the volatility ahead!

Bitcoin: Strong Support Holds Amid Market UncertaintyBitcoin: Strong Support Holds Amid Market Uncertainty
Bitcoin recently tested a key support zone near 102,670, bouncing back in alignment with the broader bullish trend.
The ongoing Middle East conflict continues to reinforce BTC’s strength, establishing another solid support level at 102,650, which signals that the price remains well-supported by buyers around this zone.
For Bitcoin to dip below this area, it would likely require significant market manipulation or unexpected developments.
At present, BTC suggests an upward trajectory, potentially reaching 107,850, 109,100, and even a retest of the previous highs near 111,500.
You may find more details in the chart!
Thank you and Good Luck!
❤️PS: Please support with a like or comment if you find this analysis useful for your trading day❤️

BTC Weekly BOX breakout or possible false breakoutWe have BTC setting up a nice weekly consolidation box, with candle closes consistently holding above the previous weekly ATH resistance. Multiple Doji closes indicate consolidation and compression. At the bottom of the box, we’ve seen strong reversals with high volume. The 4H chart is consistently defending the 200 EMA, supporting the idea that the daily trend remains strong — although direction is currently unclear.
Is distribution happening? It’s not easy to short just yet. We might still see a false breakout, position filling, and then a return to the box range. I’d be interested in a swing short if that happens — especially if the weekly candle closes with high volume and signals a reversal, indicating a potential bearish shift on the daily chart. Let’s keep in mind that June is historically weak, especially during the last two weeks.
On the long side, I’ll only be looking for entries after a daily break of structure (BOS).
Does not need to goes to the highs, we could drop below 100K if we lose box range low with a MSB.
Interesting days ahead — patience is key, as we currently don’t have many high-probability setups.

BTC/USDTHello friends, I hope you are doing well. This analysis came to my mind for Bitcoin. On the 4-hour time frame, if Bitcoin crosses the areas I specified, it will move towards its targets. It could be bullish because gold and oil were bearish yesterday. What do you think, friend?

BTC/USDT – Rising Wedge Breakdown Looms Near $110K
Idea Summary:
Bitcoin is compressing in a rising wedge on 1D/4H timeframes, approaching resistance around $ 110K–$ 112K. We’re seeing bearish divergence on RSI and MACD, declining volume, and sentiment cooling—signaling a potential breakdown.
Key Confluences:
• Rising wedge pattern (bearish reversal during uptrend) with converging trendlines and falling volume
• RSI divergence: price rising, RSI flattening/declining
• Volume behavior: weaker rallies, distribution-style setup near highs
• Sentiment neutralizing: Fear & Greed Index slipped from ~74 to ~55–60
• Macro backdrop: U.S. inflation cooling, Fed pause in rate hikes → but upcoming FOMC brings volatility risk
Conclusion:
BTC is near a wedge apex with short-term bearish structure forming. A breakdown could test $ 90K–$ 75K, whereas a break above $ 112K invalidates the setup. 📉
Trigger zones:
• Breakdown < $ 105K → triggers short
• Breakout > $ 112K → stop out & pause
💬 Thoughts? Breakdown or breakout next?

[SeoVereign] Bitcoin Bearish Outlook – June 17, 2025We are the SeoVereign Trading Team.
With sharp insight and precise analysis, we regularly share trading ideas on Bitcoin and other major assets—always guided by structure, sentiment, and momentum.
🔔 Follow us to never miss a market update.
🚀 Boosts provide strong motivation and drive to the SeoVereign team.
--------------------------------------------------------------------------------------------------------
Hello,
This is SeoVereign, approaching technical analysis not as a result but as a prediction, with a realistic perspective.
I am presenting a bearish view on Bitcoin as of June 17, 2025.
First, based on the fact that a downtrend appeared near the 0.786 level of the overall Fibonacci retracement, I believe strong downward pressure is forming, and thus I am outlining this bearish perspective.
This 0.786 level corresponds to around the 109,000 price range. On the chart, the 109,000–110,600 range is a very strong supply zone where support and resistance have repeatedly been confirmed.
Next, from a wave counting perspective, the 1.272 trend-based Fibonacci extension lies in a similar area as the 0.786 retracement level, which further reinforces my conviction in this view.
After successfully predicting the downward movement from the 11th, I have been continuously counting the recent upward wave, and the wave structure on the chart appears to align naturally, as I see it.
In addition, from a harmonic perspective, the Alt Bat pattern is functioning effectively, and since the movement has been captured within the pre-set X–1.13 range, the confirmation of this pattern can also be considered successful.
The first target is currently set around the 105,700 level.
I will continue to monitor the market closely, and once this idea progresses to a certain point, I will share more specific evidence and the thought process behind the bearish entry through an additional update.
Thank you.

Bitcoin Mirror Cycle: History Repeats? | 2024–2025 PatternThis chart presents a potential repetition of Bitcoin’s 2024 price cycle (Jan 23 – Aug 5, 2024), projected to mirror itself from September 6, 2024 through Q3–Q4 2025. The hand-drawn arcs suggest a repeating pattern of rounded tops, distribution, correction, and potential accumulation zones. Key support levels are marked near $66,172 and $49,116, indicating where price may retrace before a potential bounce or deeper macro-driven selloff.
Technically, the chart hints at a large-scale cyclical structure—a classic market psychology pattern where prior cup-and-handle or double-top formations play out again on a broader timescale.
🌍 Global Context Overlay:
War & Geopolitical Tensions:
The ongoing risk of conflict escalation (e.g., Iran–Israel, Ukraine–Russia, and potential East Asian tensions) may lead to increased volatility in risk assets like crypto. Wars historically bring uncertainty, which may initially crash speculative markets but later fuel inflationary hedges like Bitcoin.
U.S. Elections (Nov 2024):
Political instability or leadership changes can impact Federal Reserve policy, regulation, and market sentiment, directly influencing BTC price direction post-election.
Recession Fears & Rate Cuts (2025):
With central banks expected to pivot towards rate cuts in 2025, liquidity could flow back into risk-on assets, possibly triggering the bounce scenario shown in the latter part of your drawing. If rate cuts come too late, however, a steeper correction into the $49K zone becomes more likely.
Global Debt Crisis & De-Dollarization:
Growing debt concerns and countries moving away from the USD may boost Bitcoin’s long-term appeal as a non-sovereign store of value, reinforcing the second rally illustrated in your sketch.

Bitcoin (BTCUSDT) Market Update – DailyBitcoin remains in a tight range between $110,221.73 (resistance) and $101,546.27 (support). These two levels are the main reference points for initiating high-probability trades.
🔸 Market Context:
The primary trend is bullish, so the priority remains on long setups.
Short positions should only be considered below $101,546.27 with confirmation.
With the prevailing bullish structure, early entries can be taken with a low-risk trigger at $108,746.08.
🔸 Moving Averages & Momentum:
The SMA 7 has caught up with the daily candles, but we haven’t seen a strong reaction yet.
If today's candle wicks above the SMA 7, we can more confidently pursue long setups starting tomorrow.
Otherwise, we may see a pullback toward the SMA 25, especially given the decreasing volume typical of ranging phases.
🔸 Lower Timeframe Setup (1H/4H):
A micro range box can be observed between $108,746 and $106,649.78.
If price approaches $108,746 with increasing volume, that can serve as a valid long trigger on intraday timeframes.
⏳ Final Note: Patience is key while BTC trades inside this range. The bullish structure remains intact, and opportunities for long trades are more favorable for now. Wait for clean breakouts or volume-based confirmations before entering new trades.
#BTCUSDT #BitcoinAnalysis #CryptoUpdate #BTCPrice #CryptoStrategy #BitcoinRange #LongSetup #TechnicalAnalysis #TradingView

BTC - New month, new monthly Power Of ThreeNew monthly Power Of Three:
4 weekly candles to form a monthly candle.
So there will be 4 weekly PO3 within 1 monthly PO3.
Accumulation => Manipulation => Expansion
I anticipate the first week there should be a accumulation phase.
Determine the previous dealing range to find out the premium and discount range.
Short term trades back into the discount range and long term continues higher.

BTCUSDT h4 down Bitcoin is currently showing signs of weakness near the $107,000–$109,000 resistance zone (highlighted on the chart).
Price is starting to move down after multiple rejections at this level, forming a potential lower high.
Current price is around $106,890, and bearish momentum is starting to build.
🎯 Target Point Analysis:
📍 Resistance Zone: $107,000 – $109,000
Strong supply area where price has been rejected multiple times.
Sellers are clearly active in this zone.
📍 Target Point (Support Zone): $103,000
Identified as a key horizontal support level.
If price breaks below $106,000, it could trigger a move toward this target.
Historically, this level has acted as a base for previous bounces.
📈 Conclusion:
Bias: Bearish in the short term unless price reclaims $109,000 with strength.
If the downtrend continues, the next key support and target level is $103,000.
A clean break below $106,000 may accelerate the move toward this zone.

BTC — ATH or Lower High? Patience for the Next SwingBINANCE:BTCUSDT | 4h
Patience here — waiting for the next high-probability swing.
Major levels to watch: $111,990 (range high), $108,950 (weekly), $100,300–103,000 (demand).
Next move: ATH attempt or another lower high? Will act when the reaction sets up.

The only plays you need this week! 🚀 Join us as we dive into the highs and lows of Bitcoin this week! 🔥
Opportunities like this don’t show up every day — and we’ve got a strong feeling there’s a 10X trade hiding somewhere in this video! 👀💰
We’re locked in on the charts like eagles 🦅, watching closely to see if any of our setups come to life. You won’t want to miss what’s coming next! 📈📊
✨ Stay tuned for daily updates, smart setups, and sharp moves! ✨
📅 Weekly Schedule:
🛠️ Daily Setups: Monday to Friday
🎓 Class: Every Tuesday (if stars align 🌟 – subject to confirmation)
Let’s make it a big week! 💪🚀

BTC needs to hold up here. BTC is at a very important level. A role over is expected, but without market structure confirmation, it's important to consider the possibility of a move up. The bearish thesis on lower timeframes is the easy one. Ensure your bullish thesis is also considered. A confirmed lower low or a lower high would confirm a CHOCH reversal.
Full TA: Link in the BIO

BTCUSDT| Bounce from Channel SupportBTC just bounced cleanly off mid-channel support (~106.8K) within the descending structure.
Held above EMAs and reclaimed key short-term support.
If price holds above 107.2K → likely retest of 108.4K channel resistance.
Break and close above 108.5K = trendline breakout → 110K+ possible.
Break below 106.8K = failed bounce → 105.5K next demand.
Bias: Bullish while holding above 107.2K.

BTCUSDT Trade SetupBTC Still in sideways no major move, wait for the entries. While on weekly tf still expecting a final shakeout, 95-93k then a final leg up towards to 120k. For now wait for the entries to be filled first then must use sl.

30-Minute Chart – Rising Wedge BreakdownBreakdown from 30m rising wedge confirmed with volume. Retest at 107.5K failed. Price now under EMAs.
4H also broke rising channel → rejection from 108.4K.
Key support: 106.4K.
Break below = 105.2K target.
Reclaim 107.5K = upside risk to 108.8K+.
Bias: Bearish below 107.5K.
Volume confirms move.

BTC Breakout Imminent – Targeting $110,349🕒 Timeframe: 30-Minute Chart
📈 Current Price: $108,425
🎯 Projected Target: $110,349
---
🔍 Chart Zones & Key Levels:
🔷 Blue Resistance Zone (~108,500 - 110,500)
Price is currently approaching the top of this range.
Historically, price rejected strongly from this area (left blue circle).
This zone has acted as major supply, but now price is retesting with bullish momentum.
🟢 Green Circles – Key Reaction Points
The first green circle marks a strong bounce from previous support (~106,000).
Second green circle shows resistance rejection, indicating it's a key pivot level.
🔶 Orange Zone (~104,000 - 106,500)
This acted as a demand zone during the correction (middle of the chart).
Price formed a double bottom within this zone, signaling bullish reversal (orange circle).
---
📊 Structure & Pattern:
Consolidation breakout from a horizontal range.
Forming higher highs and higher lows, showing bullish structure.
The blue arrow path shows expected price movement:
Minor pullback
Followed by breakout towards $110,349 target
---
🧠 Market Sentiment:
Strong accumulation near $106,000 suggests buyers are in control.
Price is gradually grinding higher into resistance with volume increasing (implied).
---
🧭 Conclusion:
Bias: Bullish
Entry Zone: Dips near $107,800–$108,000
Target: $110,349
Invalidation: Break below $106,500

Bitcoin/TiqGPT Setup1D Timeframe: The daily chart shows a bullish momentum with recent green candles indicating a strong upward push. The price is currently near the high of the recent range, suggesting potential resistance or profit-taking levels.
4H Timeframe: The 4-hour chart reveals a more detailed view of the bullish momentum. There are signs of a pullback with the latest candle forming a small body, which could indicate a temporary exhaustion in buying pressure.
1H Timeframe: On the hourly chart, the price action shows a sharp decline followed by a recovery, indicating a volatility spike. This could be a reaction to a liquidity grab below prior lows, which is a common institutional maneuver to eliminate stop-loss orders before a directional move.
15M Timeframe: The 15-minute chart displays a recovery phase with the price moving upward steadily, suggesting that the earlier drop was likely a liquidity sweep.
5M Timeframe: This timeframe shows continued upward movement with consistent green candles, supporting the recovery narrative seen in the 15M chart.
1M Timeframe: The 1-minute chart shows a very granular view of the bullish momentum. The consistent upward ticks suggest strong buying interest at these levels, possibly from retail following the institutional cue.
INSTITUTIONAL THESIS:
Institutions appear to be in a phase of accumulation after a liquidity sweep, as evidenced by the sharp drop and subsequent recovery. The goal seems to be to push the price higher after successfully capturing liquidity below recent lows.
LEARNING POINT:
"1H Liquidity Sweep followed by a 15M and 5M bullish recovery indicating institutional buying pressure."
SIGNAL: BUY
SYMBOL: BTC/USDT ENTRY PRICE: $107,800 STOP LOSS: $107,400 TARGET PRICE: $108,600 CONDITION: Buy limit order post-1M confirmation of continued bullish momentum. RATIONALE: The setup aligns with a liquidity sweep followed by a bullish recovery across multiple timeframes, indicating strong buying interest. The entry is set above the current 1M high to ensure momentum continuation, with a stop placed just below the recent 1H low to minimize exposure to another potential liquidity sweep. STRATEGIES USED: Liquidity Sweep Recovery, Multi-Timeframe Bullish Alignment URGENCY: HIGH TIMEFRAME: Short-term CONFIDENCE SCORE: 85% RISK/REWARD RATIO: Calculated as follows:
Risk: $107,800 (Entry) - $107,400 (Stop) = $400
Reward: $108,600 (Target) - $107,800 (Entry) = $800
Ratio: 800 / 400 = 2:1

Skeptic| Cycle Mastery Part 1: HWC, MWC, LWC for Smarter TradingUnderstanding Higher Wave Cycle ( HWC ), Minor Wave Cycle ( MWC ), and Low Wave Cycle ( LWC ) is the key to making informed trading decisions, simplifying when to go long , short , or stay out . This Part 1 masterclass introduces these cycles, their relative nature, and how to align them with your strategy for precise entries and effective risk management . Let’s break it down. 📊
The Three Cycles: HWC, MWC, LWC
We trade across three market cycles:
HWC (Higher Wave Cycle) : The big-picture trend, like Bitcoin’s yearly uptrend.
MWC (Minor Wave Cycle): A medium-term trend, often an uptrend or corrective phase within the HWC.
LWC (Low Wave Cycle): The short-term daily trend, which can be range-bound, uptrend, or downtrend.
Knowing these cycles helps you decide when to e nter long, short, or avoid trading altogether, ensuring you align with the market’s rhythm.
Defining Your Cycles: It’s Relative
The main question before diving in: What timeframes are HWC, MWC, and LWC? The answer is relative—it depends on your strategy. Think of it like a temperature scale: 0°C isn’t “no heat” but a reference point (water’s freezing point). Similarly, your cycles are defined by the largest timeframe you analyze:
HWC: Your highest timeframe (e.g., Weekly for long-term traders).
MWC: The next level down (e.g., Daily).
LWC: Your shortest timeframe (e.g., 4-Hour or 1-Hour).
Ask yourself: What’s the largest timeframe I check? Set your HWC there, then scale down for MWC and LWC based on your trading style. This relativity ensures your cycles fit your unique approach.
While shorter cycles (LWC, MWC) form the HWC, the HWC’s power dominates, influencing smaller cycles. Let’s explore how to trade based on these relationships.
Trading Scenarios: When to Act
Scenario 1: HWC Uptrend, MWC Range
When the HWC is in an uptrend and the MWC is range-bound:
Action: Enter a long position on the first MWC wave when the LWC breaks the ceiling of the MWC range (e.g., a box breakout).
Why? The HWC’s bullish power supports the move, likely triggering an MWC uptrend. This makes the first wave a strong, low-risk entry.
Example: If the LWC (e.g., 4-hour) breaks the MWC range ceiling with a strong candle, you can confidently go long, backed by the HWC uptrend.
Scenario 2: HWC Downtrend, MWC Range
When the HWC is in a downtrend and the MWC is range-bound:
Action: Skip the first MWC wave. If the LWC breaks the MWC range ceiling, avoid going long—the bearish HWC could reject the move, resuming its downtrend.
Wait for the Second Wave: Let the MWC return to a range after the first wave. If the LWC breaks the range ceiling again, go long with confidence—the HWC’s influence is less likely to disrupt this second wave.
Risk Management Tips (if you trade the first wave against the HWC):
Reduce Risk: Lower your position size to minimize exposure.
Take Profits Early: Close the position or secure most profits (e.g., scale out) once you hit your R/R target, as volatility is high.
Wider Stop-Loss: Set a larger stop-loss to account for potential HWC-driven reversals, as stop-loss hunts are common in this scenario.
Adjusting Stop-Loss Size Based on Cycles
Aligned Cycles (HWC, MWC, LWC in Same Direction): When all three cycles align (e.g., all uptrend), set a tighter stop-loss relative to market conditions. Gradually scale out profits instead of closing the position, as the trend’s strength supports higher R/R (e.g., 5 or 10).
HWC Against MWC/LWC: If the HWC opposes the other cycles (e.g., HWC downtrend, MWC/LWC uptrend), use a wider stop-loss. The HWC’s power could reverse the LWC, lowering your win rate if stops are too tight. Expect volatility and plan accordingly.
Final Vibe Check
This Cycle Mastery Part 1 equips you to time MWC waves with precision, aligning HWC, MWC, and LWC for smarter entries. By mastering when to trade the first or second wave, you’ll avoid traps and maximize your edge. Part 2 will dive deeper with examples—stay tuned! At Skeptic Lab, we trade with no FOMO, no hype, just reason. Protect your capital—stick to 1%–2% risk per trade. Want Part 2 or another topic? Drop it in the comments! If this guide sharpened your game, hit that boost—it fuels my mission! 😊 Stay disciplined, fam! ✌️
💬 Let’s Talk!
How will you time your MWC waves? Share your thoughts in the comments, and let’s crush it together!

30/06/25 Weekly OutlookLast weeks high: $108,531.02
Last weeks low: $99,592.69
Midpoint: $104,061.86
Overall a positive week for BTC in isolation as price moves steadily all week reclaiming the losses made in the week from the 16th-23rd June. This comes after a $2.2B BTC ETF weekly inflow, the 3rd consecutive week of net inflows.
Having now hit the key S/R level of $108,500 it will be interesting to see where BTC goes from here. Jumping up above the level will require a lot from the bulls as ATH is within touching distance and so buying into major resistance is a tough ask. We also have Geo-political uncertainties to add to the situation, one bad tweet is all it takes sometimes to do a lot of damage.
On the other hand the SNP500 hits new ATH in the same conditions and so BTC is more than capable of doing the same.
So far in the first hours of this weeks trading we do have a SFP of the weekly high setup, not ideal for the bulls in any way and so from here the a retest of the range quarters, midpoint being the key area would make sense, invalidation would be a clean break above weekly high with acceptance and strong volume on the move to break the rangebound/choppy environment.
There is also the "window dressing" element to the months &quarter end today. History shows a de-risking going into these events and more money flowing back into risk-on assets in the days following monthly/ quarterly end. For that reason a bullish move (if there were to be one) would come later in the week IMO.
Good luck this week everybody!
