BTC is the champion our portfolio needs. BTC has some work to do. Either it will correct for a nice confrimatio low or strucure out for a bull fag. Either way, the price remains within a downward-sloping channel. That keeps me neutral bullish. But until I see a pivot point structure with signs of divergence in oversold conditions, it's difficult to get a proper RR.
Full TA: Link in the BIO
BTCUSDT.5L trade ideas

Markets Rally as Iran’s Strike Falls Short of Expectations🟢 Markets Rally as Iran’s Strike Falls Short of Expectations
One key point here is that global markets were bracing for a much more severe response from Iran toward the U.S. But when the actual attack turned out to be less intense than expected, risk assets — including crypto and stocks — started to climb, while oil prices dropped. Normally, heightened tensions in the Middle East would push oil prices higher, but this time, the opposite happened.
Another important factor is Bitcoin’s exchange outflows. As I’ve mentioned before, BTC leaving exchanges is a bullish sign — it means fewer coins are available to sell, which can fuel quick upward moves when a long trigger appears.
📍Wait for a clean long setup, and avoid emotional trades.
---
💬 Do you think the market is reacting rationally or emotionally right now? Drop your thoughts in the comments!

btc dirrectionnow days btc was bleeding much but to day was was recovering little as you see my last analyst it approaches the exact direction and I hope the coming days will go as I will insh Allah be ready for big bull run after it finish the last liquidity swept

A bearish trend is gradually taking shape.From a technical perspective, the complete breakdown of the box bottom, coupled with the MACD indicator about to fully crossing below the zero axis, both indicate that bullish momentum is weakening and a bearish trend is gradually forming. Short-term bulls need to take a temporary break and wait for the construction of a stabilizing platform. For bears, according to the current trend, they can lay out short positions on rallies. The ideal entry position is near the lower edge of the box, and they can try to lay out positions boldly after setting stop-losses.
On the news front, "Laote"'s policies change frequently, with extremely high uncertainty. The market needs global stability, and there has been no bull market in history built in a turbulent environment. Therefore, we need to treat market conditions cautiously, avoid blind and radical operations, and only by maintaining rationality can we respond to market changes.
you are currently struggling with losses,or are unsure which of the numerous trading strategies to follow,You have the option to join our VIP program. I will assist you and provide you with accurate trading signals, enabling you to navigate the financial markets with greater confidence and potentially achieve optimal trading results.
Trading Strategy:
sell@102300-102800
TP:100000-100500

BTC comleted wykoff with retest of sowJudging by 4h analysis, BTC completed wykoff with retest of sow and is getting completely obliterated now. Get out while you can! X_X

BTCBTC is currently trading within an 8H short FVG. For continued upside, a clean inversion of this zone is required.
Failure to flip this level may trigger a corrective move toward the $93K–$98K range. Monitor price action closely — confirmation is key.

Major Support Confluence, Tactical Rebound or Looming Flush?__________________________________________________________________________________
Technical Overview – Summary Points
__________________________________________________________________________________
Momentum: BTC is working a major daily support zone (102.6–103k USDT) with strong confluence across 1D, 12H, and 2H pivots. Technical rebound in play, but still no strong behavioral catalyst.
Supports / Resistances: Key support clusters at 102.3–103.3k (2H, 720min, daily pivots). Main resistances: 106.4k–110k.
Volume: Very high on 2H/1H near supports, hinting at possible washout/profit-taking. No buy climax identified.
Risk On / Risk Off Indicator: Strong bullish signal from 1D to 30min (neutral on 15min), while lower TFs remain under selling pressure.
Multi-TF Behavior (ISPD DIV): No excess or euphoria: market is waiting/compressed, caution is necessary in the short term.
__________________________________________________________________________________
Strategic Summary
__________________________________________________________________________________
Global Bias: Tactical bullish but cautious — confirmation on clean rebound needed to strengthen conviction.
Opportunities: Technical entries in the 102.6–103.3k zone with stops below 102k (aggressive) or 97.5k (defensive). Profit-taking zones at 106.4k/109.9k/110k.
Risk Areas: Invalidated below 97.5k (swing), potential flush down to 94k/88–89k. Heightened vigilance around macro releases.
Macro Catalysts: PMI prints (June 23), Fed on pause, increased geopolitical risks (latent volatility and cross-asset caution).
Action Plan: Prioritize active management: reduced position sizing, mechanical stops, and real-time bias adjustment based on volume and behavioral response.
__________________________________________________________________________________
Multi-Timeframe Analysis
__________________________________________________________________________________
1D–12H: Major supports (D Pivot Low 102626.8), structural uptrend, strong Risk On signal, but no behavioral/volume extremes.
6H–4H: Ongoing technical rebound, moderately high volume, support confluence, BUT short-term TF pressure remains.
2H–1H: Very high volume at support, possible local flush, but still no bullish behavioral confirmation—monitor for rapid volatility.
30min–15min: Tentative stabilization post-support absorption, no clear psychological excess, risk of further downside if rebound not confirmed; Risk On / Risk Off Indicator is neutral at 15min.
Summary: Bullish structural setup, but fragile micro dynamics—discipline and speed are key.
__________________________________________________________________________________
Fundamental & On-chain Overview
__________________________________________________________________________________
External factors: Fed on hold, US inflation slightly higher, robust economy, increased geopolitical risks (hot spots Israel–Iran, Ukraine–Russia). Latent risk-off sentiment but not yet materialized.
Calendar to watch: June 23, 09:45–10:00 UTC (US PMI & home sales).
On-chain: Low user activity, high institutional volumes, off-chain flow dominance, leverage high (mostly in stablecoins, limiting crypto-margined liquidation spirals), no euphoria or panic detected.
Risk/reward synthesis: Key technical buy zone 102.6–103.3k (stop < 102k/97.5k), targets 106.4k/109.9–110k. Below 97.5k: bearish bias, defensive risk management needed.
__________________________________________________________________________________
Final strategic synthesis
__________________________________________________________________________________
BTC remains "structurally strong but tactically fragile": major support confluence and bullish sectoral signal, but persistent micro selling pressure and macro/cross-asset uncertainty. Only entries on clear technical signals, mechanical stops and active risk management offer rational short-term setups in this volatile and compressed environment.
__________________________________________________________________________________

BTCUSD 4HThis chart presents a bearish setup for Bitcoin (BTC/USDT) on the 4-hour timeframe, shared by "Alpha_Gold_Trader." Here's the key breakdown:
---
Chart Breakdown
Current Price: Around $105,857
Resistance Zone (Register Point Level): ~$109,000 to ~$111,500
Support Zone (Breakout Level): ~$106,500 to ~$107,500 (pink box)
Bias: Bearish (implied by breakdown and downward projection)
Price Target: Around $95,000, labeled as "TARGET SUCCESSFUL"
---
Technical Implication
Price has broken below the support zone marked in pink.
A retest of broken support is anticipated before continuation down (common in breakout setups).
The setup suggests a short trade if price fails to reclaim the broken support and confirms rejection.
---
Trading Strategy Outline
Entry: Near $107,000 (on failed retest)
Stop Loss: Above $108,500 (back in the previous range)
Take Profit: ~$95,000 (target zone)

The end of Triangle?If yes, trend is over.
But, not sure where is the end of triangle.
06/17 or 06/20?
We should check this through analyzing afterward movements.
Low probability that it was not triangle.
If it wasn't, big ending diagonal will be made.
It means there will be more dip but high potential to make new ath(historical top/reversal point).
Let's check trend line/channel of these posts.
Checking retest is the key.
Still, short position has attractive price points.

BTC outlook Just as analysed , Bitcoin delivered nicely , and still delivering, now we expect to see a full drop to 74k

BTC: Bias Map 22/06/25Previous Week:
BINANCE:BTCUSDT BINANCE:BTCUSDT.P
Bias:
Spot buyer within 93.5k–88k BTC zone. This is the key support region
Structure:
- Weekly fair value gap sits between 93.5k–88k
- Still trending lower, no reversal yet confirmed
- Weekly has swept previous ATH and rejected without displacement
Plan:
- Watch for Bitcoin to move into 93.5k–88k
- No trading Monday - sitting flat
- Iran’s retaliation risk still unpriced — major global risk looming
- Structure or weekly reaction will determine next steps
Macro:
- Global risk extremely elevated with increased escalation risk from a potential Iranian response
- Risk assets like crypto are broadly unattractive in this environment
- Capital preservation is still critical
A key issue I dislike about this structure is the similarities it shares with the 2021 bull run, where we swept previous ATH, failed to displace and then rejected and moved -77%
I do not think we will see a -77% move however but a scenario where this shares similar structure and we visit the 70-60s is without doubt a clear probability and one that must be acknowledged
This week will be absolutely critical to be patient and watch how the middle east situation evolves. We are heading into a potentially very dangerous and uncertain era so caution is critical

BTCUSDT LONG POSITIONENTRY: 106206.92
TAKE PROFİT : 109798.83
STOP LOSS : 1/3
Do not use high leverage!
Remember cash management (planning)!
Please follow the stop-loss rule!

BTC/USDT – Technical Outlook:
📊 BTC/USDT – Technical Outlook
🗓️ Published: June 21, 2025 | 🕰 Timeframe: H4
🔻 Market Sentiment: Bearish
The BTC/USDT pair is currently exhibiting strong bearish momentum after a failed breakout above the 106,000 resistance level. The price has sharply declined and is now trading around 103,485 USDT, confirming a breakdown from the consolidation phase.
🔍 Key Technical Highlights:
Ichimoku Cloud Analysis:
Price is trading below the Kumo, indicating a bearish trend continuation.
The future cloud is thick and red, reinforcing downside pressure.
The Chikou Span (lagging line) supports the bearish outlook.
Structure & Volume:
Market structure has shifted to lower highs and lower lows.
A visible volume gap exists between 103,000 and 101,000 – suggesting price could drop quickly into the next demand zone.
Support & Target Zone:
Strong demand zone identified between 100,000 – 101,000 USDT.
This area previously acted as a high-volume accumulation zone.
Projection Path:
Based on price action and market momentum, a continued move toward the 100K psychological support is likely.
🧠 Professional Insight:
"The breakdown below the cloud and recent support level confirms seller dominance. As BTC loses strength below 104K, we anticipate a potential drive toward the 100K demand area, where buyers may re-enter."
📌 Strategic Trade Setup (Not financial advice):
Short Entry: Below 103,200
Target: 100,000 – 101,000
Stop Loss: Above 104,900 (just above the cloud)
Risk/Reward: Optimal 1:2+


BTC - SHORTBitcoin will do this in the next days, in a long term vision and i see it touchin the zones below 90,000. The start of a new downtrend!!! DYOR

BTC CORRECTIONBIG REASON WHY
Geopolitical tension. The war between Iran and Israel is inevitable. It's just a matter of time; either the USA, China, and Russia will be involved. The money will flow much more into safe havens like assets.
But based on the Jerome Powell interview after the FOMC statement, the US economy is going on the great path. We can say that if the USA is involved, it will cost the economy growth. But they still need to show the world who's the BOSS (military co.).
The conclusion is,
BTC is too risky for current conditions. As we know, the war might escalate.
BTC Projectory price
Nearest Area 94.5-95K
Mid term Area 85.4 - 86K
Worst Case 76.5-72-53.2K
P.S. Things will change rapidly; always monitor your portfolio and the news

BTCUSDT – Critical Price Zone | High Probability for Price DiscoBitcoin is currently trading in a critical price zone, showing strong momentum and bullish structure. If the current trend holds, there is a high probability for a price discovery move toward the $121,000 level.
Bullish Scenario:
A sustained move above current resistance which is 110k can trigger a breakout.
Targeting $121K as the next key upside level.
Invalidation Level / Stop Loss:
A daily close below $105K will invalidate the bullish structure.
This would likely lead to a deeper correction toward the $95K–$98K support area.
trade Setup Summary:
Entry Zone: green box
Target: $121,000
Stop Loss: Daily close below $105,000
if strong daily close below 105 k will have last chance to buy btc below 0.1 Million dollar
DYOR

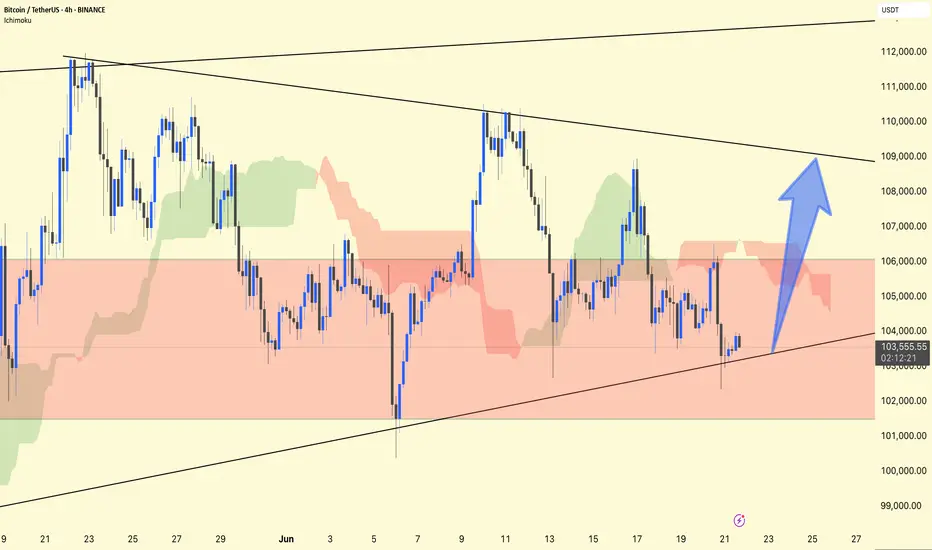
BTC/USDT 4H Technical Analysis UpdateCurrent Setup:
The price hovers within a range (highlighted in red), bouncing off its trendline support.
The RSI at 43 suggests it is close to the oversold zone, indicating a potential recovery.
Bullish Scenario:
If the trendline support holds, a breakout towards $108,000 is highly likely.
(Blue arrow points to the target zone.)
Risk Level:
Watch for a breakdown below the trendline, which could invalidate the bullish setup and send the price towards the $100,000 range.
Trade Plan:
Long entries near trendline support (around $102–103k), with a tight stop loss.
Target the upper trendline (~$108k), adjust as the price develops.
Stay alert!
BTCI believe Bitcoin is heading toward the upside targets. There are two buying zones; we are currently at the first zone, with another buying zone below it. You can split your entry between these two zones."

bitcoin update price broke the symmetrical triangle and moving up slow
but this false pump wont last long.
price just going to tap the fib level of 0.5 to 0.618 and might go a bit up just to trap longs.
i personally will enter short once we tap and reject 0.618.
thanks
$BTC 50 EMA Analysis – Daily Timeframe Price is currently hoverCRYPTOCAP:BTC 50 EMA Analysis – Daily Timeframe
Price is currently hovering just above the 50 EMA (blue line), which sits around $103,164, while BTC trades slightly higher at $103,774. Historically, as shown by the chart, BTC has respected the 50 EMA as dynamic support in uptrends and resistance in downtrends. Recent touches on the 50 EMA have triggered bounces, indicating it's a strong technical level.
🔸 Key Support Zone at $103,000 – $102,000:
If BTC holds above this zone, continuation toward previous highs is likely.
🔸 Upside Target: $108,000 – $110,000
Should the 50 EMA act as a springboard again, BTC could retest recent highs.
🔸 Risk Level at $101,500:
A daily close below this level may invalidate the bullish structure and trigger a deeper correction.
🔸 Outlook:
Watch for confirmation of a bounce above the 50 EMA. Bullish entries can be considered on strong daily candles above the moving average with tight risk management.

BTCUSD its BTCUSD taking for buy and i will like to follow according to my setups for buy and i will explain once i see and finish loading this first image since 2020

btc short now you have a very clear view of whats gonna happen
101k is inevitable. And if 101 dosent hold, 98 will be our balance point where market will go for making lower high and if price action changes we can go for a new ATH, which i guess will be our final ATH before we drop for a fresh new bear cycle.
thanks
