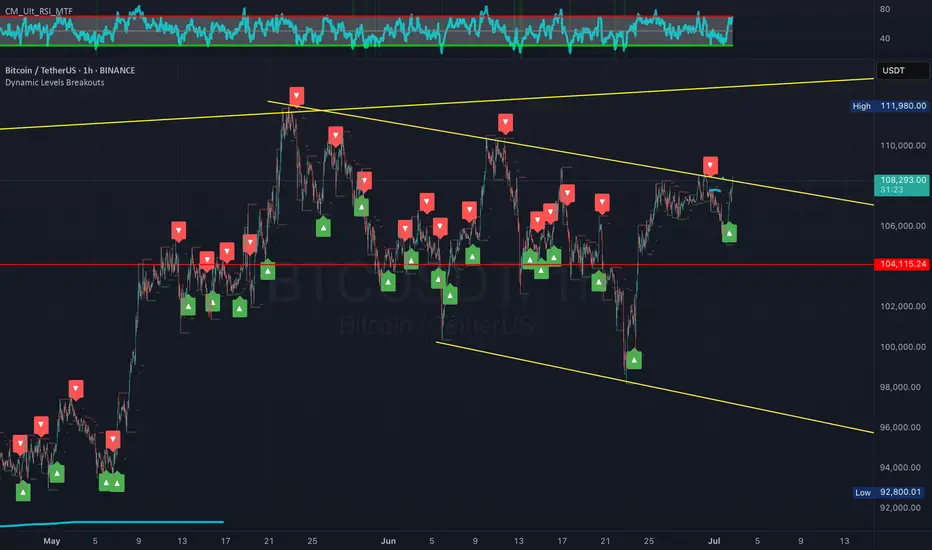
Bitcoin NEW ALL TIME HIGH ? Based on my analytic, bitcoin has possibility to hit the new all time high $113.500 .
If not there is also possibility of going down to 4h OB ( $106.10 0) and up to $113.500 .
Two scenarios possible!!!
First trade
Entry 108.937,7
SL 108.419,4
TP 113.599
Second trade
Entry 106.185,4
SL 104.972,7
TP 113.599
BTCUSDT.5L trade ideas

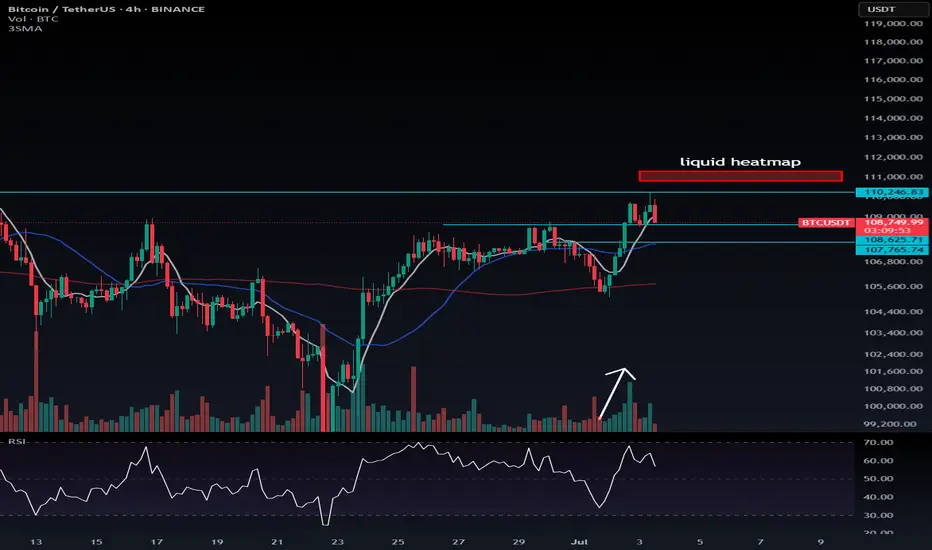
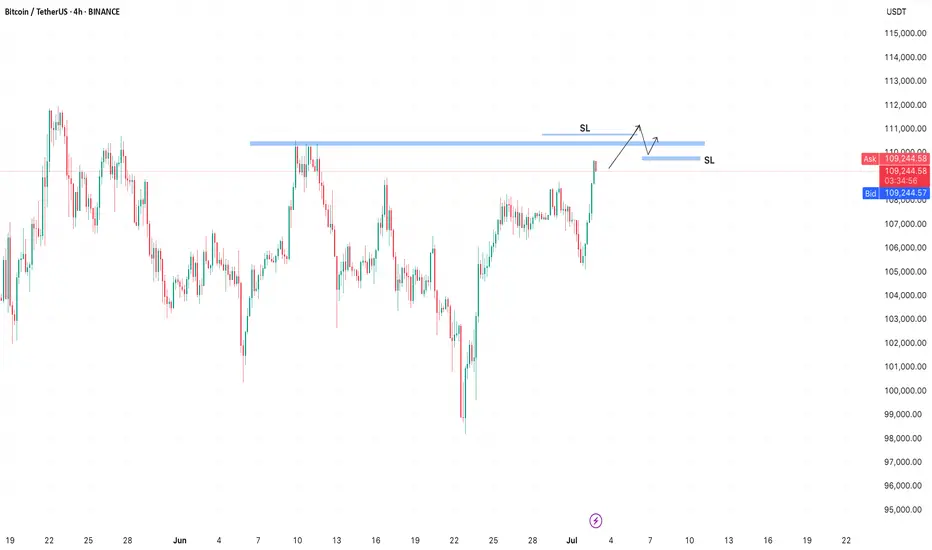
Bullish Momentum Building – Watch for a Sharp Move📈 Bullish Momentum Building – Watch for a Sharp Move
Since the upward move started from $105,363, we've seen a rise in volume alongside the price — a positive sign. If RSI on the 4H timeframe pushes into the overbought zone (above 70), it could trigger a sharp breakout.
Most short positions are likely to get liquidated between $110,880 and $111,320, which may overlap with an RSI breakout and add fuel to the move.
So here's how I'm planning this:
Use a stop-buy order to catch a breakout and enter a long position.
Place your stop-loss around $108,500.
For the entry point, check your exchange’s order book — I’m still not fully convinced $110,246 is the best trigger.
If price drops to around $107,765, it's not a big concern — the structure remains bullish. Ideally, though, we don’t want to go below $108,620.
Don't forget to manage your risk — fakeouts are still possible. And if you get stopped out once, don’t get discouraged. Stay focused — we might be close to a strong move over the next few days.
💬 What’s your plan? Drop your thoughts in the comments — I read all of them! www.coinglass.com
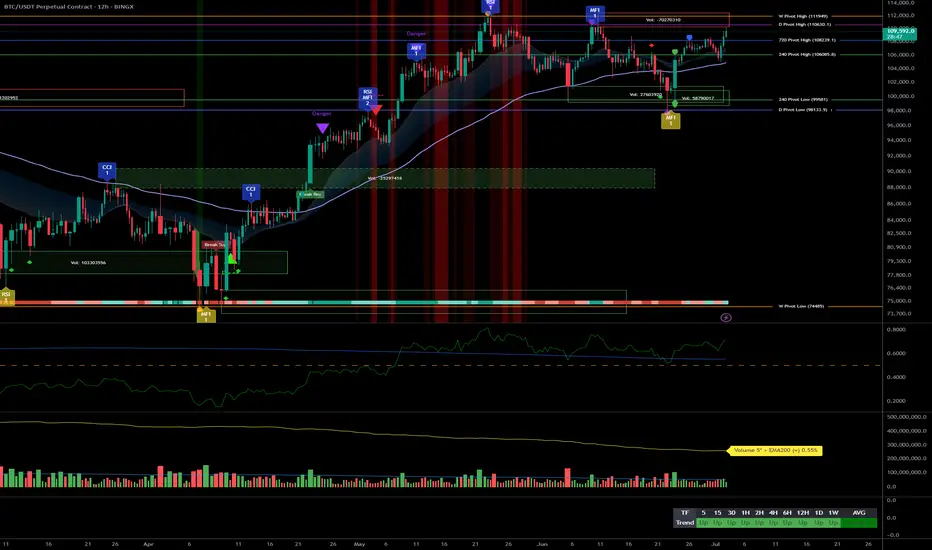
Bitcoin Robust Bullish Structure, Key Entries at 105k & 100k__________________________________________________________________________________
Technical Overview – Summary Points
__________________________________________________________________________________
Bullish momentum confirmed across all timeframes : Structure remains healthy, no behavioral anomalies detected.
Key supports: Main HTF pivot around $98,000–$100,000; first intermediate support zone at $105,000.
Major resistances: Critical area between $109,000 and $112,000, dense pivot and volume profile confluence.
Volumes: Normal to very high depending on TF, no speculative excess; gradual rise hints at possible expansion phase.
Risk On / Risk Off Indicator : Strong Buy from daily to 1H, shifting to neutral on shorter timeframes (30min–15min).
ISPD DIV/Mason's line: Predominantly neutral histogram, no overheat or capitulation detected.
Multi-timeframe behavior: Robust underlying structure, increased volatility but no massive selling stress.
__________________________________________________________________________________
Strategic Summary
__________________________________________________________________________________
Global bias: Bullish dominance as long as $98k–$100k holds.
Opportunity zones: Buy on pullback to $105k, swing confirm above $111k with volume/ISPD validation.
Risk / Invalidation: Stop loss below $98k; extra caution on macro/Fed events.
Macro catalysts: Fed/NFP-US (July 2–4), monitor behavior via ISPD DIV (blue to red).
Action plan: Structured and tactical long bias, “no trade” zone before major US releases, immediate stop on support break.
__________________________________________________________________________________
Multi-Timeframe Analysis
__________________________________________________________________________________
1D: Bullish momentum, no overheat. Pivot 98–100k = strategic fallback.
12H–6H: Signs remain bullish, no anomalies, intermediate supports at 105–107k.
4H–2H: Positive consolidation, rising volumes; possible accumulation on 105k dips.
1H–30min: Multiple resistances under 110–112k, very high volumes, maintain vigilance for sudden spikes.
15min: Extreme volatility, but no clear seller excess; watch for “trap” formation.
Risk On / Risk Off Indicator : Strong Buy on main timeframes, shifting to neutral/buy on 30min/15min (breather zone).
ISPD DIV/Mason's line: No buyer capitulation, overall neutral histogram.
Summary: Bullish cross-timeframe alignment, only macro events may trigger a break.
Key economic calendar
- 07/02: Powell speech – Potential added risk-on boost.
- 07/02: US tariff updates – Possible volatility.
- 07/04: NFP, ISM... High expected volatility.
Action : Heightened caution pre-announcements, validate through volume/ISPD.
On-chain: Dominant HODLing, no dumping, stable institutional volume.
Macro: Fed, inflation, geopolitics under watch.
Tactical: Spot any warning via ISPD or volume cluster.
__________________________________________________________________________________
Conclusion & risk management
__________________________________________________________________________________
Strong bullish bias as long as $98k–$100k holds .
Optimal buy on $105k/$100k dips, swing confirm on $111k break .
Outside of US events: strict tactical discipline required .
Absolute invalidation zone: break below $98k (HTF + STH cost-basis) .
Remain vigilant for ISPD red + volume spike / macro headlines .
__________________________________________________________________________________
BTCUSDTTHE current breakout from our 4hour channel signifies the presence of liquidity and a buy into 115k
with dollar index dropping ,NOW 108K broken,wait for retest ,buy and hold into 115k-118k supply roof.
#BTC #BITCOIN

You trade. You learn. You test. But results still slip. Why? Sometimes you feel like you know it all. You've tried dozens of strategies. Studied with the best. But in your head — there’s no clarity, in your trades — chaos, and in the end — you’re stuck in the same place. I’ve been there too. If this sounds familiar — keep reading.
Every day, thousands of traders enter the market and do everything "by the book": they open their terminal, draw levels, learn from the pros, read the analysis. Yet years later, they’re still in the same spot. Their results are random, unstable, or negative. Why?
🔹 Not because you didn’t study enough.
🔹 Not because you can’t read a chart.
💡 Most likely, your system isn’t fully built — or your goal is still unclear.
A goal is not a wish. "I want to make money" is not a goal. A real goal sounds like: to consistently earn $1,000 a month, spending 3 hours a day on trading. Or: to live off trading income and leave my job.
Different goals require different systems: daily routines, trade evaluation criteria, analysis frequency, and risk approaches.
Here are some examples of goals and the systems they require:
Goal: Consistent side income $1,000 a month with 3 hours of trading a day → You need a system with a clear schedule, ready-made analysis templates, minimal manual effort, asset/time priorities, clear trade filters, trade logging, and weekly/monthly feedback loops (what works, what doesn’t).
Goal: Passive income through investments (e.g. 15% annual return on capital) → You need a system that includes regular fundamental analysis, long-term trend evaluation, clear rules for portfolio formation and rebalancing, risk limits per asset, profit/loss realization strategies, trade logging, and quarterly feedback reviews.
Goal: Full-time trading income, consistently earning $10,000 per month → You need a system with strict risk control, a daily trading rhythm, emotional stability support, trade tracking, and daily/weekly feedback (what’s working, what’s not).
What happens without a goal and system?
The trader opens a chart and starts "looking for an opportunity." Today it’s scalping, tomorrow swing, the next day — "I’m just observing."
📉 They don’t know what to focus on.
📉 They lose concentration.
📉 They jump into trades because "something must be done."
📉 They burn out. Because there’s no sense of progress.
Without a goal, you can’t build the system you need. A goal sets the direction and evaluation criteria.
Without a system, you can’t reach the goal: you might have knowledge, actions, and effort — but they don’t add up to results. Just noise, fatigue, and the feeling of being out of sync with the market.
A system is what connects your goal and actions. It gives you stability, filters out distractions, keeps you focused, and reduces impulsive behavior.
If this feels familiar — it’s a signal. Your system and goal need an upgrade. Many start with a random mix of actions hoping for results. Few take the step toward clarifying their goal and building their system. You can be one of them — if you have a map and a direction.
Everything starts with a clear personal goal — not a generic one, but truly yours.
You can use 3 practices to help you:
Goal — what you truly want from trading, specifically in numbers and timelines.
Sub-goals — how to break the path into clear steps based on your resources.
Hypothesis — what exactly you’re testing right now to stay focused.
Each of these is a practical step that brings clarity and direction.
📌 Define your goal — and keep it.
It’s your starting point. It marks the transition from reactive trader to conscious professional.
See you in Part Two — where we’ll build the system that brings you to that goal.
Let your chosen goal inspire and support you on the journey.
Value every step and your own effort.
Take care — and trust your path.
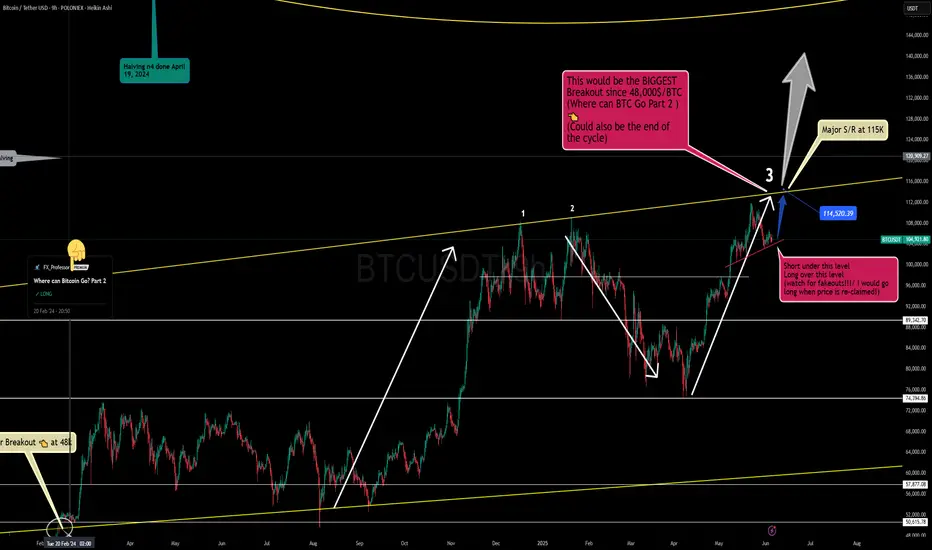
Where Can Bitcoin Go? Part 7Title: Where Can Bitcoin Go? Part 7
Post:
🌍📊 Where Can Bitcoin Go? Part 7 🧭🔥
This is it — Part 7 of our ongoing macro Bitcoin analysis — and this one is rooted in the three all-time trendlines that I’ve used for years to map out Bitcoin’s biggest moments.
We are now heading north, potentially to do something historic : test the upper trendline resistance for the third time . 📈
When Bitcoin does this, it tends to either break out massively ... or signal the end of a cycle . That’s why this zone — 114.5K to 115K — is critical . A successful breakout here and $100K becomes history . It would unleash Bitcoin into a new phase of its long-term bullish evolution. 🦅
On the flip side: this might also mark the final resistance of the current cycle . Either way, it’s a zone where serious decisions will be made — and manipulation will likely spike. 👀
🔑 Key Levels:
114,520–115,000 : Breakout zone — reclaim this and we’re headed higher.
97,770 : Key support — fail to hold, and we reassess the bullish case.
🎥 Want to better understand the levels in play? Watch my latest video idea, where I draw comparisons between BTC now and the Brexit 2016 setup. This will help you see why I’m preparing for major volatility . 🚀📈 Bitcoin smells like 'Brexit to the NORTH Pole!' 💥🇬🇧
I’ll post the video link below once live — keep an eye out for it!
👇 Previous post: “Bitcoin smells like 'Brexit to the NORTH Pole!’”
One Love,
The FXPROFESSOR 💙
ps. Big breakout at 115k or end of cycle? I am hoping for the first!
BITCOIN SELL TRIGGERED Following our previous analysis, BTC took both the sell-side and buy-side liquidity. It's currently within a premium zone and has major supply, so a sell entry was triggered.
Risk management is intact, target 1:3 RR. Good luck fams.

BTC COMING UP"I believe the price might face a rejection at these levels. I plan to continue my buys from the Fair Value Gap (FVG) zone marked with a dashed line below. Wishing everyone successful trades!

BTC weekly price predictionthis is my personal idea and analysis and i dont follow any other one analysis

BTCUSDT daily analysisia have shared one hour timeframe analysis and this is daily timeframe and i am following priceaction candle and volume with SMC and more my own personal and private strategies

BTC inverted head n shoulder to 120kBTC inverted head n shoulder to 120k. I'm sure everybody has seen this set up but I just wanted to document it for myself.
A break and re-test of 109500 could get us to the measured move of 120k.
I'm laddering in.

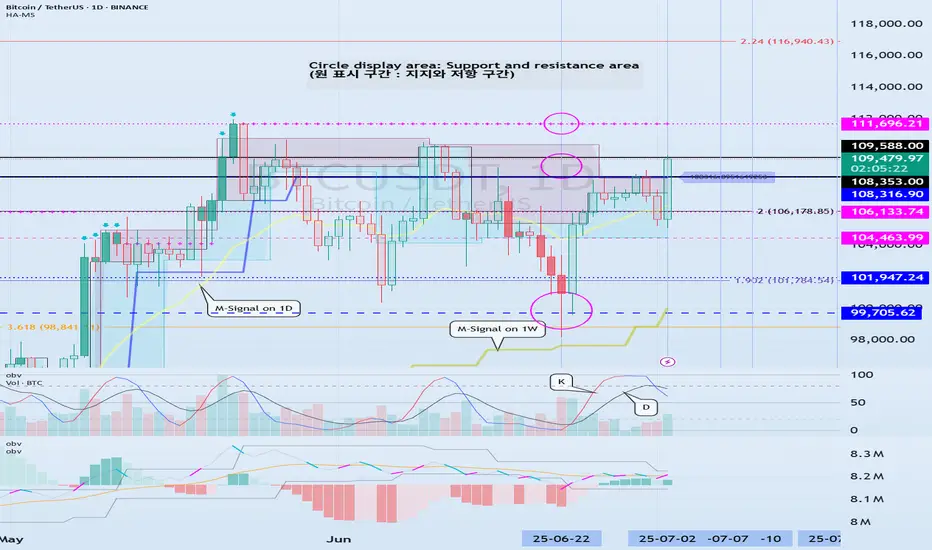
BTCUSDT price predictionafter crossing up supply area and tuching the price given market is comming down again for long time

Check support at 108316.90-111696.21
Hello, traders.
If you "Follow", you can always get new information quickly.
Have a nice day today.
-------------------------------------
(BTCUSDT 1D chart)
Among the many trend lines, the one marked 1W is the important one.
Therefore, we need to look at whether it can rise above the 1W trend line or rise along the trend line.
If not, and it falls below 108316.90, it may lead to further decline, so we need to think about a countermeasure for this.
This volatility period is expected to continue until July 3, but it is expected to last until July 11, so caution is required when trading.
-
Indicators that indicate high points are DOM(60), HA-High, and StochRSI 80.
HA-High and StochRSI 80 are formed around 108316.90, and DOM(60) is formed at 111696.21.
Therefore, the 108316.90-111696.21 section is a high point boundary section, and if it is supported and rises in this section, it is highly likely that a stepwise uptrend will begin.
The conditions for a stepwise uptrend to begin are:
- The K of the StochRSI indicator must show an upward trend below 80,
- The PVT-MACD oscillator indicator must show an upward trend above the 0 point,
- The OBV of the Low Line ~ High Line channel must show an upward trend. If possible, it is better for the Low Line ~ High Line channel to form an upward channel.
When the above conditions are met, I think that if it is supported and rises in the 108316.90-111696.21 section, it is highly likely that a stepwise uptrend will continue.
If the above conditions are not met, it is likely that it will show a downward trend again while pretending to rise.
-
Thank you for reading to the end.
I wish you successful trading.
--------------------------------------------------
- This is an explanation of the big picture.
(3-year bull market, 1-year bear market pattern)
I will explain more details when the bear market starts.
------------------------------------------------------
BTC is approaching a strong zone!BTC has a strong zone around 110,500 where a large number of orders are stacked.
In crypto, it’s common for stop losses to be taken on both sides.
After a breakout above the zone, short sellers get liquidated, while buyers enter the market — only to be stopped out by a false breakout when the price drops below the zone to trigger their stops.
Btcusd techinical analysis.Btcusd technical analysis next move posibale at h1 time frame.not finchinal advice.

BTC massive sell BTC massive sell is about to begin
Wait for confirmation
Buyers are active in the supply zone
Watch out for potential turning points
To the down or upside.
Proper risk management is advised
Happy trading.

BTC Just Breakout! Are we ready for new ATH? BTC just breakout from 4h trendline and anticipate for any retracement soon before sky rocket into new ATH, historically saying my target will be on $148k.
NFA!!
DYOR!!

BTC short squeeze in the makingMany people believe that BTC is running "too hot," and we're seeing what appears to be a short squeeze. We all know what's next. No one in their right mind will buy at the top, esp. given it's volatility. Some economic events are right around the corner over the next 1-2 weeks which could impact BTC and S&P. Typically, market rallies are short lived, esp. when the fundamentals are out of whack. Unemployment is cooling (remember is a lagging indicator), high # of bankruptcies, housing unaffordability highest in decades, high interest rates, student loans will start making a dent soon...the list goes on. Don't let the Champagne effect fool you! Berkshire stocking up on cash for a reason.
Best of luck and always do your own DD! Staying positive, with a healthy dose of keeping things real.

Bitcoin - Flag pattern is brokenBitcoin had been consolidating within a flag pattern for the past three months. That pattern has now officially broken to the upside, with the price surging to $109K — a strong bullish signal fueled by encouraging news around institutional adoption.
Based on both the technical flag breakout and ongoing fundamental momentum, the next target for Bitcoin is $145K. Any move beyond that would be considered a bonus in this current bull cycle.
Stay tuned for more updates.
Cheers,
GreenCrypto

BTC Weekly Analysis : Rise or Fall ? Let's SeeBy analyzing the #Bitcoin chart on the weekly timeframe, we can see that last week’s candle closed at $108,350, and BTC is currently trading around $107,500. If the price manages to hold above $105,700, we could expect further upside momentum. The next potential bullish targets are $111,700, $124,000, and $131,800.
So far, this analysis has yielded over 9% return, and we’ll be sharing more updates soon from lower timeframes!
🎥 If you enjoyed this video analysis and found it helpful, please show your support with a LIKE and COMMENT below!
These video-style breakdowns take time and effort, and I’ll only continue them with your support 🙌
Your engagement is my biggest motivation to keep going 💛
Thanks for being part of the journey!

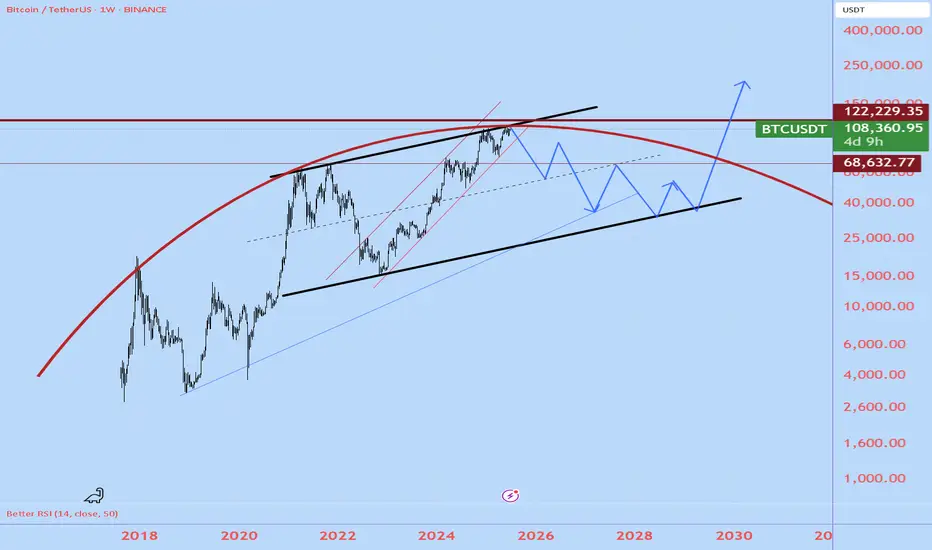
BTCusdtWill BTC go for another 4-year cycle? Everything is possible..
I think the next weeks will be conclusive to see if we can stay in the red channel or will go down.
I believe BTC will reach about 35K, but in a zigzaggy way, giving push to altcoins seasonally.
It is just speculation
BTC SCALP TradeWait for the entry then take with small amount no high risk must use SL. If BTC don't retrace towards 106.5k in coming hours then don't take risk on shorting it will breakout towards 113k

HUGE SHORT ON BTC - SIMPLE AS THATas per title. Don't need to mention, it very easy to know that it will drop.