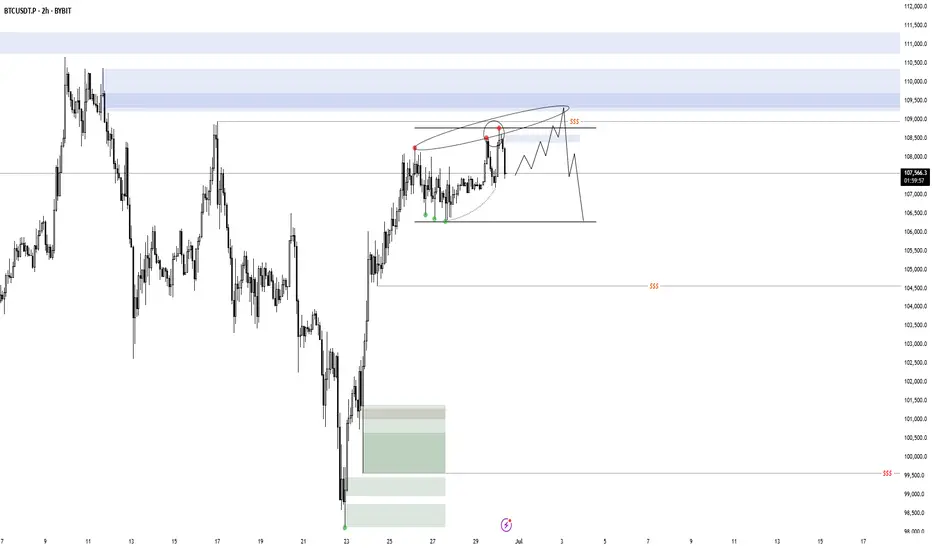
Waiting for the Liquidity Flush – Will We Get That Drop or a StoCurrently holding a short position and have been waiting for a decent liquidity flush towards my TP zone for almost a day now. The thing that bothers me is how slow the price action is—it's grinding lower, but at the same time, building up a new liquidity shelf just above my entry.
This makes me concerned that we might see a quick liquidity sweep to the upside (taking out stops, possibly including mine) before any real move down happens. The area around my TP is loaded with liquidity, but the market seems hesitant to make that push.
What’s your opinion—are we likely to get that clean drop soon, or should we brace for a fake-out and stop hunt first?
BTCUSDT.5L trade ideas

BTCBtc was trading inside falling wedge since a weak. it has cleared it now and has very good possibility of pumping hard to 112k

[SeoVereign] BITCOIN Bearish Outlook – June 29, 2025We are the SeoVereign Trading Team.
With sharp insight and precise analysis, we regularly share trading ideas on Bitcoin and other major assets—always guided by structure, sentiment, and momentum.
🔔 Follow us to never miss a market update.
🚀 Boosts provide strong motivation and drive to the SeoVereign team.
--------------------------------------------------------------------------------------------------------
Hello,
This is Seobeorin, approaching technical analysis not as a result but as a prediction, from a realistic perspective.
I am presenting a bearish view on Bitcoin as of June 29, 2025.
If you refer to the Ethereum idea from June 27, 2025, you can confirm that I presented a bearish perspective on Ethereum at the time. The basis for that perspective is still valid, and we are currently waiting for the take-profit level to be reached. The reason I selected Ethereum at the time was because I believed that the downward pressure on Ethereum was relatively stronger than that on Bitcoin.
However, based on today’s Elliott Wave count on the Bitcoin chart, I now judge that Bitcoin is also likely to experience some short-term downward pressure. Therefore, I am presenting a short position idea on Bitcoin.
The first take-profit target is set near $106,056. Depending on future price movements, this take-profit target may be narrowed or expanded. I will continue to track this idea, and as it develops, I will align the reasoning accordingly to organize the thought process more clearly.
Thank you.

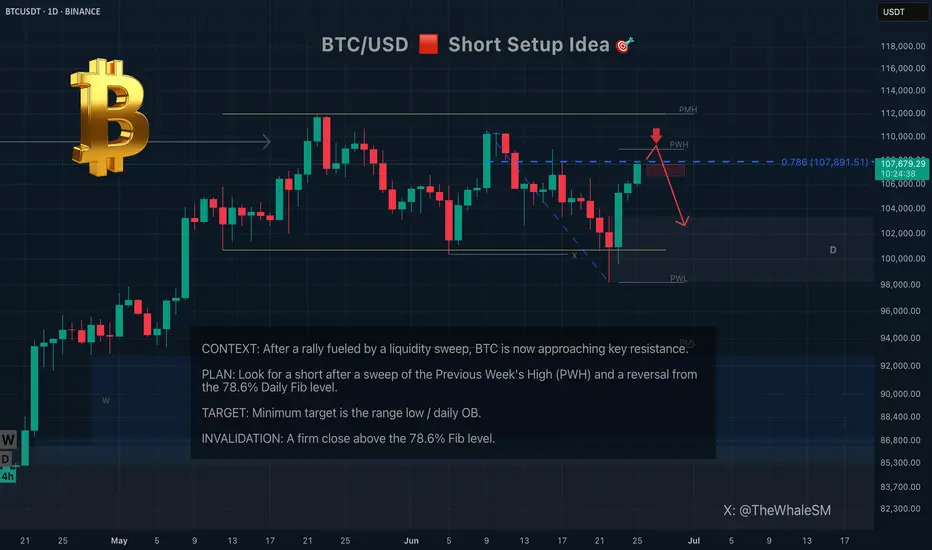
Bitcoin (BTC) Short Setup at Key Daily ResistanceIn this analysis, you will find a clear scenario for a potential short setup with precise conditions for confirmation and invalidation. No fluff or guesswork—only institutional analysis of capital footprints and pure price action. I will provide updates for every stage of price interaction with the POI in near real-time, so you can make timely trading decisions, not just observe events after the fact.
Context: What Happened Before?
Bitcoin has perfectly played out Scenario 2 from my previous long analysis. After the liquidity sweep below, which confirmed that the instrument is locked in a large global range, it began an aggressive, correction-less rally. This is often the case after absorbing a large amount of liquidity, which essentially became the fuel for this rise.
The Short Setup
To break out of the range to the upside (or at least make a deviation above it), Bitcoin must overcome the first serious resistance zone. This zone consists of:
The 78.6% Fibonacci level from the daily structure.
Liquidity from the Previous Week's High (PWH) .
My plan is to look for a short position if we see a reversal reaction from this zone after the liquidity is taken. The minimum target for this move would be the lower boundary of the range and the daily order block located there. This local move inside the range can be seen as a shorting opportunity.
Invalidation of the Short Scenario:
A break of the 78.6% level with the price closing firmly above it would cancel the short scenario. In that case, Bitcoin would likely continue its move towards the next resistance level.
BTC AnalysisSince the red arrow was placed on the chart, Bitcoin's bullish phase has ended and it has entered a corrective phase. This correction appears to be forming a Diametric pattern, and we are currently in the middle of wave E.
After interacting with the demand zone, the price may move toward the specified targets.
A daily candle closing below the invalidation level will invalidate this analysis.

BTC/USDT – Intraday Plan (15m, Ichimoku) by RiscoraToday’s idea:
I’m expecting a retracement to the 107,867 level as a pullback to the recent impulse. The move we observed earlier aligns with my prediction from last Friday — liquidity was taken out above the highs, and now I anticipate a deeper correction against the overall bullish move.
My main scenario for the day is a move down into the 106,400 area at minimum, targeting the liquidity below.
Ideally, I’d like to see a push to 107,870 first, as that would provide the best entry for a short setup. I’m willing to open a short in that scenario, but it’s important to remember the higher timeframe trend remains bullish, so any short should be approached with caution.
Key levels:
Retracement target: 107,867
Main downside target: 106,400
Cautious shorting only — trend still bullish overall
Let’s see how the price develops. Will update if conditions change.
#BTC #Crypto #Trading #Ichimoku #Riscora

BTCUSDT – Spring + S&R Rejection | 15min Power EntryBTCUSDT – Spring + S&R Rejection | 15min Power Entry
📅 June 26, 2025
Price swept support and printed a clean spring pattern on the 15-minute —
Rejection off key structure + volume surge confirms buyers are back in control.
✅ Demand stepped in hard
✅ Strong wick below consolidation
✅ Protected by the rising 200 EMA
✅ Entry aligns with a Fibonacci 1.618 projection target
I’m long to 109,290.56 — nothing less.
Stop is clean, invalidation obvious.
BTC just tapped the spring — I’m in.

BTC 30.06.25So far BTC is behaving exactly as expected, i'm just waiting for a valid setup to appear. I would love to see a model 1, which takes out the high and mitigates supply, but i'm also not ignoring a potential model 2. These 2 deviations merge together on a higher time frame, where the range is also valid on, so they can be counted as one. There are many altcoins with similar behavior and USDT/C in potential accumulation. I'm waiting to see confirmations/ invalidations.
BTC Breakdown Escalates Bearish MomentumBitcoin has officially broken below the critical 104K support level, invalidating the recent short-term bullish structure. The price action reflects a clear shift in market sentiment, confirmed by the bearish EMA/SMA crossover and a firm rejection from the strong supply zone between 110K–111.8K.
This rejection formed a clean lower high around 110K, followed by a decisive drop below the weak supply area and failure to hold 104K a key level previously acting as a demand floor. The current structure now favors downside continuation, with the 98K zone as immediate focus.
If bearish momentum persists, attention will shift toward the Weak Potential Reversal Zone and eventually the Recommended Buy Back Zone around the 84K–86K area. This zone aligns with a historical support range and may offer high-probability entries for medium-term accumulation.
Until price reclaims the 104K–105.5K region, rallies are likely to be sold off within the supply zones. Short-term traders may look to trade the breakdown toward the highlighted support levels, while long-term investors should monitor price reaction within the buyback region.

BTCUSDTHello Traders! 👋
What are your thoughts on BITCOIN?
Bitcoin has once again failed to break above its previous high and entered a corrective phase. The price is now moving within a channel and is approaching the lower boundary of that channel.
The correction is expected to continue toward the support zone and the bottom of the channel, where we may see buying interest and a bullish reaction.
If Bitcoin breaks above the channel resistance and key supply zone, it could trigger a strong upward move and lead to new all-time highs.
Key Note:
Price action near the channel support and demand zone will be crucial. A successful rebound from this area may signal the start of the next bullish leg.
Will Bitcoin hold the channel and bounce higher, or is a deeper correction ahead? Share your thoughts below! 🤔👇
Don’t forget to like and share your thoughts in the comments! ❤️

PSYCHOLOGY OF A CRYPTO CYCLEWe expected a pullback, and now thats behind us!😅
The market is back on track, and we are firmly in the #Belief phase of the bull cycle.
With heavy short liquidity stacked around $110K, a push into that zone could trigger a short squeeze, launching us into the #Thrill phase.
And if momentum holds, all signs point to #Euphoria by late 2025.
Favorites so far this cycle:
🥑 POLONIEX:GUACUSDT 🔗 POLONIEX:LLUSDT 🎮 KUCOIN:MYRIAUSDT
🌐 HTX:SYNTUSDT 🧪 MEXC:DEAIUSDT 🏠 OKX:PRCLUSDT
🧱 MEXC:YBRUSDT ⛏️ MEXC:KLSUSDT 🧩 $RUJIUSDT
Comment below your favorite coins!

NEXT LEVELSnext move ahead for Bitcoin
Bitcoin Could Reach $140,000 in the Coming Months
Market analysts and crypto enthusiasts are increasingly confident that Bitcoin is on track to reach new highs. After strong institutional adoption, growing interest from retail investors, and the impact of recent halving events, many experts believe Bitcoin could surge to $140,000 in the coming months.
Macroeconomic factors like inflation concerns, limited BTC supply, and a weakening dollar are all contributing to the bullish momentum. If current trends continue, a breakout toward the $140K level is not just possible—it’s becoming more likely.
Stay informed, stay strategic, and get ready for what could be a historic move in the world of crypto.

110k soon , best time to buy altcoins Btc still didnt complete main wave 5 , btc for last time touch 98k but this time price will attack 110k and then we will have NATH.

DeGRAM | BTCUSD once again trading above $105k📊 Technical Analysis
● Fresh bounce off the confluence of the 8-month up-sloping purple trend-line and 102-103 k green demand box prints a higher-low inside the rising wedge, keeping bulls in control despite June’s pull-back.
● Price is reclaiming the minor down-trend line from the 12 Jun high; a daily close above 106 k confirms a bear-trap and unlocks the 111.8-112.5 k supply at the wedge cap.
💡 Fundamental Analysis
● Spot-ETF desks absorbed >5 400 BTC in the last three sessions while exchange reserves fell to a four-year low, signalling supply drain.
● Cooling US PCE expectations trimmed real yields, and Mt Gox repayment delays ease overhang fears—both supportive for risk assets.
✨ Summary
Long 102–104 k; hold above 106 k targets 111.8 k → 115 k. Bull thesis void on a 16 h close below 99 k.
-------------------
Share your opinion in the comments and support the idea with a like. Thanks for your support!

Bitcoin short position After my win streak from previous trades on btcusd I happy to give me to the people who followed me
Here's another great trade for you
Short Bitcoin with a limit order at 108,500
Take profit at 101k , stop loss at 109,500
A 7.5 to 1 risk reward ratio 🔥😉
You can never find anybody trade Bitcoin like me


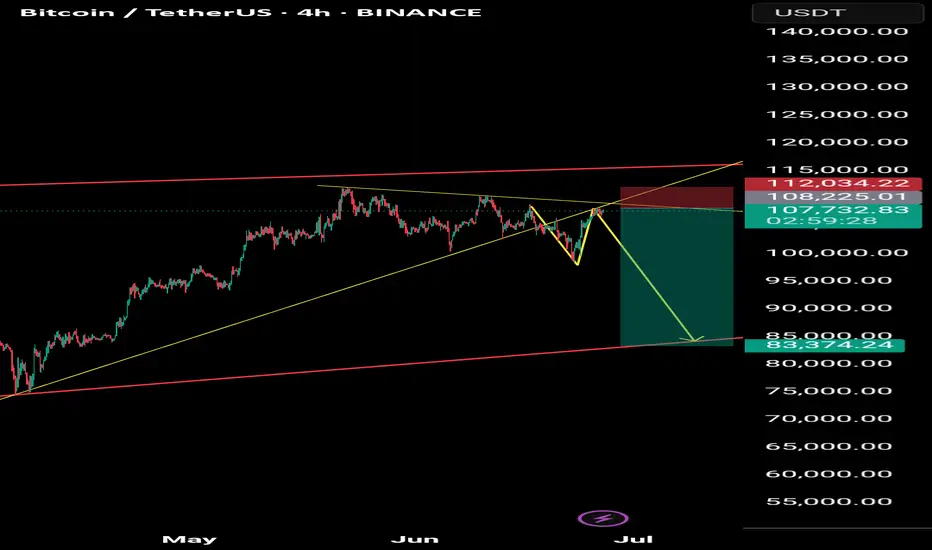
Bitcoin sell short 83000After breaking the long-term trend line and pullback, ready for a sharp move and correction to 83,000
Two Possible #BTC Scenarios: July ATH or September Bull Run?#BTC
#1First Scenario: A pullback to $98K first, followed by a breakout from the Bull Flag pattern targeting $120K and a new ATH by the end of July.
#2Second Scenario: Another pullback, some consolidation to build strength, then a move to a new ATH and a full-fledged bull run into September. In this case, we might rally straight up to $130K without major corrections.

BTCUSDT Short Setup Below Major Trendline ResistanceBTCUSDT is currently testing the upper boundary of a descending trendline, which has acted as strong resistance over multiple touches. Price is now at $106,300, a key area aligned with previous rejections and now forming a potential lower high within the structure.
This setup presents a short opportunity, with:
- A clear rejection level at the descending trendline.
- A defined Stop Loss at $108,270, just above recent swing highs and the upper trendline.
- A Take Profit target at $100,559, a level near the bottom channel and prior support.
Trade Parameters:
- Entry: ~$106,300
- Stop Loss: $108,270
- Take Profit: $100,559
- Risk:Reward Ratio: ~1:2.91
A breakdown from this level could trigger continuation to the downside, while a close above the trendline with momentum would invalidate the setup.
Bias: Bearish Rejection from Trendline
Confirmation: Strong wick or bearish engulfing candle near the resistance zone

Bitcoin Crash Will Continue to Levels that will REKT majority!??MARKETSCOM:BITCOIN crashed towards $98k so far! Almost 10% drop so far! Crypto noobs and mass media manipulators will blame this CRYPTOCAP:BTC crash on the Iran and Israel conflict! Professional traders will, however, tell you that this was orchestrated and the crash was already planned beforehand, and the best traders caught the crash from the top at $109k and made a profit on this Bitcoin correction! Professional insider trading against news manipulation, artificial conflicts, and emotional trading !

#BTCUSDT.p Bearish📉 Short Trade Alert! We're eyeing a potential downside move with a clear entry, stop loss, and multiple profit targets. Keeping a close watch on this one. #Trading #MarketAnalysis #ShortTrade #RiskReward

Wednesday, Trade of the day 📊 Wednesday Trading Update
Tuesday didn’t give us any tangible plays — price action was choppy, unconvincing, and mostly noise. But that’s behind us. Let’s see what Wednesday brings, especially with London and NY sessions ahead.
Midweek is notoriously volatile for BYC, and historically, Wednesday has often been the day that breaks the range or gives us a proper deviation setup — so eyes sharp today 👀.
My trades today will stick to standard range plays, nothing forced. We're still sitting above 4H supply, and unless we get a clean breakout with structure shift, I’ll remain cautious and reactive, not predictive.
Here’s what I’m watching today:
👉 Look for clear market structure shifts on the LTF (lower timeframes)
👉 Divergences can give early signs if you're using oscillators
If I get time, I might record a quick session later. No promises, but I’ll update if that changes.
🎥 If you're unsure what to look for, go back through the video archive — everything you need has already been broken down in detail.
📅 Weekly Schedule:
Wednesday – ❌ No class
Thursday – ❌ No class
Friday – ❌ No class
Let’s stay sharp — volatile Wednesdays tend to reward patience and precision.

BTCUSDT Technical Outlook TC is trading at $106k , with resistance confirmed near $106.14k–$106.22k and support at $104.8k .
A daily drop below $104.8k would confirm a short setup. Conversely, a break above $106.2k on elevated volume is required to challenge the $107k–$108k zone.
Absent significant volume, expect continued sideways action between $105k–$106k.
