Bitcoin just gave a masterclass on Effort vs. Result.War news? Massive sell volume? No breakdown.
✅ Held and reclaimed the 200 EMA
✅ Price stayed elevated despite heavy effort to push it down
This is bullish divergence in action:
Big effort, little result = strength.
🎯 If this holds: $71.8K → $73.6K → $75K are in play.
Bears failed. Structure stands. Follow price, not panic.
BTCUSDT.5L trade ideas

BTCUSDT ShortBTCUSDT – Watching 105.8K–106.5K Supply Zone
Price currently retracing after a strong dump from 108K. I'm eyeing the 105.8K–106.5K zone for a potential short — previous order block + premium zone for smart money selloff. If price rejects there, I’ll target 103.5K and possibly 101K. SL above 106.8K.
Structure still bearish until proven otherwise.

btc movement in 45minAfter the formation of strong bullish candles, in my opinion, an upward movement can be expected. The targets are shown on the chart.

A BUY OPPORTUNITY ON BTCUSDPrice currently trade at 104,730.33 In today’s analysis, I anticipate a buy opportunity to emerge from the current market price. I expect price to rise up to 108,377.77
A buy opportunity is envisaged.

Signs of manipulation or ‘trapping’ behavior!Bitcoin (BTC) is currently approaching a key support level on the chart. This support zone is an area where price has historically shown a tendency to hold or bounce back upward due to increased buying interest. At this stage, there is a possibility that BTC could initiate a bullish move or a price pump from this level. However, it’s important to be cautious, as the market could also exhibit signs of manipulation or ‘trapping’ behavior.
In such scenarios, what often happens is that before making an actual upward move, the market might perform a ‘fake move’—this means it could temporarily dip below the support level or show some downward pressure to shake out weak hands or trigger stop-losses. This false breakdown creates panic and uncertainty, only for the price to reverse and then begin moving upward shortly afterward.
If the support holds and buyers step in with enough strength, BTC could gain bullish momentum and head toward the upper liquidity areas. These zones typically have a high concentration of pending orders (such as stop-losses or take-profits), which can attract the price like a magnet. This liquidity often sits just above recent highs or resistance levels, and reaching this area could result in further volatility.
However, traders are strongly advised to remain vigilant and not rely solely on assumptions. The crypto market is highly unpredictable, and price action can be deceptive. Always perform your own in-depth analysis, consider various technical and fundamental factors, and manage your risk wisely.
This is not financial advice please Do Your Own Research (DYOR) before making any trading decisions.

BTC - setupWe’ve just broken through the trend reversal zone.
My buy order got triggered, which means my $BTCV position — initially opened at $101.000 — has now been scaled up.
My stop-loss is set just below the 0.786 level, around $102.000
LFG 🚀

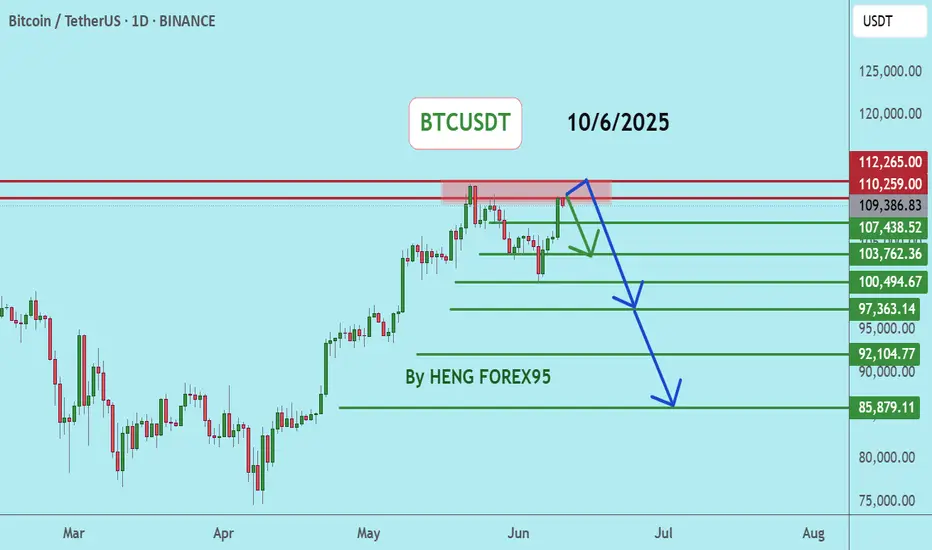
BTC Short-term selling pressure due to war news💎 BTC PLAN UPDATE (June 13)
NOTABLE NEWS ABOUT BTC:
Prices of Bitcoin (BTC), Ethereum (ETH), and Ripple (XRP) slipped as rising geopolitical tensions between Israel and Iran sparked a wave of risk aversion across crypto markets. As uncertainty deepens, the three largest cryptocurrencies by market capitalization are on track to close the week in the red, with current price action signaling the potential for a deeper correction.
Bitcoin bears regain control
After failing to reclaim its all-time high of $111,980 earlier in the week, Bitcoin lost upward momentum and began a steady pullback, slipping below key support at $106,406 on Thursday. As of Friday, BTC continues its downward trajectory, hovering near the 50-day Exponential Moving Average (EMA) at $102,447.
TECHNICAL ANALYSIS PERSPECTIVE:
We successfully identified the peak at the 110K resistance level. As predicted, BTC dropped $7,000 following disappointing CPI and PPI reports. Currently, the price has fallen back into a descending channel pattern and is expected to decline further.
Bitcoin’s upward trend is under threat as funding rates become more constrained.
Earlier this week, Bitcoin hovered near its all-time high of $111,980, but market sentiment remained alarmingly cautious—likely due to uncertainty in the macroeconomic environment.
The path of least resistance is gradually shifting downward, especially as the Relative Strength Index (RSI) falls to the midline at 50 from a recent high of 64 on the daily chart. Traders will look for bearish confirmation signals from the Moving Average Convergence Divergence (MACD) indicator—signaled when the blue MACD line crosses below the red signal line.
Watch for long positions around the 100K price area, with a target back to 103K. If the price breaks below the 100K support level, we should avoid holding onto a bullish bias.
At this time, whether you’re a newcomer or experienced trader, it’s advisable to spend time practicing and reinforcing technical analysis knowledge. Explore educational posts on the channel to build a stronger foundation and avoid potential losses.
==> This analysis is for reference only. Wishing all investors successful trades!

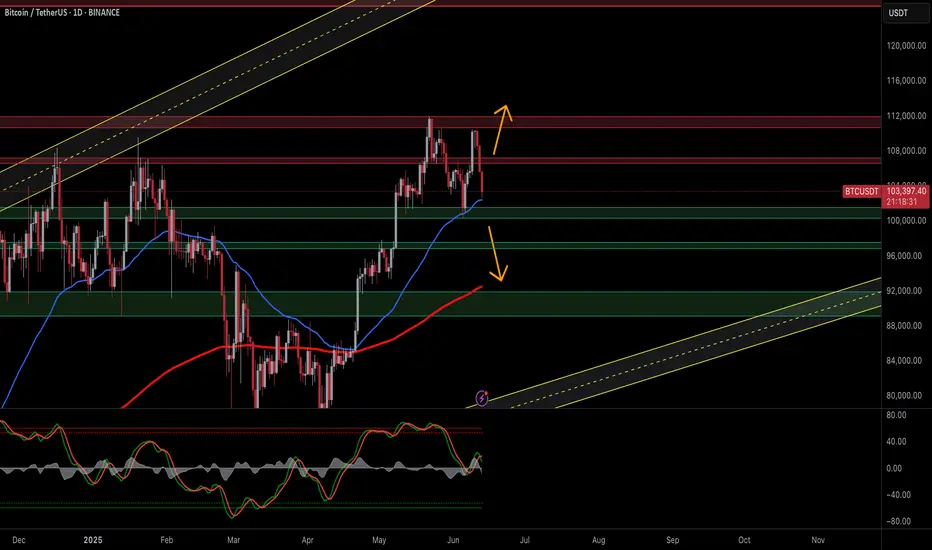
$BTC/USDT 1D Quick Analysis$BTC/USDT 1D Quick Analysis
Bitcoin is under pressure after rejecting the $112K–$113K resistance zone. It’s now testing key demand at
$ 101,000–$ 104,000.
If bulls defend this zone, a short-term bounce toward $ 107,000–$ 109,000 is possible.
But if $101K breaks, BTC may correct deeper toward $91K.
The structure has turned bearish.
Watch this demand zone closely.
DYRO, NFA

Bitcoin Key Market Structure Update
🔑 ZemoG Trading — Bitcoin Key Market Structure Update
As outlined in our previous analysis, a decisive close below 109.6k signaled the start of Bitcoin’s anticipated decline, pushing price action toward completing the right side of the unfolding market structure cycle.
BTC has now tapped 103.6k, a significant wick level and established point of control — areas where liquidity hunts and sharp reversals are not only possible but expected.
Whenever price strikes these structural pivots, the market seeks to rebalance by sweeping residual wicks before resuming the primary trend.
🔍 What’s Next?
For our upcoming short entry opportunities, we are watching for precise reactions and rejection patterns at the following upper wick clusters:
104.6k
105.3k
105.8k
106.4k
107.1k
108.2k
108.8k
🎯 Short-term Downside Targets:
102.3k (interim support)
101.4k (secondary profit zone)
100.6k (key structural break level)
A confirmed close below 100.6k will validate further downside continuation and unlock the next leg of the sequence.
🧭 Key Takeaway:
Patience and precision are your greatest allies. Wait for the key levels and execute with discipline.
1️⃣1️⃣
♾️ Trust the sequence. Respect the reversal. Repeat the mastery.
— ZemoG Trading

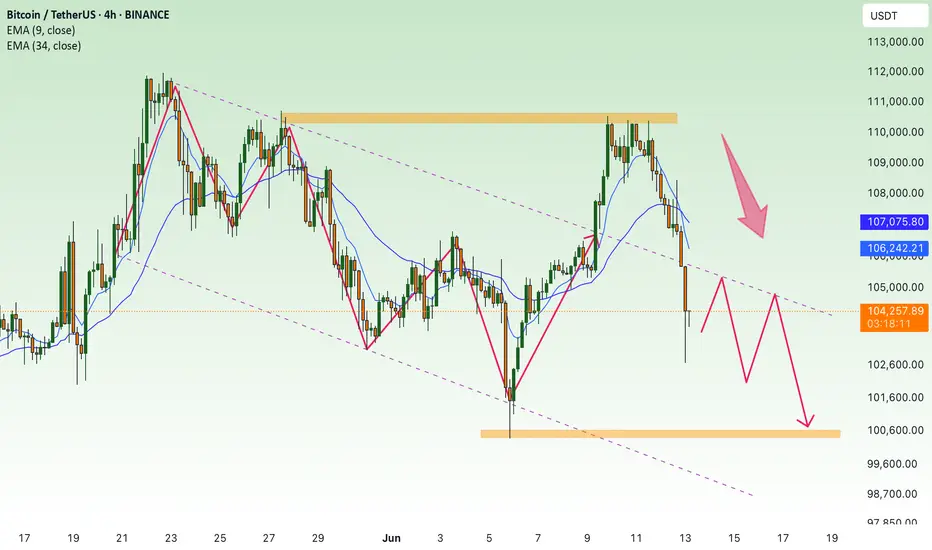
BTC/USDT 4H Chart Update –BTC/USDT 4H Chart Update –
After a strong rejection from the $110K+ zone, Bitcoin is now retesting a critical trendline support on the 4-hour chart.
Key Highlights:
Price dropped sharply to $103K, almost tagging the key ascending support zone.
The previous breakout from the descending trendline is now being retested, which is a classic bullish retest pattern.
If bulls defend this region successfully, expect a potential bounce towards $108K–$ 114 K.
However, a clean breakdown below $102K would shift short-term momentum bearish.
Eyes on this zone. High-probability decision area.
Watch for reaction candles and volume spikes to confirm the next move.
Thanks for your support!
DYOR. NFA

BTC Reacts to Iran–Israel Escalation: Risk-Off Sentiment GrowsBitcoin (BTC/USDT) — Caught Between Fear & Fundamentals
Technical Outlook — 13 June, 2025
Current Market Condition:
Bitcoin has dropped to $103,818 after facing rejection from the $106.8K–$108K resistance zone, coinciding with heightened geopolitical stress following renewed military escalation between Iran and Israel. Traditional markets are showing signs of risk aversion, and while Bitcoin is often seen as a hedge, the current flight to USD liquidity and defensive assets is putting pressure on high-beta instruments like crypto.
The psychological $100K support zone, which aligns with the EMA 50 and a key Fib level, is the immediate area to watch. A failure here could expose Bitcoin to deeper retracement toward $96,800 and potentially $92K, especially if global tensions worsen or investors rotate further into cash and gold.
Key Technical Highlights:
Rejection at supply zone near $106,888–$108,000.
Support at $100K holds structural and psychological importance.
Stochastic shows bearish momentum crossover, increasing downside probability.
EMA 200 at $92K could act as ultimate cushion in a full-blown correction.
Volatility likely to remain elevated amid Middle East conflict and global uncertainty.
Trade Plan:
🔼 Bullish Relief Bounce (Long Bias):
Trigger: Reclaim and hold above $106,888 with rising volume
Target: $108K → $112K → $116K
Stop Loss: Below $103,500
🔻 Geopolitical Risk Sell-Off (Short Bias):
Trigger: Break and close below $100,000
Target: $96,816 → $92,000 → $88,000
Stop Loss: Above $102,500
📉 Dip Buy Strategy:
Trigger: Price stabilizes at $96.8K with divergence and calming geopolitical headlines
Target: $103K → $106K
Stop Loss: Below $95K
🛡️ Risk Management Note:
With geopolitical risk driving short-term sentiment, expect volatility spikes, whipsaws, and fake breakouts. Remain nimble and manage exposure carefully — especially during weekend sessions when crypto trades unhedged and news developments can occur without warning.
📢 If you found this analysis valuable, kindly consider boosting and following for more updates.
⚠️ Disclaimer: This content is intended for educational purposes only and does not constitute financial advice.
BTC 4hr POC, 200EMA, Golden pocket confluenceBTC 4hr POC, 200EMA, Golden pocket confluence.
Looking at smaller timeframes for bullish divergence for entry.
This could be the bounce to test new ATH.
Break of all these support will be a big drop.

Bitcoin Double Top FormationIf we lose 102k we will dump to 97-93k and alt will rugged
but if we can hold maybe sideway and retest 110k again

BTC down to 70k...maybeI've been saying this for a while now -> Most people are just not ready for BTC volatility. It may go up to 150k one day, but NOT before it hits a few trees first and maybe a cat. Best offset here is UVIX (think market volatility insurance, up +6% earlier today), Gold, and Oil now that things are heating back up again!
Best of luck and always do your own DD!

BTCUSDTBTCUSDT price is now near the resistance zone 110259-112265. If the price cannot break through the 112265 level, it is expected that the price will drop. Consider selling the red zone.
🔥Trading futures, forex, CFDs and stocks carries a risk of loss.
Please consider carefully whether such trading is suitable for you.
>>GooD Luck 😊
❤️ Like and subscribe to never miss a new idea!
BTC - On its way down from these trendlines How low can we go? We will find out.
Three bearish intersecting trendlines above.
Short began initiating from above as per my previous post.
I personally am not ruling out a flash crash to 10,000.
DXY is breaking down a major bearish trendline on the weekly / monthly - Market has a prime opportunity to manipulate Bitcoin into all of these long stop losses and trigger a massive liquidation event.
Stay alert and safe!

BTC bearish outlook going as planned Just as analysed , by is dropping, I would want to see price take out his 4h low , and also ,mitigate the 95k level

BTC 4HR Fair value gap/golden pocket trade to POCBTC 4HR Fair value gap/golden pocket trade to POC.
2:1 risk reward and maybe let a little bit run in case we go banana bull mode.

bitcoin for long *The content on this analysis is subject to change at any time without notice, and is provided for the sole purpose of assisting traders to make independent investment decisions.

It can beTo reach higher prices, you must definitely collect fuel and this fuel we have eaten the traders.!!
It can be

How To: Avoid paying Taxes on my Trading Gains?***Make sure to read this through. At the bottom is an email you can fire off to your CPA as well as your funded broker with the right questions to get you started***
In the video above I gave you the thought process and questions that come to me from many people weekly. I want to share with you guys a method you can use which depends fully on weather its availble by your broker or not.
The Issue: I am getting payouts from my broker but I dont want to pay taxes on it. What do i do?
The Answer: There is no way to AVOID paying taxes but There are some questions you need to ask both your Broker where you have or will have your funded account, as well as ask your CPA if you are using one, which will or will not allow you to move your "GAINS" directly into an investment account without paying an INCOME tax.
Bare in mind, the bottom line is that if its possible for you to do this, youll most likely need to set yourself up an an 'entity' like an LLC or an S-Corp.
-----------------------------------------
Can you trade through TradingView using a funded account?
Yes. Most prop firms (like Apex, My Funded Futures, etc.) allow access to TradingView via third-party routing systems like Rithmic, CQG, or Tradovate.
Can you send trading profits directly into an investment account (e.g., with Fidelity or First Fidelity Trust)?
Not directly.
Most prop firms pay out to you personally via: ACH / PayPal / Wire
The payout is treated as income, not capital gains — you’re usually issued a 1099. So short-term capital gains don’t apply here — it’s contractor income.
Can you route those funds into an investment or retirement account?
Only indirectly, if you:
Set up a legal entity (LLC/S-Corp)
Prop firm allows payouts to that entity
Entity sends funds to a brokerage or retirement account
This gives you:
Tax management options
Ability to fund SEP IRAs, Solo 401ks, or other investment vehicles
Business deductions and better income structuring
Important: Not all prop firms support this. You must ask.
What happens if you just take the payout personally?
You’ll owe taxes on the income that year. If it's a large amount and you're not using any tax strategy, this can be a big hit — and you won’t be putting that money to work in a retirement account, which could have deferred or reduced the tax burden.
Why do traders want to route funds into investment accounts?
To defer taxes
To compound gains in tax-advantaged environments
To avoid having income hit their personal checking and be immediately taxed without structure
To separate business income from personal finances.
Who should you talk to?
A CPA who understands prop firm payouts + entity structuring
The prop firm support team
Your investment account provider (e.g., Fidelity, First Fidelity Trust)
If You’re Using Your Own Capital (Not Prop Firm Capital)
When you're trading from a cash account funded with your own post-tax money (like a personal account at Tradestation, Fidelity, Interactive Brokers, etc.), you're in a completely different tax situation compared to a funded prop account.
Im trading with a CASH ACCOUNT and this money was already taxed. Why am i paying more tax?
1. You’re Right: That Money Was Already Taxed
If you earned money through a job, business, crypto sale, whatever — and then you funded your trading account with it — yes, that money has already been taxed as income, capital gains, or whatever the original source required.
But…
2. Trading Gains Are Still Taxable — Separately
Once that taxed money is used to generate more money via trading, those gains are now a new taxable event. Here's why:
The IRS doesn’t look at “double taxation” in terms of the original dollar — it taxes the gain on that dollar.
For example:
You fund your account with $10,000 (already taxed)
You trade it up to $15,000
You now owe taxes on the $5,000 gain, not the $10,000 you started with
So no, you're not being taxed twice on the same dollar — you're being taxed on new earnings generated from that dollar.
3. Type of Tax Depends on Holding Period
Day Trading / Short-Term (< 1 year):
Taxed as ordinary income, same as your paycheck (could be 10–37%)
Long-Term Gains (1+ year):
Taxed at long-term capital gains rates (typically 0%, 15%, or 20%)
This only applies if you’re not trading inside a retirement account (IRA, 401k, etc.).
So What’s the Advantage in Routing Gains Into an Investment Account?
This is where people try to get clever.They want to avoid realizing gains in their personal account because:
It may bump them into a higher tax bracket
It may trigger estimated tax payments
It might disqualify them from certain tax credits
So the idea is:
“Can I send the profits somewhere else (like an IRA, trust, or investment vehicle) so I don’t get taxed now?”
Answer: Only if the gains were made inside that tax-advantaged account to begin with.
You can't trade in a regular brokerage account and then “move” those gains into an IRA to defer tax. That’s not how tax shelters work — they only protect gains earned inside them.
Does Being Self-Funded Change the Tax Situation?
Scenario = You fund trading with post-tax dollars ---- Not taxed again on that base
Scenario = You generate gains from trading ---- Yes, new taxes on new profits
Scenario = You want to avoid immediate taxation ---- Can't defer taxes just by moving profits
Scenario = You trade inside an IRA/401k ---- Gains tax-deferred or tax-free
Scenario = You trade through a prop firm ---- Income tax, no capital gains involved
----------Here is an email to get you started. Send this to your CPA and your Funded account broker----------
Questions to Ask Your Prop Firm (If Using Funded Accounts)
Do you allow payouts to a legal entity (LLC or S-Corp)?
Can payouts be directed to an investment firm or custodian?
Can the account be held in my entity’s name?
Do you issue 1099s for entity payouts, or only for individuals?
Are there limits or fees for routing payouts to a business or trust account?

BITCOIN 2.5% Potential DropIt seems like BINANCE:BTCUSDT has lowered its trading volume and is potentially looking to make a correction in the upcoming days.
