BTC/USDT – Intraday View (15m, Ichimoku) by RiscoraYesterday’s plan worked out partially. For now, I believe the bullish move has run its course and today we should see a corrective phase. My main target for the correction is the yellow block at 106,300.
Ideally, I’d like to see a pullback towards the entry area before the move continues.
The scenario is invalidated if we break above the previous high — in that case, I’ll reconsider the outlook.
Key levels:
Correction target: 106,300 (yellow block)
Entry retest preferred
Invalidation: new local high above yesterday’s peak
Monitoring price action and will update if the setup changes.
BTCUSDT.5L trade ideas

BTCUSDT: Bullish Outlook Following Liquidity Sweepnavigating around pivotal areas defined by Breaker Blocks (BB) and Fair Value Gaps (FVG) on both the 1-hour and 2-hour charts. These zones represent high-probability areas for market reactions, whether as support for continuation or as points for potential short-term retracement before a larger rally.
strongly favors a bullish continuation for BTC. monitor interactions with the identified BB/FVG zones for optimal entry points, anticipating a potential dip to sweep short-term BSL or mitigate imbalances before the next significant leg up.

Timeframes in Trading: Which Chart Tells You WhatHello, traders! 👋🏻 Why can the same chart tell a different story on 1D, 4H, or 15M? You’ve probably been there. BTC looks bullish on the daily… bearish on the 4-hour… and totally sideways on the 15-minute. So, which one is right?
The truth is: none of them is wrong. They’re just telling different parts of the story. Understanding timeframes in trading isn’t just a technical skill. It’s how you decode what the market is actually doing.
Every Timeframe Has a Role
Think of timeframes like zooming in and out on a map: The 1W chart tells you where the mountain ranges are, the macro trend. The 1D chart shows the highways and the current direction within that macro. The 4H chart reveals city streets, the local trend swings. And the 15M chart? That’s the back alleys, where the noise and micro moves live. BTC, for example, doesn't behave the same way across these views, and it shouldn't.
What Happens If You Ignore Timeframes?
You try to short a "breakdown" on the 15M, only to realize you just sold into 4H support.
You enter a 1D bullish breakout, only to panic when price pulls back aggressively on the 4H… forgetting that the 4H was just doing a retest. Or worse, you start trading against the macro trend, thinking the 15M chart holds more weight than it actually does.
How Professionals Read Timeframes (BTC Example)
Example:
You can start high, work down: 1W → 1D → 4H → 1H/15M. Check the macro first. Is BTC bullish, bearish, or ranging on the 1D or 1W? Then, you can map key levels: Support/resistance from higher timeframes is 10x more meaningful on lower timeframes. For example, BTC’s $30K, a weekly level, creates reactions even down on 5-minute charts. And, align context: A bullish setup on 15M is excellent, but check if it aligns with the 4H trend direction. If the 4H is also bullish, your setup has context. If not, expect chop.
🔗 BTC Right Now: Timeframe Confusion in Action
Just look at the current BTC structure. On the 1W, BTC is still trending higher, higher highs and higher lows from the $15K bottom in 2023. On the 1D, BTC trades inside a broad consolidation range after a strong uptrend. The price has repeatedly tested the $107K–$112K zone, acting as a key resistance cluster, while forming a series of higher lows. It's not a breakdown but a correction inside a bullish structure, testing previous supply zones. The 4H? Chaos. The price bounces between $105K and $112K, which is pure range behavior. The 15M? Traders are getting whipped trying to catch fake breakouts that mean nothing in the daily or weekly context.
Which Chart Tells You What?
All of them. But differently.
THE 1W TELLS YOU THE NARRATIVE.
THE 1D SHOWS YOU THE CURRENT DIRECTION.
THE 4H REVEALS TRADEABLE SWINGS WITHIN THAT DIRECTION.
THE 15M CAPTURES THE NOISE, THE TRAPS, AND THE MICRO OPPORTUNITIES.
If you’re only looking at one timeframe, you’re only seeing part of the picture. So, timeframes aren’t about right or wrong. They’re about perspective. If you’re a day trader, you probably live on the 5-minute to 15-minute charts, while still peeking at the 1H or 4H for structure.
If you’re a swing trader, the 4H and 1D are your home base, with the weekly chart guiding the bigger story. And if you’re thinking in months or quarters, the 1W and 1M are what actually matter – everything else is just noise.
So next time BTC feels “confusing”… zoom out. Or zoom in. The answer is probably hiding in the chart, just not the one you were looking at. Which timeframe do you trust the most when trading crypto? Drop it in the comments!

Bitcoin Technical Analysis | The Most Important Channel 📊 Bitcoin Technical Analysis | The Most Important Channel You’ll Ever See!
This might be the most critical BTC chart you come across. I've mapped out the key ascending channel that has defined Bitcoin’s long-term trend over the past few years. The upper boundary, lower boundary, and especially the midline have repeatedly acted as dynamic support and resistance levels.
Right now, BTC is trading near the channel top, with strong bullish momentum. While the buying pressure remains high and a breakout is possible, watch out for potential rejections or fakeouts around this area.
All major support and resistance levels are clearly marked in this chart. Make sure to draw this channel on your own chart and use it as a powerful tool in your trading decisions.
🧠 Follow for more high-probability setups, smart technical insights, and real-time updates!

Title: BTC at the Upper Trendline – Breakout or Breakdown IncomiTechnical Analysis (4‑Hour Timeframe)
🔺 Upper Trendline Resistance: BTC is touching the upper line of a descending channel—firm resistance around 107.5k–108k.
📉 Bearish Pressure: Failing to break out here could trigger a downward move.
🔻 Key Support: A decisive break below 99.5k–100k opens the path to 98k–95k, and potentially down to 92k if trend weakness persists
🔺 Bullish Scenario: If BTC closes above 108k on 4h, it could rally toward 110k–112k
binance.com investopedia.com binance.com
.
Geopolitical volatility (U.S.–Iran/Israel tensions) drove BTC briefly below 99k, low of 98.2k, before bouncing back near 101.2k
Volume & momentum: RSI dropped with the dip; watching volume near critical levels like 107k–108k is key

HolderStat┆BTCUSD broke the trend lineOKX:BTCUSDT on the 3h chart is accelerating from a breakout above $104,000 after several consolidation phases. Price is approaching $109,000 resistance. A breakout above this could trigger a run toward $112K+.

What's Next For Bitcoin?Bitcoin Eyes A New ATH In the Upcoming Days...
But Do Not Be Surprised If BTC Drops Back To 90K.
Studying Previous Cycles, Showed Massive Drop Before the Bull Run.
#bitcoin #crypto #btc #trading #trader #portfolio #technicalanalysis

Btcusd sell setup H4Hello! Friends,
Greetings. Please leave a Like if you like the idea.
Before start talking about technical Let's share your LOVE by giving me LIKES to support this work. Thanks in advance.

BTC Short from H1 FVG + H4 OB Confluence — Risky Setup✅ Price in strong supply confluence (H1 FVG + H4 OB)
✅ SFP & order block add to short case, but context is choppy
⚠️ Trade is low conviction, manage size and stops accordingly
Short Scenario:
Entry: In $107,500–$108,500 zone (confirmation from SFP/OB)
Target: $104,000–$105,000 (D1 FVG zone)
Stop: Above $108,500 or invalidate on strong reclaim
🔔 Triggers & Confirmations:
Look for reaction (SFP, rejection wicks) in FVG/OB zone before adding
Exit quick if invalidated or strong momentum up
🚨 Risk Warning:
Not a high conviction setup; use smaller position size and stay nimble

BTC SELLIn higher Time Frame Poi zone Tap and Nd Also Liquidity Swift in that zone I plan to sell here first Target 106000.
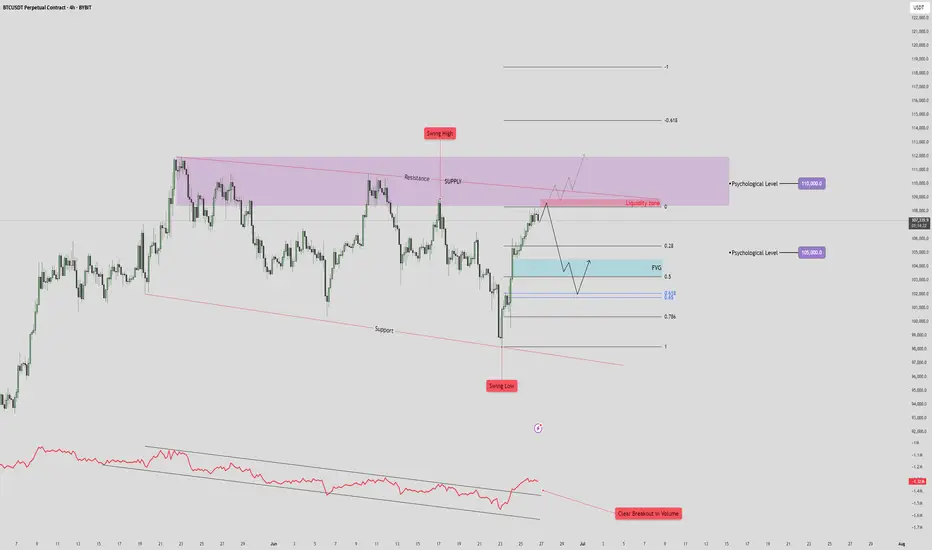
BTC/USDT Drop to 101k?🧠 High Time Frame Context
Trend: Consolidation within a broad range (support and resistance clearly defined).
Key Psychological Levels:
105,000 USDT – minor level, acting as a magnet in short-term PA.
110,000 USDT – major supply confluence and liquidity target.
🟪 Supply & Resistance Zone
Zone: Marked in purple (108.5k-112k).
Key Observation:
Swing high formed inside this zone, indicating liquidity trap.
Potential fake-out or strong rejection from this area.
Strong confluence with a descending resistance trendline, adding to the selling pressure.
🔵 Fair Value Gap (FVG) & Retracement Targets
FVG identified just below the current price (~103.5k-104.5k).
Price is projected to:
Reject from the current high.
Drop to fill the FVG zone.
Possibly bounce between FVG and Fibonacci retracement levels:
0.5
0.618
0.786
🔴 Volume & RSI Divergence
Volume breakout is noted on the last push down (bottom red annotation), followed by a retrace.
OBV shows bullish divergence with price:
🔻 Support Structure
Lower red trendline is a key long-term support.
Previous swing low aligns with this trendline – buyers showed strong interest here.
If FVG fails to hold, expect a retest of this trendline near 97,000–98,000.
📈 Likely Scenarios
Base Case (Neutral-Bearish):
Price rejects current zone (~107,000).
Pullback into FVG (101–104K).
Bounce to 105K (minor resistance), then decide next direction.
Bullish Breakout:
If price breaks and closes above 110K, it invalidates supply zone.
Opens door to 115–118K range.
Bearish Breakdown:
Fails FVG zone.
Tests previous swing low and support (~97K).
Below that, structure becomes macro bearish.
🧩 Summary
Short-Term: Retracement into FVG likely. Monitor reaction.
Medium-Term: Bearish bias while price is below 110K.
Invalidation for bears: Clean break and hold above 110K.
BTCUSD I H8 CLS I Monthly OB I ATH Coming then $200KHey, Market Warriors, here is another outlook on this instrument
If you’ve been following me, you already know every setup you see is built around a CLS Footprint, a Key Level, Liquidity and a specific execution model.
If you haven't followed me yet, start now.
My trading system is completely mechanical — designed to remove emotions, opinions, and impulsive decisions. No messy diagonal lines. No random drawings. Just clarity, structure, and execution.
🧩 What is CLS?
CLS is real smart money — the combined power of major investment banks and central banks moving over 6.5 trillion dollars a day. Understanding their operations is key to markets.
✅ Understanding the behavior of CLS allows you to position yourself with the giants during the market manipulations — leading to buying lows and selling highs - cleaner entries, clearer exits, and consistent profits.
📍 +200K in play
"Adapt what is useful, reject what is useless, and add what is specifically your own."
— David Perk aka Dave FX Hunter ⚔️
👍 Hit like if you find this analysis helpful, and don't hesitate to comment with your opinions, charts or any questions.

#BTC Update. Here's the trigger point.CRYPTOCAP:BTC Update:
Bitcoin is trading around the key $108K resistance, one of the most crucial levels for bulls to break.
A strong close above this zone could spark a rally toward $ 117,000. However, if rejected, we might see a pullback to $ 103,000.
I’m not touching futures just yet.
I’m okay with missing a few green days; I’d rather wait for clear momentum than get caught in this choppy price action.
Let me know what you think in the comments.
Thank you
#PEACE

SatochiTrader Expecting a huge BTC CRASH AFTER This..BTC Market Update by SatochiTrader
EVERY CRASH DID START WITH A FALSE INCREASE TREND.
Depending on the market sentiment and price action, BTC is currently showing strength with a positive trend. However, based on deeper data and insights held by myself and a small group of early-cycle followers, this current movement may be a deceptive signal — potentially foreshadowing a major crash.
This is not trading advice. Those who are confident in the long position should continue, and those on the other side should stay prepared as well.
We have previously explained that the current cycle appears to have ended. Since 2013, BTC has consistently respected its macro cycle targets. The end of such a cycle typically leads to significant corrections.
A cycle ending implies not just a retracement, but the potential for a major crash. Hedge funds and real BTC whales understand the underlying indicators and risks at play. Our expectation remains clear: BTC may soon fall below the 100K level, with $85K identified as a critical support and target zone.
Stay sharp. Stay informed. The market may look bullish — until it isn't.
The best way to follow BTC is not the news.. but the cycle overview.
This update is an education update, which means the high expectations of the upcoming correction for BTC.
Compared to last quarter, miners are now less severely underpaid, though profitability remains low

BTC 26.06.25This could be the range i was waiting for to create the 3rd tap of the accumulation model later. Yesterday we had a mini model 1 at NY open which could have had the intention to be the starting point of the new range. I am now watching for new deviations which then would form a bigger range. There is nothing but liquidity until 104.536$ which would be a perfect target for a range low, but until there are no confirmations this only is an expectation. If the accumulation model is already complete, like i mentioned in my last post, then the target becomes the range high (110.652$).

BTC Key levelsBTC key levels are below
These are very important levels for reversals and breakouts.
111, 898
97,893
89,362
74, 538

Today's BTC trading strategy, I hope it will be helpful to you Four Bullish Drivers Behind Bitcoin's Rally
(1) Institutional Capital Rampage: From Whale Holdings to Market Scarcity
- **BlackRock et al. as anchor investors**: BlackRock's Bitcoin ETF (IBIT) has ballooned to $71.9 billion, holding 660,000 BTC—equivalent to 3.1% of total circulating supply. Such "whale-level" positions not only provide liquidity support but also shatter traditional financial institutions' attitude toward crypto.
- **Accelerating OTC concentration**: OTC platform data shows Bitcoin inventory plunged from 166,500 coins at the start of the year to 137,400 coins, a 17.5% drop. This signals massive coins are shifting from exchanges to institutional custody, creating a "scarcity effect" analogous to apple prices surging due to supply shortages.
(2) Fed Rate Cut Expectations Ignite Hot Money Inflows
- **Policy pivot-driven capital reallocation**: After Fed Governor Bowman signaled a possible July rate cut, CME futures now price in two 2025 rate cuts (up from one). Historical parallels: Bitcoin surged 42% in 6 months post-Fed's first 2019 rate cut (S&P 500 +12%), as low rates enhance Bitcoin's appeal as a "non-sovereign asset".
- **Diminishing opportunity costs**: A potential Fed rate cut would lower real yields (nominal rate - inflation). If 10-year Treasury real yields fall from 2.3% to 1.5%, the opportunity cost of holding gold/Bitcoin declines, pushing funds from bonds into risk assets.
(3) Regulatory Gate Opening: Chinese Brokerage Breaks New Ground
- **Guotai Junan International's milestone**: On June 24, Hong Kong's SFC approved its virtual asset trading services, making it the first Chinese-funded brokerage to gain such. This opens a "compliant channel" for mainland capital—post-announcement, its HK shares surged 101%, while OTC Bitcoin inventory dropped by 3,000 coins, indicating institutions are front-running liquidity inflows.
- **Financial infrastructure upgrade**: The service allows clients to trade BTC via traditional securities accounts, lowering entry barriers. Analogous to Chinese brokerages accessing gold ETFs in 2013, such channels typically trigger explosive incremental flows, expected to attract $1-2 billion from family offices initially.
(4) Technical "Golden Cross" Confirms Long-Term Trend
- **Key moving average resonance**: BTC recently completed a 50-day MA (102,300 USD) cross above 200-day MA (94,700 USD), forming a "golden cross". Backtesting 2019 and 2020 instances, this pattern preceded 58% average 6-month gains, though short-term pullbacks (10-15%) are common (e.g., June 2023 post-cross correction).
- **Strong support forming a safety net**: The 200-day MA now acts as dynamic support—pullbacks to ~95,000 USD would represent a "secondary buying opportunity at institutional cost bases", similar to housing prices finding support when breaking below moving averages.
Today's BTC trading strategy, I hope it will be helpful to you
BTCUSDT BUY@106000~107000
SL:105000
TP:108000~109000

Big move for BTC - liquidity sweep + order block retest scenarioPrice could sweep the highs (BSL 110670), then reject around 104700. If that happens, I’ll look for a retest of the OB at 995700 for a possible long.
If we break lower, deeper liquidity sits around 93350, with a strong OB between 92900–91700, that’s my last line for a high-probability reversal.

BTC - 103.5 - 102k when?OKay so the move as marked did move but is choppy, owing to the new pattern, lets see if triple tops are made and is done in a manner where it falls, LIQ shows at 108,800, BTC genuinely looks very very tired!


BTC | At the Line Between ATH Expansion or Macro FlushBINANCE:BTCUSDT Bulls need to hold the $102k–$100.8k support and 1D 50MA for a shot at new highs.
– Wick into 1D FVG ($98k) is fine, but no daily close below 50MA allowed.
– Lose $100k? Then it’s sideline season — next real support only at $93k/$87k, macro flush risk toward $75k–$58k if momentum fails.
– As long as above 1D support/MA, there’s a chance for a clean ATH breakout from the OB under the highs.
This is the zone to bet on continuation. If not, don’t fight the trend lower.

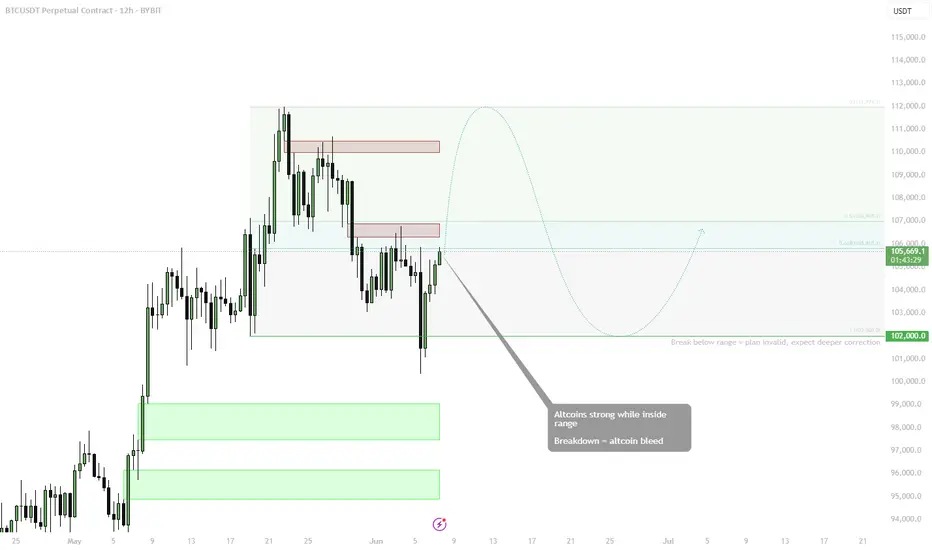
BTC — Altcoin Sentiment Hinges on BTC Holding BINANCE:BTCUSDT is consolidating within a well-defined range between ~$102K and ~$112K, with a bounce off the lower boundary now challenging midrange resistance. As long as BTC trades within the range, altcoins are expected to remain strong.
🟩 Midrange: $106K
• 0.618 fib and prior supply zone
• Key inflection for either a move higher or return to range low
🔻 Range Low Support: $102K
• Break below this = plan invalid
• Expect deeper BTC correction and altcoin bleed in that scenario
📈 Bias:
• Altcoins strong = only valid if BTC holds this structure
• Rotations likely while BTC moves sideways or grinds higher
• Upside target (range high): ~$111.9K
📌 BTC stability = altcoin opportunity. Breakdown from range? Get defensive fast.