BTC/USDT, 4H chart, Futures - Bullish projection.The price is expected to consume time in its SQZ and take liquidity at the bottom of the range to make decisions... to UP
BTCUSDT.5L trade ideas

BTC - Its Constipated!This is BTC 4H SVP
Birds eye view says its just negating all moves, neither down or tops,
In simple words: right now BTC is stuck in a tight box. If it breaks down, we may see a fast drop to $106,000. If it breaks above $107,600, it may go higher. Until then, avoid entering blindly and wait for one side to win.
Chances are way higher for it to move up! Hoping to make EQH and a small fall.

BTC next bull runBTC is expected to undergo a short-term retracement before reigniting its bullish momentum and advancing toward new highs

BitSupport and resistance levels are identified on the one-hour timeframe, and the momentum increases in either direction when broken.

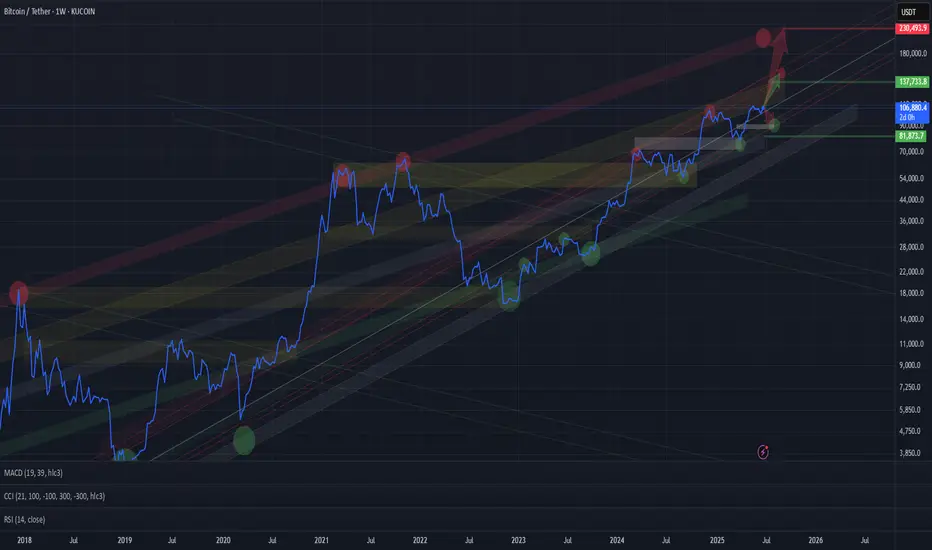
BTC BTC/USDT LONG_TERMChannels are drawn, long-term targets are clear. The upper extreme visible so far is around $200K for Bitcoin — possible within this cycle.
More realistic targets for this cycle are around $135K.
In the short term, a correction to the lower red channel zone ($88K–94K) is possible.
Watching closely.
BTC - A New Oregon Trail or Fool's Gold?The ranch hand (chart) reckons Bitcoin hit a big wave‑3 peak, then swung into a corrective wave‑4 saddle.
Now it's circling the watering hole, teetering around a key resistance near $110k—the cowboy‑critical line in the sand.
If that line holds strong, expect another surge—an “inverse wave‑4, strong 5” push higher toward $115–120k.
But if it buckles, a darker scenario’s afoot: a red‑inked, five‑wave drop galloping down toward $85k.
Bottom line: keep your hat on—$110k is the frontier. Break above that, and the herd’s heading north; if not, saddle up for a ride downhill.
BYBIT:BTCUSDT.P
BITSTAMP:BTCUSD

Bitcoin Bullish But... Support Zones (Incl. Altcoins)Bitcoin is bullish right now but we know things can change. As long as the action is happening within the blue and gray space, all is good, the bullish bias remains intact. If the action moves below the gray zone and enters the orange zone, this is the danger zone. This danger zone can turn into a buy opportunity or a wait and see approach.
On the other hand, if Bitcoin remains above the blue zone this is ultra-bullish short-term. This is specially bullish for the altcoins but it is bullish for Bitcoin as it reveals consolidation at high prices, but right now we have a lower high so anything goes.
The chart is mixed when looked at up-close. Bullish long-term and on all bigger timeframes. Corrections tend to develop from high prices.
One more thing to consider
When we look at the action short-term we can miss the bigger picture, we can become clouded with noise. The bigger range is $100,000 - $110,000, this is the new long-term support zone that is being established and created before additional growth. Bitcoin can remain here for weeks or even months, if this happens, the altcoins will continue to grow.
We are in a bull market. Bitcoin is obviously in a bull market as it is trading near its all-time high after years of growth. The altcoins are just getting started after years of sideways action... Some altcoins hit new all-time lows but still part of a broad, long-term consolidation phase. Many produced higher lows, some produced lower lows, it makes no difference.
The bear market ended in mid/late 2022 and the ensuing two years we had mix growth. Bullish waves and bearish waves, with the usual variations of course.
The year is now 2025 and Bitcoin is up, most of the big projects have been growing for years now and we are getting close to the final advance, the major fifth wave and the bull market bull run. When this happens, close to its end, all the smaller projects will produce the biggest growth in their history and this will be the boom that will catapult Crypto to take over the financial world.
It won't be the first time this event happens nor the last, the market will continue to fluctuate.
I know there is a lot of information out there and we can become uncertain with every drop, but look at the price; what do you see? Bitcoin is going up.
The altcoins are set to follow, the altcoins do what Bitcoin does.
Namaste.

Bitcoin, The Next High Is The All-Time HighThe title might be a bit misleading but, the truth is that Bitcoin stays bullish short-term and this is bullish on all terms...
Good afternoon my fellow Cryptocurrency trader, how are you feeling today?
Any day, any week, any moment; every month, place or year, the market provides everything we need to know. This information is made available to us through the chart.
Bullish Bitcoin
The present signal is the fact that Bitcoin remains very high, challenging resistance, after a strong recovery and advance. This is happening with the altcoins also.
If you look at the last two peaks, as soon as resistance was hit there was an immediate crash. The next day was full red; very strong bearish action and momentum and this led to a new low. The situation is not the same today.
22-May peak. 23-May, strong bearish action.
9-June peak. 11-June, strong bearish action.
26-June lower high (not a peak). Today, neutral action. This neutral action is what I am taking as a bullish signal. Many other factors of course support this conclusion yet, this is still an early signal.
Fib support
A closer view of the daily timeframe:
4H. The grey line represents Fib. retracement. Dark blue—Fib. extension:
Conclusion
Each time there is a price peak a retrace follows, if there is no retrace then you are not witnessing a peak but rather a stop, a pause; resistance being met.
It seems that the current lower high is not the end but rather just a pause before additional growth. Market conditions can change.
It can happen that several days Bitcoin goes sideways with the bulls failing to garner enough strength. In this scenario, there would be a move lower before additional growth.
The present scenario shows a bullish chart even if prices drop, remember, the market is in no hurry.
Easy money
In September we will have lower interest rates and this is a bullish development for Bitcoin. Advanced money minds see easy money as inflationary for the currency, while Bitcoin is inflation-proof. So the dollar goes down and Bitcoin goes up.
I didn't quite develop this point, next time I'll do a better job.
Summary
The market is good even if it shakes. The market is good and isn't shaking, the recovery is already in place.
Bitcoin's price is very strong and there are many layers of support. The altcoins are in a similar situation, growing from the bottom up.
The Fed will reduce interest rates in September and then once more before the year ends, this is bullish for everything so, everything will be going up, at least everything that we are interested in, support and trade.
Thanks a lot for your continued support.
Never give up!
You are divine! You are blessed.
If you are reading this now, you will be blessed for your great timing. Hard work and dedication always pays.
Keep moving forward, keep pushing forward, never give up.
When life hits you hard, do take a break if you need it, only to comeback with new energy, a new mind and an infinite drive to achieve your goals.
You are the reason why Bitcoin exist... You are the lifeblood of the market.
Without you, nothing is possible. It is because of you that we all continue to grow.
Thanks again for taking the time to read.
I appreciate your support.
Namaste.

Sharing the advanced Bollinger Bands strategyHere are the Bollinger Band trading tips: *
📌 If you break above the upper band and then drop back down through it, confirm a short signal!
📌 If you drop below the lower band and then move back up through it, confirm a long signal!
📌 If you continue to drop below the middle band, add to your short position; if you break above the middle band, add to your long position!
Pretty straightforward, right? This means you won’t be waiting for the middle band to signal before acting; you’ll be ahead of the game, capturing market turning points!
Let’s break it down with some examples:
1. When Bitcoin breaks above the upper Bollinger Band, it looks strong, but quickly drops back below:
➡️ That’s a “bull trap”—time to go short!
2. If Bitcoin crashes below the lower band and then pops back up:
➡️ Bears are running out of steam—time to go long and grab that rebound!
3. If the price keeps moving above the middle band:
➡️ Add to your long or short positions to ride the trend without being greedy or hesitant.
Why is this method powerful?
It combines “edge recognition + trend confirmation” for double protection:
1. Edge Recognition—spot the turning point and act early.
2. Trend Confirmation—wait for the middle band breakout and then confidently add positions!
You won’t be reacting after the fact; you’ll be ahead of the curve, increasing your positions in the trend’s middle and locking in profits at the end. This is the rhythm of professional traders and the core logic of systematic profits!
Who is this method for?
- You want precise entry and exit points.
- You’re tired of “chasing highs and cutting losses.”
- You want a clear, executable trading system.
- You want to go from “I see the chart but don’t act” to “I see the signal and take action.”
Follow for more. Make sure to like this if you found it useful.

Bitcoin ready for new ALL TIME HIGHS.I think a breakout from this region is closer than people think.
Break of structure to the upside on the daily already occured . Order block is holding nice . A fvg has formed and a retest could occur , around 103.4k- 104.5k.
Overall the chart is bullish.
Next week we might see new All Time Highs.

Are we out of the woods? BTC has been trading above the golden pocket for three consecutive days. This should give us a technical target of at least 110k, where the next major resistance lies.

BTC next boom beginning I'm going to see boom in btc
Here’s the analysis of Bitcoin’s (BTC) next expected move in English, based on current market conditions and technical indicators:
---
### **1. Short-Term Outlook (Next 24-48 Hours)**
- Bitcoin is currently trading around **$107,400**, with **$108,000-$109,000** acting as a strong resistance zone.
- If BTC breaks above **$109,870** and closes above it, the next target could be **$114,950**.
- If the price fails to break resistance, a pullback to **$105,300** or **$103,900** (support levels) is possible.
- The **30-minute RSI is at 52.22** (neutral-bullish), and the MACD histogram is in positive territory.
---
### **2. Medium-Term Outlook (1 Week to 1 Month)**
- **Coincodex predicts**:
- **$116,914** (+8.98%) by July 2025.
- **$136,858** in the next 3 months.
- **DigitalCoinPrice forecasts**:
- Average price of **$221,961** by late 2025, with a potential high of **$235,354**.
---
### **3. Key Technical Indicators**
- **4-Hour Chart**:
- BTC is testing the **upper Bollinger Band ($108,672)**. A breakout could target **$114,956**.
- **Support Levels**:
- Immediate support: **$105,358** (EMA 100).
- Strong support: **$103,996**.
---
### **4. Market Sentiment**
- The **Fear & Greed Index** is currently at **74 (Greed)**, indicating bullish sentiment but also potential overbought conditions.
- **Volume**: Stable buying volume suggests sustained interest, but a drop could signal consolidation.
---
### **5. Potential Scenarios**
- **Bullish Case**: Break above **$109,870** → Rally toward **$114,950-$116,000**.
- **Bearish Case**: Rejection at resistance → Drop to **$105,300-$103,900**.

BTC - LONG SET-UPBINANCE:BTCUSDT
Bitcoin is currently testing its critical resistance level
If the price gets rejected here, the key support to watch is the $𝟏𝟎𝟏,𝟐𝟎𝟎 - $𝟏𝟎𝟐,𝟖𝟎𝟎 zone. This area represents a strong demand level where a potential buying opportunity could emerge.
For a trade setup based on this support, a strategic Stop Loss (SL) should be placed below the $𝟗𝟖,𝟎𝟎𝟎 mark to manage risk.
For now, patience is crucial. Keep a close eye on the price action

BTC/USDT.P – Intraday Plan (15m, Ichimoku) by RiscoraPrevious idea played out. The last candle showed strong volume and a wick to the upside, signaling some liquidity has been taken.
From here, I expect either a minor high above that wick or a correction down to the 0.618 area, then continuation of the bullish move towards the yellow liquidity block.
If price breaks below recent lows, the 106,300 level has proven itself as solid support—buyers have stepped in there twice with strong volume, so I’m not expecting it to give way easily.
Overall, I anticipate another push up to collect liquidity above and will reassess once price reaches the upper range.
Watching price action closely for confirmation.
#BTC #Crypto #Trading #Ichimoku #Riscora

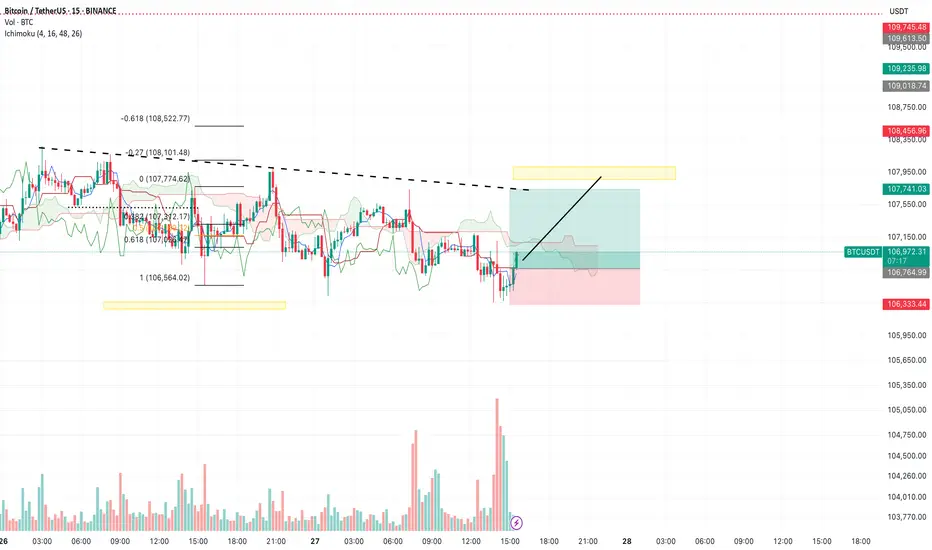
BTC/USDT – Intraday Plan (15m, Ichimoku) by RiscoraToday’s idea:
We’ve seen strong volume at the current support zone. My expectation is for a move upward towards the yellow block at 107,900, targeting liquidity that has accumulated above the dotted trendline.
This is my main scenario for today: a range-bound session with a liquidity sweep to the upside. Watching for reaction as price approaches the yellow zone.
#BTC #Crypto #Trading #Ichimoku #Riscora
BITCOIN - SHORT OPPORTUNITY AND LACK OF MOMENTUMBINANCE:BTCUSDT has been lacking momentum in the last few days. It looks to me that "Good News" is almost "No News" in regards to the Iran war or any crypto legislation. Summer is looking a lot like sideways movement, and due to the previous explosion in momentum and volume, I think the lack of it will bring the price down in the following days or weeks.

BTCUSDT 1D📈 #BTC Plan for July – Bullish Setup in Play
Bitcoin is forming a bull flag pattern on the daily chart — a classic setup that often leads to strong upward continuation when confirmed.
🔹 Key Indicators
• MACD is building positive momentum
• RSI is holding above 50
• Price is trading above the MA50 and the Ichimoku Cloud, indicating strong underlying support
📍 Strategy
We're buying here and will consider adding more near the key support zone:
$98,200 – $99,613
📈 Potential breakout targets (on confirmation):
🎯 $112,471
🎯 $116,880
🎯 $121,288
⚠️ Reminder
Always use a tight stop-loss and apply proper risk management.
Breakout confirmation with volume is crucial.

Waiting for the Liquidity Flush – Will We Get That Drop or a StoCurrently holding a short position and have been waiting for a decent liquidity flush towards my TP zone for almost a day now. The thing that bothers me is how slow the price action is—it's grinding lower, but at the same time, building up a new liquidity shelf just above my entry.
This makes me concerned that we might see a quick liquidity sweep to the upside (taking out stops, possibly including mine) before any real move down happens. The area around my TP is loaded with liquidity, but the market seems hesitant to make that push.
What’s your opinion—are we likely to get that clean drop soon, or should we brace for a fake-out and stop hunt first?

BTC 1W ideaLooks like Bitcoin is in the middle of the distribution which targets at $160k. Flag pattern.

HolderStat┆BTCUSD aiming for 112kBINANCE:BTCUSDT is forming a bullish continuation structure after bouncing from the mid-range. With support holding and consolidation patterns completing, price action suggests a rally toward the 115,000 resistance line. Triangle and consolidation behavior confirms a strong uptrend continuation setup.

#BTC/UST#BTC
The price is moving within a descending channel on the 1-hour frame, adhering well to it, and is on its way to breaking it strongly upwards and retesting it.
We are seeing a rebound from the lower boundary of the descending channel, which is support at 106,000.
We have a downtrend on the RSI indicator that is about to break and retest, supporting the upward trend.
We are looking for stability above the 100 moving average.
Entry price: 106,600
First target: 106,750
Second target: 107,000
Third target: 107,291

Bitcoin Controlled consolidation above 106,480 Technical Overview – Summary Points
➤ BTC trades in the 1st quartile of its yearly range (100k – 111k).
➤ Stacked resistance zone: 108,239 to 110,603 USDT → potential seller exhaustion.
➤ Key support at 106,480; defensive cluster 102,626–99,581.
➤ Risk On / Risk Off Indicator = Strong Buy; ISPD Divergence = Neutral.
➤ Normal volume, but lack of fresh capital → sustainability of rally questionable.
__________________________________________________________________________________
Strategic Summary
➤ HTF trend bullish above 106,480; breakout > 108,239 targets 109,950 / 110,600.
➤ Buy swing pullbacks on 106,480 or 104,600. Invalidation < 102,626 = drop to 99k.
➤ Tactical short scalps around 108,250–109,000.
➤ Core PCE = major catalyst (June 27).
➤ Watch spot volumes, funding, and Risk On / Risk Off signals.
__________________________________________________________________________________
Multi-Timeframe Analysis
➤ 1D : bullish bias > 106,480; danger < 102,626.
➤ 12H : bullish consolidation; confirmed breakout > 108,239.
➤ 6H : compression; buy dips 106,480 / 104,600.
➤ 4H : lateral-bullish; key support = 104,600.
➤ 2H : neutral-bullish; triggers = 107,800 / 106,000.
➤ 1H : bull flag; micro-divergence, prefer long > 106,950.
➤ 30 min : tight triangle; breakout at 107,200 / 106,650 = signal.
➤ 15 min : bearish < 106,950, expected bounce on 106,480.
__________________________________________________________________________________
Macro, News & On-Chain Analysis
➤ Macro backdrop: “Higher for longer” stance continues, no FOMC imminent.
➤ Core PCE June 27: upside surprise (2.7% YoY vs 2.6% expected) – USD supported, potential headwind for risk assets.
➤ Pacific Region: ongoing tensions in Taiwan Strait and South China Sea:
- Increased military activity: air incursions, naval maneuvers.
- High risk of escalation flagged by defense analysts & social feeds.
- Risk sentiment: volatile – sudden events could trigger risk-off.
➤ On-chain: Range 100–110k; weak spot volume; cautious leverage; no major sell-side imbalance.
__________________________________________________________________________________
Conclusion
➤ BTC maintains a controlled bullish bias > 106,480.
➤ Swing buy zones = 106,480 & 104,600; targets 109,950 / 110,600.
➤ Main risk: break < 102,626 = sell-off toward 99k.
➤ Monitor Core PCE and geopolitical risk in the Pacific region.
__________________________________________________________________________________

Why BTC hasn’t moved up recentlyBTC has been bobbing above and below this bearish triple crossover the past few months. What we see as consolidation is rather price getting stuck around these resistance levels.
The only reason why this would be occurring in my view, is due to the market makers having intention to allow this drop to play out.
The resistance is located at around 107,000 to 107,400 - watch this zone closely for a hold below / rejection and fast drop.
Scenario 1 marked with solid red line.
Scenario 2 marked with dotted red line.
Little update for y’all. Happy weekend trading.
