BTC/USDT Long PositionAfter a strong bullish impulse, price pulled back and formed a clear demand zone (OB) near the origin of the move.
The market is now retesting this zone after breaking short-term structure to the upside.
Entry:
Long from demand zone (OB) at the base of the bullish impulse.
Confluences:
✔️ Clean bullish BOS (Break of Structure)
✔️ Strong rejection wick from demand
✔️ Lower time frame liquidity grab
✔️ Favorable R:R setup
SL: Below the OB
TP: Targeting previous supply zone above
Bias: Bullish until structure shifts again
FOLLOW ME FOR MORE SIGNAL
BTCUSDT.5L trade ideas

BTC/USDT Analysis (15m) – Short Position Setup📌 BTC/USDT Analysis (15m) – Short Position Setup
🔍 After a sharp rally, the market started a corrective phase and formed a bearish structure with lower highs.
A sell limit order is placed at the 110063 supply zone, targeting potential continuation to the downside.
🎯 Target: 108578
⛔️ Stop Loss: 110557
⚠️ Risk/Reward: Favorable and aligned with current market structure.

Bitcoin (BTC) Technical Analysis and Trading Strategy
Daily Level
Price Structure: Last week, it fell to 100,000 points and did not break the support. Then it returned to the horizontal adjustment range, but it was still suppressed by the downward trend line above, and the overall high-level decline structure was maintained.
K-line pattern: The two consecutive days of closing cross stars showed that the long-short game intensified, but there was no clear direction.
Momentum indicator: RSI continued to shrink, indicating that short-term momentum weakened, and attention should be paid to breakthrough signals.
4-hour level
Key resistance: 106,700 (horizontal channel top + downward trend line bonding pressure), breaking through is expected to test the 110,000 mark.
Key support: 103,500 (range bottom), 101,000 (strong support), if it falls below, it may form a head and shoulders top structure, and further look down to 97,600 (previous step support).
Short-term trading strategy
Short order opportunity
Entry area: 106,000-106,700
Stop loss: 108,000 (short order invalidated after trend line breakthrough)
Target: 103,500 → 101,000
Long order observation point
If the price stabilizes above 106,700, you can wait for confirmation of the retracement before arranging long orders, with a target of 110,000.
If it stabilizes at 101,000-103,500, you can consider short-term rebound trading.
Key trend judgment
Break above 106,700 → Continue to adjust upward and test 110,000.
Break below 103,500 → Confirm the head and shoulders top, target 97,600.
Range oscillation (103,500-106,700) → Wait for a breakthrough signal.
(Risk warning: Pay attention to changes in market liquidity and the impact of macro data, and strictly stop loss.)

BTC's trading strategy for todayBTC has continued its upward trend as analyzed. It tested the resistance area above 110,000 today and began to decline. A small - scale decline is expected within the day, and short - term trading can try shorting.
BTC's trading strategy for today:
BTCUSDT sell@110000-111000
tp:108000-107000

Bitcoin Pre-CPI PlanJust like in trading it’s all about structure, levels and reaction.
We’ve seen BTC bounce cleanly from the psychological level of $100,299 and rally all the way to $110,667.
Based on that impulse move, I’m watching the 0.618 Fibonacci retracement at $106,586 as a potential dip-buy zone. That level aligns perfectly with:
✅ 4H Fair Value Gap
✅ Previous Week High
If we get a healthy CPI print today, I expect BTC to continue the bullish move and go for a new ATH.
🎯 First target: $112,345 (slightly above Previous Month High)
📉 Then, a potential pullback to $110,667 (support retest)
🚀 Followed by a breakout move to $117,604 the 1.618 Fib extension
All eyes on today’s CPI. If the data is good, the sky’s the limit.
Let’s see if bulls have the strength to push it all the way. 💪📈

Bitcoin Breaks Out: Bullish Momentum Builds Above Key LevelsHello guys!
The chart of Bitcoin reveals a significant bullish breakout, characterized by two key technical developments:
Broken Ascending Channel:
Bitcoin was trading within an ascending parallel channel, gradually making higher highs and higher lows. This channel was recently breached to the downside, suggesting a temporary weakening in momentum.
False Breakdown and Strong Reversal:
Despite the initial breakdown from the channel, Bitcoin swiftly reversed and surged upwards, reclaiming previous support levels with strong bullish candles. This “fake-out” move often traps bears and reinforces bullish sentiment.
Trendline Breakout:
More notably, BTC has broken above a descending trendline, which had acted as a resistance zone. This breakout, backed by strong volume and momentum, indicates a shift in market structure from consolidation to potential expansion.
Projected Upside Target:
Based on the breakout projection drawn on the chart, the next major resistance appears near the $109,600 level. This aligns with the upper purple dashed line, which may represent a historical resistance zone or a Fibonacci extension.

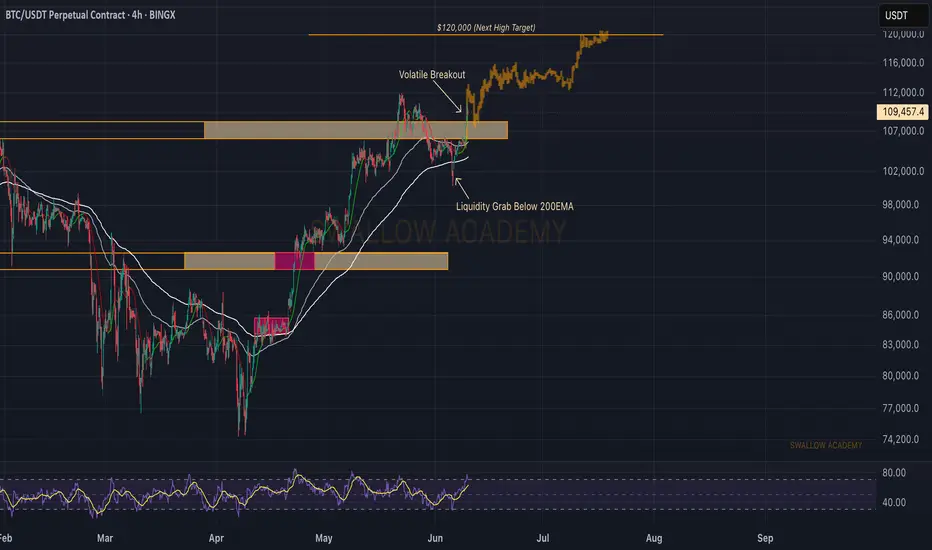
Bitcoin (BTC): Heading Towards The All Time Hight Bitcoin is still pushing into the second day of the week, where the price is heading towards the ATH area for a retest and potential breakout (which we have been looking for). Now if we keep that same momentum, we are guaranteed to retest the ATH area, where high volatility can be expected!
Swallow Academy
Lingrid | BTCUSDT support Bounce After Flag Pattern BreakoutBINANCE:BTCUSDT recently rebounded from the intersection of the upward channel and horizontal support near 103,705 after a false breakdown from the flag pattern. The price is now challenging the downward trendline from above, hinting at a potential breakout. A sustained move above this zone may open the path toward the 108,800 resistance.
📈 Key Levels
Buy zone: 103,500–104,000
Buy trigger: breakout and close above 105,600
Target: 108,800
Sell trigger: close below 103,000
💡 Risks
Rejection from the downward trendline could revive bearish pressure
Sideways consolidation under resistance weakens momentum
A break below the channel base may invalidate the bullish setup
Traders, if you liked this idea or if you have your own opinion about it, write in the comments. I will be glad 👩💻

BTCUSD Long-Term Buy Recommendation📌 BTCUSD Long-Term Buy Recommendation
🚨 BTCUSD Buy Recommendation – Magnet Area Identified
Here is the Magnet Area for a potential buy zone on BTCUSD, marked clearly with the green line on the chart.
This area has been technically identified as a strategic accumulation zone for long-term investment.
It is crucial to consider partial buying in this zone using a portion of your capital allocated for long-term crypto exposure.
🟩 Green Line = Suggested Buy Area
💰 Strategy: Gradual accumulation, not all-in
⏳ Timeframe: Long-term holding (2–5 years)
🎯 Objective: Build position during discounted price range
Patience and risk management are key. Long-term opportunities often begin where fear dominates.
⚠️ Disclaimer:
This content is for educational purposes only and does not constitute financial advice. Always do your own research and consider your risk tolerance before making any investment decisions. You are solely responsible for any trading or investment actions taken based on this information.


Correction? Show Me the Correction —Bitcoin Is Going Up!There is no correction and this "double-top" is nothing similar to 2021.
First, the wave that led to the April 2021 ath was a major hyper bullish wave starting March 2020. A total of 392 days of bullish action non-stop with 1,615% total growth. From a low of $3,782 to a high of $64,854, Boom!
The wave that led to the January 2025 all-time high was not a mega hyper, hyper-bullish bullish wave, instead it came after a long period of consolidation and a flash crash, which means the establishment of a long-term support. It started August 2024 and lasted 168 days total growth 124%. Completely different, so don't tell me that market conditions are the same because they aren't, we are not stupid, actually, we are very smart, right my friends? Long-term followers, readers and supporters!
The first high in 2021 happened in April the second in November, 210 days apart.
In 2025, we have a top in January and another one in May, 119 days. Very, very different.
In 2021 the altcoins rallied, everything rallied and everything was trading at new all-time highs before the bear market.
In 2025, nothing has rallied and most of the market was trading at the bottom. So we had an early peak in 2021, we get a late peak in 2025.
Since we had a long-term double top in 2021, we get a blow-off top in 2025, late 2025. Do you understand?
I am the Master of the charts!
Bitcoin is not done; it isn't over. We have an entire bullish wave before the bull market is over. This bullish wave is the fifth wave which is the speculative wave, in this wave anything goes. The market will go crazy. There will be euphoria, passion, craziness, money, growth!
The altcoins will be hitting new all-time highs and everybody will go crazy. NFTs, DeFi, DePin, RWA, Memes, POW, Gaming, AI, new, big, small and old, all welcomed, everything will grow. When the pixelated rocks start selling for millions of dollars, that's when the bull market ends.
When people start saying "Bitcoin will go to $1,000,000 in this cycle." That's when the top is in.
When Bitcoin starts trading at $219,999 and starts to slow down and Ark Invest comes up and says, "Bitcoin is going to $5,000,000 next"; when Michael Saylor starts saying, "I will be buying the top forever..." Get ready because that's the end. It isn't happening, now people are still talking about corrections and doubt, that's not the end of a bull market, that's the transition period between an advance a correction and the next leg up.
Just wait and watch. Just watch my friend... Just watch!
I assure you, Bitcoin is going up!
Namaste.

Support and resistance zone: 104463.74-106133.74
Hello traders.
If you "Follow", you can always get new information quickly.
Have a nice day today.
-------------------------------------
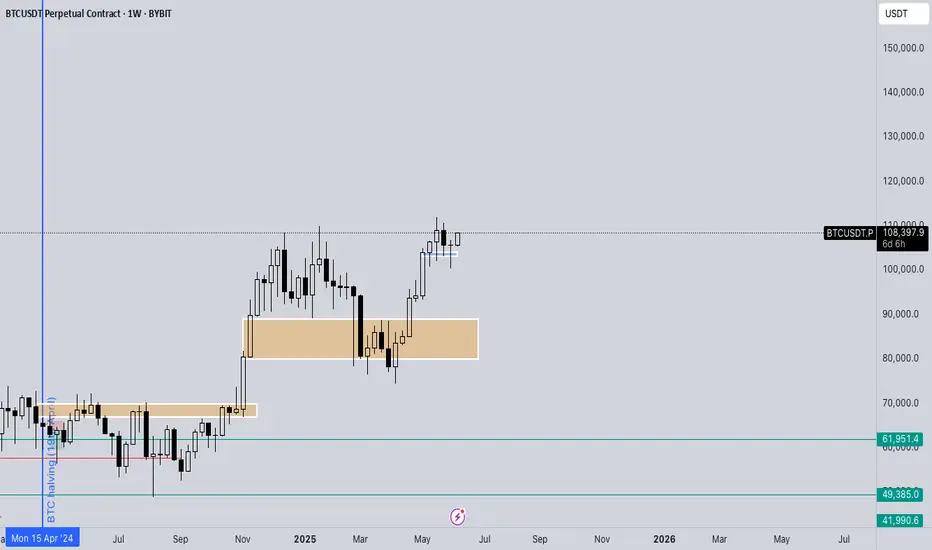
(BTCUSDT 1W chart)
When a new candle is created, you should check if the HA-High indicator is created at the 99705.62 point.
The reason is that the HA-High indicator was created, which means that it has fallen from the high point range.
In other words, it also means that it can fall to around or below the 97705.62 point.
Since the current candle fell to around 99705.62 and then rose, it can rise like this when a new candle is created.
We have several indicators that can determine the high point.
Representative indicators include DOM (60), StochRSI 80, and HA-High.
Therefore, the high point range is 104463.99-104984.57 and 97705.62.
Therefore, in order to turn downward, it is likely to start when it falls below 104463.99-104984.57 and shows resistance, and it can be interpreted that the downtrend is confirmed when it falls below 97705.62.
If we think about it the other way around, if the price stays above 104463.99-104984.57, it will eventually create a new high.
-
When we first study charts, we start to become curious about charts as we learn about price moving averages.
As such, when we look at charts, our understanding of charts changes depending on how well we understand the average value.
However, when we first learn about price moving averages in chart analysis, we start to study all sorts of different analysis techniques as we realize that there are ambiguous parts in conducting transactions.
As a result, chart analysis becomes more and more difficult, and we end up giving up on chart analysis.
If you have studied chart analysis in your own way without giving up on it, you will realize that it will eventually converge to the average.
No matter what indicator or analysis technique you use, you will eventually converge to the average and then diverge.
Therefore, we should try to analyze the chart using the easiest and most convenient method.
The reason is that chart analysis is ultimately just a means to create a trading strategy and has no other meaning.
-
The basic trading strategy on my chart is to buy near the HA-Low indicator and sell near the HA-High indicator.
The HA-Low and HA-High indicators are indicators created for trading on the Heikin-Ashi chart and ultimately represent the average.
The HA-High indicator is the average value that represents the high point range, and the HA-Low indicator is the average value that represents the low point range.
Therefore, if it is supported and rises near the HA-Low indicator, it is a buying period, and if it is resisted and falls near the HA-High indicator, it is a selling period.
However, since it is an average, if it is supported and rises near the HA-High indicator, it is likely to show a stepwise upward trend, and if it is resisted and falls near the HA-Low indicator, it is likely to show a stepwise downward trend.
Because of this, we need to adopt a split trading method.
-
The auxiliary indicator, StochRSI, is an indicator that moves based on the 50 point.
Therefore, when the StochRSI indicator value is below 50, we need to focus on finding a buying point, and when it is above 50, we need to focus on finding a selling point.
A decisive hint for this is when it enters the overbought or oversold zone.
The auxiliary indicator, OBV, is an indicator that adds up the difference in trading volume according to price.
If you divide the OBV indicator into High Line and Low Line and understand the movement of OBV, you can understand the movement of the price to some extent.
However, since not all indicators follow the price trend exactly, you should not try to judge everything with just one indicator.
If you express the OBV indicator in the form of an oscillator, it will look similar to the MACD oscillator.
As I mentioned earlier, this is because the chart eventually converges to the average value.
Using this characteristic, we combined the OBV indicator with a MACD-type oscillator.
If it is located below 0 based on the 0 point, it means that the selling pressure is high, and if it is located above 0, it means that the buying pressure is high.
No matter what indicator or analysis technique you study, you must have a solid basic understanding of the average value.
If not, no matter how good the indicator or analysis technique you learn, you will not be able to analyze it as you studied and create a trading strategy when you actually trade.
-
(1D chart)
It is highly likely that the uptrend will resume if it rises above the HA-High indicator point of 108316.90.
To do so, it is important to see if it can receive support and rise around 104463.99-106133.74.
If it fails to rise, it will eventually show a downward trend again.
If it meets the HA-High indicator and falls, it is likely to fall until it meets the HA-Low indicator.
Currently, the HA-Low indicator is formed at the 89294.25 point, but as the price falls, the HA-Low indicator is likely to be newly created.
Therefore, we need to check if the HA-Low indicator is newly created when the price falls.
Since the OBV of the auxiliary indicator is located near the Low Line and the OBV oscillator is also located below the 0 point, we can see that the selling pressure is strong.
Therefore, we need to check whether the OBV rises above the High Line when it is supported near 104463.99-106133.74 or whether the OBV oscillator rises above the 0 point.
-
I think that all indicators or analysis techniques are ultimately tools that confirm whether there is support at the support and resistance points or sections drawn on the 1M, 1W, and 1D charts.
Therefore, in order to use indicators or analysis techniques, it depends on how well you understand and draw the support and resistance points or sections according to the arrangement of the candles.
Therefore, you need to first check how reliable the support and resistance points you drew are and practice creating a trading strategy accordingly.
Ultimately, it can be seen that how well the support and resistance points are drawn depends on how well the chart analysis or trading strategy is made.
-
If you look at the 1W chart and the 1D chart, you can see that the important volatility period is around June 22.
The volatility period of the 1W chart is from June 16 to 29.
The volatility period of the 1D chart is from June 10 to 14 and from June 21 to 23.
Therefore, when the HA-High indicator of the 1W chart is generated at the 99705.62 point, it is important to maintain the price above 99705.62 after passing the volatility period of the 1W chart.
Since the HA-High indicator on the 1D chart is formed at 108316.90, we need to see if it can be supported and rise near 108316.90.
In summary, we can see that the important support and resistance range in the volatility period is 99705.62-108316.90.
Among these ranges, it is expected that the wave will start depending on whether the current price is supported in the 104463.99-106133.74 range.
In other words, the 104463.99-106133.74 range corresponds to the middle range of the 99705.62-108316.90 range, the average value.
-
Thank you for reading to the end.
I hope you have a successful transaction.
--------------------------------------------------
- This is an explanation of the big picture.
(3-year bull market, 1-year bear market pattern)
I will explain more details when the bear market starts.
------------------------------------------------------

$BTC Bulls BackCRYPTOCAP:BTC is breaking out of a descending channel after a healthy pullback from the $ 112,000–$ 114,000 resistance zone.
Strong demand at $ 102,000–$ 104,000 supported the bounce, with buyers now pushing prices higher.
A clean breakout above $106K could open the path to retest $112K+.
The $102K–$104K zone remains key support as long as BTC holds above it, the short-term bias stays bullish.
DYRO, NFA

114k very soon Btc successfully completed wave4 , price can rise until 107k and after that micro wave 2 will correct price to 103k-104k , i dont open short position because BTC is very bullish, but i will wait for micro wave 2 . Good luck 👍

Hanzo / BTC 15 Min ( Accurate Tactical Bullish Retest )🔥 BTC – 15 Min Scalping Analysis (Bearish Setup)
⚡️ Objective: Precision Breakout Execution
Time Frame: 15-Minute Warfare
Entry Mode: Only after verified breakout — no emotion, no gamble.
👌Bullish After Retest : 107000
Price must break liquidity with high volume to confirm the move.
☄️ Hanzo Protocol: Dual-Direction Entry Intel
➕ Zone Activated: Strategic liquidity layer detected — mapped through refined supply/demand mechanics. Volatility now rising. This isn’t noise — this is bait for the untrained. We're not them.
🩸 Momentum Signature Detected:
Displacement candle confirms directional intent — AI pattern scan active.
— If upward: Bullish momentum burst.
— If downward: Aggressive bearish rejection.
🦸♂️ Tactical Note:
The kill shot only comes after the trap is exposed and volume betrays their position.

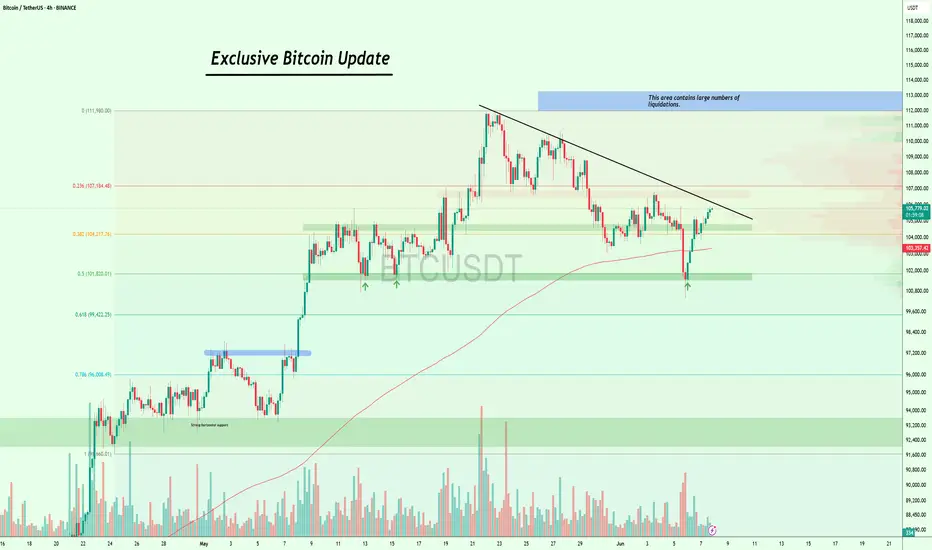
No Change in Plan! $BTC Targeting Major Liquidation ZoneAs I warned you guys, CRYPTOCAP:BTC came down to the $100K exactly as expected, and then we bounced from the $100K level!
That lower trendline once again acted as strong support, just as expected.
Now #Bitcoin is pushing back up toward the major trendline and eyeing the $107K–$112K zone, which holds large liquidations.
No changes in the game plan, watching the daily and weekly closes closely.
If Bitcoin breaks above this trendline clearly, we could see a strong move up. 🚀
I’ll keep you posted as things unfold. If you find my updates helpful, don’t forget to like and follow for more!
Bitcoin Short-Term Setup: Divergence and Correction SignalsBitcoin Analysis | 1-Hour Timeframe
Currently, Bitcoin is positioned at a key support level around $108,380, which can act as an important support zone.
Due to the presence of divergence and overbought conditions on the 1-hour and 15-minute timeframes near $108,000, a price correction down to $104,400 (which coincides with the 50% Fibonacci retracement of the recent move) is expected.
If the price manages to break above the resistance at $108,380, we anticipate a bullish move towards the $109,500 level.
Conversely, a breakdown below the $108,380 support could lead to a deeper correction, potentially down to $105,000.
Good luck.
Risk management and sticking to your strategy are key to success in this volatile market.

Monday trade update!💭 In today’s class, we covered:
🧠 Trading Psychology – mastering mindset and emotional control
🔭 Long-Term Outlook on BTC – big picture perspectives
📅 This Week’s Trade Setups – potential plays and key levels to watch
👀 I’m currently eyeing a 4H continuation higher low setup – mainly focused on BTC for now, but let’s see how the market unfolds this week.

BTC - Ranges overview Let's have a look at BTC as we start this new week.
From a weekly perspective you can see how we through around the weekly gap (blue box)and respected it.
On the LTF we broke below it and failed to close below it.
From here expect us to aggressively trade back towards 110K and eventually new ATH.
IF we fail to hold the current sellside, we will revisit the weekly gap (blue box) and 105K.
As always WAIT FOR THE MARKET TO SHOW YOU ITS HAND AND TRADE WITH IT.
Stay safe and never risk more than 1-5% of your capital per trade. The following analysis is merely a price action based analysis and does not constitute financial advice in any form.
BTC - SetupWe’ve just broken through the major bearish trend reversal zone.
If momentum holds — and I believe it will —
we’re likely about to see the next BTC rally,
which means altcoins will follow.
But now is not the time to enter.
Anyone who hasn’t positioned long after all the entry setups we had is just fucked and missed it...
Right now, it’s time to wait and to do nothing.
We’ll see what the future will bring.
This is also the moment to lock in and stick to your plan — no matter what.
Euphoria is coming, and those without fixed rules
are going to get absolutely wrecked.
LFG.
Send it higher. 🚀

Bitcoin - Showing strength as it breaks key resistance levels!Bitcoin (BTC) recently demonstrated impressive strength by bouncing off a well-known confluence zone consisting of the golden pocket and a 4-hour fair value gap (FVG) around the $100,000 level. This technical area has historically acted as a reliable support and once again proved its significance, offering a solid foundation for the current rally.
Following this bounce, BTC surged to $108,000, decisively breaking above the 4-hour FVG near $107,000. With this breakout, the previously resistant zone is now expected to flip into support, adding further confidence to the bullish outlook. This type of price action is often seen in strong uptrends, where key resistance levels are reclaimed and converted into support, providing a base for further upside.
Importantly, BTC has also managed to push through the golden pocket resistance, a critical Fibonacci retracement area closely watched by traders. This breakout, in conjunction with the 4H FVG clearance, clears the path for a potential continuation toward Bitcoin’s all-time high.
Momentum is clearly building. Buying pressure is strong, and retracements have been shallow, indicating a market dominated by demand. While this is a bullish sign, a brief pullback or bounce off the newly formed support (the 4H FVG zone) would be healthy. Such a move would allow BTC to consolidate and build strength before potentially pushing toward new highs.
Overall, the technical landscape looks increasingly favorable for BTC. As long as it holds above the reclaimed support zones, the path to retesting, and possibly surpassing, the all-time high appears wide open.
Thanks for your support.
- Make sure to follow me so you don't miss out on the next analysis!
- Drop a like and leave a comment!

Possible Bitcoin price movement in the upcoming cyclePerhaps to attack the ceiling of the ascending channel, it would be better to collect the remaining liquidity in the 89,000 area, then move strongly towards 35,000.

