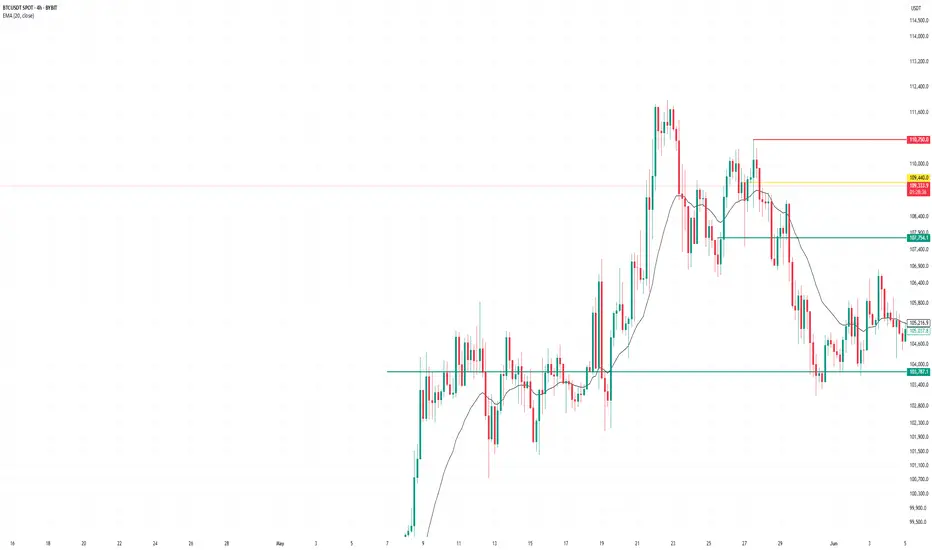
BTCUSD – Strong Bullish Signals on Daily ChartBTCUSD – Strong Bullish Signals on Daily Chart
Bitcoin is building strong bullish momentum after holding key support near $100,000 and breaking above the critical resistance zone at $105,000–$106,000. This move confirms renewed buying interest and opens the door for further upside.
The daily MACD is on the verge of a bullish crossover, signaling strengthening upward momentum.
The RSI has climbed above 55, moving out of neutral territory and showing buyer dominance.
Price action is approaching the upper boundary of a rising channel, with resistance near $110,000 to watch closely.
Volume has increased on recent up days, supporting the breakout strength.
Key Levels:
Support: $106,000 and $100,000
Resistance: $110,000 and $112,500
A daily close above $107,500 with volume confirmation would solidify the bullish case and could target a move toward $112,500.
What to expect after breaking $112,500:
Breaking and holding above $112,500 would open the path toward the next major resistance near $118,000–$120,000.
This breakout could trigger a strong rally fueled by momentum traders and institutional buying.
Watch for increased volatility as Bitcoin approaches all-time highs, with potential pullbacks serving as entry opportunities.
Sustained volume above breakout levels will be critical to confirm strength beyond $112,500.
If Bitcoin fails to hold above $112,500, it may retest support near $106,000–$108,000 for consolidation.
Short-term outlook: Expect consolidation between $106,000 and $110,000 before the next leg higher. Keep an eye on volume and momentum indicators for confirmation.
BTCUSDT.5L trade ideas

BITCOIN SHORT TERM UPDATE!!! Recently we have seen a great price move from 100K to 110K. We got clear Change Of Character , which indicates a sign of strength. Also we got bearish cypher harmonic pattern formed. So now we can expect a slight pullback up to 106-103k region from there we may see price reversing. But price should hold 100.3K region to remain bullish in short term.

Bitcoin will rise from support level and exit from wedgeHello traders, I want share with you my opinion about Bitcoin. This chart shows how the price rebounded from the current support level and then turned around and rebounded up. Price broke the 109000 level, coinciding with a support area, and then traded near this level for some time. Later price turned around and started to decline inside a downward channel, where it soon broke the 109000 level, reached the resistance line, and continued to fall next. Bitcoin fell to the support line of the channel, which coincided with the 103000 support level and buyer zone, after which it rebounded up. Then BTC exited from channel and later entered to upward wedge, where it at once made a correction movement from the resistance line to the support line, breaking the 103000 level. But soon, price made an impulse up, breaking the support level one more time. Next, it rose to the current support level, broke it too, and now trades inside the support area. In my mind, BTC can rebound from the support level and rise to the resistance line of the wedge. Then it can break this line, thereby exiting from the wedge and continuing to move up; therefore, I set my TP at 112000 points. Please share this idea with your friends and click Boost 🚀

TradeCityPro | Bitcoin Daily Analysis #114👋 Welcome to TradeCity Pro!
Let’s go over Bitcoin analysis and the key crypto indexes. As usual, I’ll break down the futures triggers for the New York session.
⏳ 1-Hour Timeframe
On the one hour timeframe, as you can see, a trading range has formed between the levels of 108617 and 110256. This has happened after a strong upward move with significant buying volume, and now we’re in a market correction phase.
📊 Market volume is decreasing during this corrective phase, which shows the strength of the buyers and supports the ongoing uptrend. RSI has exited the Overbuy zone and is now cooling off, which indicates that the bullish momentum has weakened for now.
📈 For a long position, the 110256 trigger seems very suitable today. If the price forms a higher low above 108617 before breaking this level, the probability of breaking 110256 increases significantly.
💥 If this trigger is activated, it’s crucial that volume rises as well. That would confirm the strength of the trend and increase the chances of the uptrend continuing. The current target for this position is 111747.
🔽 In the correction scenario, if the price stabilizes below 108617, this scenario becomes more likely and a deeper correction could follow.
✨ Personally, I won’t open a short position unless we get confirmation of a trend reversal. But if you want to go short, a break below 108617 is not a bad option and could signal a downward move.
👑 BTC.D Analysis
Bitcoin dominance has continued its downward movement, stabilized below 64.12, and is now heading toward 63.93.
⭐ If the 63.93 low is broken, the bearish move in dominance will likely continue. If it pulls back, a break above 64.12 will confirm that retracement.
📅 Total2 Analysis
Let’s look at Total2. Yesterday, it broke through the 1.2 level and is now moving toward 1.24. A breakout above this level could start the next bullish leg.
🎲 If a correction occurs, the price may drop back to 1.2 or even 1.18.
📅 USDT.D Analysis
Now for Tether dominance. This index is still sitting at the 4.56 support and is currently being held there. If 4.56 breaks, the next bearish leg can form.
🔔 In case of a retracement, USDT dominance might rise to 4.64.
❌ Disclaimer ❌
Trading futures is highly risky and dangerous. If you're not an expert, these triggers may not be suitable for you. You should first learn risk and capital management. You can also use the educational content from this channel.
Finally, these triggers reflect my personal opinions on price action, and the market may move completely against this analysis. So, do your own research before opening any position.

Just Need to take normal correctionBitcoin double top formation is going to mini rug again in altcoin, 106k is pretty enougt


btc updateentry price 109416
stop loss 110500
take profit
107800
103800
result 1 target and risk free
BTC:Range Likely Ahead of FOMC — Altcoin Strength Emerging📊 Bitcoin Price Update: Key Resistance Ahead – Range Likely Before FOMC
As previously discussed, Bitcoin may be entering a short-term consolidation phase. The current candlestick structure suggests that recent price action is driven by profit-taking from long positions, not aggressive selling. If bears were in control, we would have seen a deeper retracement by now — a positive sign for bulls.
Bitcoin is approaching a critical resistance zone between $110,264 and $111,782. If the price enters this range, some supply pressure is expected. However, as long as BTC holds above $107,000, the bullish market structure remains intact.
---
🔍 Key Technical Observations:
Recent candles show profit-taking, not distribution
Sellers are not yet active — indicating continued bullish sentiment
Bitcoin dominance is pulling back slightly while BTC ranges — this has led to stronger moves in altcoins
If BTC dips while dominance continues to fall, it could set the stage for an early altcoin rally (altseason)
---
🕰️ Macro Events on the Radar:
Key upcoming news:
U.S. CPI Data
FOMC Rate Decision – Wednesday next week
Until then, the market may remain range-bound as it awaits clarity
Recommendation: lower risk exposure, reduce position size, and stay selective with trades
---
⚠️ Altcoin Strategy:
If you're already in altcoin long positions, consider partial profit-taking
Watch Bitcoin dominance closely: continued downside could fuel a broader altseason
Keep an eye on BTC’s $107K support and its reaction near $111.7K resistance
---
📈 Summary:
Critical Resistance Zone: $110,264 – $111,782
Key Support: $107,000
Market Bias: Cautiously bullish
FOMC Outlook: Sideways movement likely until Wednesday

Differences Between Trading Stock Market and Coin Market
Hello, traders.
If you "Follow", you can always get new information quickly.
Have a nice day today.
-------------------------------------
Please read with a light heart.
-
Trading stock market and coin market seem similar, but they are very different.
In stock market, you have to buy and sell 1 share at a time, but in coin market, you can buy and sell in decimals.
This difference makes a big difference in buying and selling.
In the stock market, you should buy when the price is rising from a low price if possible.
The reason is that since you buy in units of 1 week, you have to invest more money when you sell and then buy to buy 1 week.
I think the same goes for the coin market, but since you can buy in decimal units, you have the advantage of being able to buy at a higher price than when you buy in the stock market.
For example, if you sell and then buy again at the same price, the number of coins (tokens) will decrease, but there will be no cases where you can't buy at all.
Therefore, the coin market is an investment market where you can trade at virtually any price range.
-
In terms of profit realization, the stock market can only be traded in a way that earns cash profits.
The reason is that, as I mentioned earlier, since you have to trade in units of 1 week, there are restrictions on trading.
However, in the coin market, in addition to the method of earning cash profits, you can also increase the number of coins (tokens) corresponding to the profits.
The biggest advantage of increasing the number of coins (tokens) corresponding to profit is that you can get a large profit in the long term, and the burden of the average purchase price when conducting a transaction is reduced.
When the price rises by purchase price, if you sell the purchase amount (+ including the transaction fee), the coins (tokens) corresponding to profit will remain.
Since these coins (tokens) have an average purchase price of 0, they always correspond to profit even if there is volatility.
In addition, even if the price falls and you buy again, the average purchase price is set low, so it plays a good role in finding the right time to buy and starting a transaction.
Of course, when the number of coins (tokens) corresponding to profit is small, it does not have a big effect on the average purchase price, but as the number increases, you will realize its true value.
You can also get some cash when you increase the number of coins (tokens) corresponding to profit.
When selling, if you add up the purchase price + transaction fee X 2~3, you can also get some cash profit.
If you get cash profit, the number of coins (tokens) remaining will decrease, so you can adjust it well according to the situation.
When the profit is large, increase the cash profit slightly, and when you think the profit is small, decrease the cash profit.
-
Therefore, when you first move from the stock market to the coin market and start trading, you will experience that the trading is not going well for some reason.
In the stock market, there are some restrictions on the rise and fall, but in the coin market, there are no restrictions, so it is not easy to respond.
However, as I mentioned earlier, the biggest problem is the difference in the transaction unit.
When trading in the stock market, you need to check various announcements and issues in addition to the chart and determine how this information affects the stock or theme you want to trade.
This is because trading is not conducted 24 hours a day, 365 days a year like the coin market.
This is because if an announcement or issue occurs during a non-trading period, the stock market may rise or fall significantly when trading begins.
-
When using my chart on a stock chart, the basic trading strategy is to buy near the HA-Low indicator and sell near the HA-High indicator.
However, if you want to buy more, you can buy more when the M-Signal of the 1D chart > M-Signal of the 1W chart, and it shows support near the M-Signal indicator of the 1W chart.
In the stock chart, it is recommended to trade when the M-Signal indicators of the 1D, 1W, and 1M charts are aligned.
The reason is that, as I mentioned earlier, trading must be done in 1-week units, so the timing of the purchase is important.
In the coin chart, you can actually trade when it shows support at the support and resistance points.
However, since trading is possible 24 hours a day, 365 days a year, even if it shows support at the support and resistance points, psychological anxiety due to volatility increases, so it is recommended to proceed with trading according to the basic trading strategy.
The creation of the HA-Low indicator means that it has risen from the low range, and the creation of the HA-High indicator means that it has fallen from the high range.
Therefore, if it shows support near the HA-Low indicator, it is likely to rise, and if it shows resistance near the HA-High indicator, it is likely to fall.
However, on the contrary, if it is supported and rises at the HA-High indicator, it is likely to show a stepwise rise, and if it is resisted and falls at the HA-Low indicator, it is likely to show a stepwise fall.
In order to confirm this movement, you need to invest a lot of time and check the situation in real time.
-
Thank you for reading to the end.
I hope you have a successful transaction.
--------------------------------------------------

Bitcoin (BTC): Buyers Maintain The Dominance After BreakoutBuyers keep the dominance after we had that volatile breakout near $106K. As we see that buyside volume is growing, we are expecting to retest the local ATH, which is basically 1.5K away from the current price (basically nothing).
After that, we are expecting to see some volatility, which eventually will turn into a breakout and a new ATH!
Swallow Academy

Bitcoin to $130,000Bitcoin broke out of the important yellow trendline and back tested that ( @$100k ) now its rising again. the main target now is $130,000 trendline

#BTC/USDT#BTC
The price is moving within a descending channel on the 1-hour frame, adhering well to it, and is heading for a strong breakout and retest.
We are experiencing a rebound from the lower boundary of the descending channel. This support is at 108883.
We have a downtrend on the RSI indicator that is about to be broken and retested, supporting the upward trend.
We are looking for stability above the 100 Moving Average.
Entry price: 109380
First target: 109948
Second target: 110800
Third target: 111670

btcusdt 4h
Bitcoin is also expected to test the previous bottom price of 100,500-101,000. It may even reach the 98,000-97,000 range with the needle share. Be careful if you have positions in altcoins. Daily closings above 106,500 are required for this scenario to be canceled. We are moving towards the days when price volatility will increase, do not forget to take profit from your positions.

Will Bitcoin move toward its ATH?This analysis is an update of the analysis you see in the "Related publications" section
In the previous analysis, we mentioned that the red zone marked on the chart could potentially be broken.
From the point where we placed the green arrow on the chart, Bitcoin’s diametric pattern has completed, and it has entered a corrective phase.
It now appears that we are in wave B of a running flat, and wave B could complete around the all-time high or slightly above it.
Let’s see whether this move will play out or not.
For risk management, please don't forget stop loss and capital management
Comment if you have any questions
Thank You

Bitcoin - Pump will continue! Sell here, thank me later.Bitcoin has been pumping in the past few days pretty massively. Why? There are 2 main reasons - the first reason is that Bitcoin has finished a major WXY corrective wave, and the second is that Bitcoin swept liquidity below a triangle (see my previous post for details). That was a very good opportunity to buy/long Bitcoin at that specific level I described in the previous analysis. But let's focus on the present and future!
We always want to find strong levels on the charts so we have a great entry point/take profit target. The next strong level is definitely the 0.618 FIB, which Bitcoin can hit in the very short term. Also, below the 0.618 FIB, we have a strong horizontal zone, which can also act as a strong resistance. Bitcoin should definitely go there and retest this zone.
We want to see how Bitcoin is going to react in the zone and FIB, but you can create a new limit order to short Bitcoin there so you don't miss anything. So currently I am temporarily bullish on Bitcoin, and in the next update I will make a big analysis on Bitcoin and a very likely scenario for the next months. What will the price of Bitcoin be in December? Please like/boost my idea right now.
Write a comment with your altcoin + hit the like button, and I will make an analysis for you in response. Trading is not hard if you have a good coach! This is not a trade setup, as there is no stop-loss or profit target. I share my trades privately. Thank you, and I wish you successful trades!

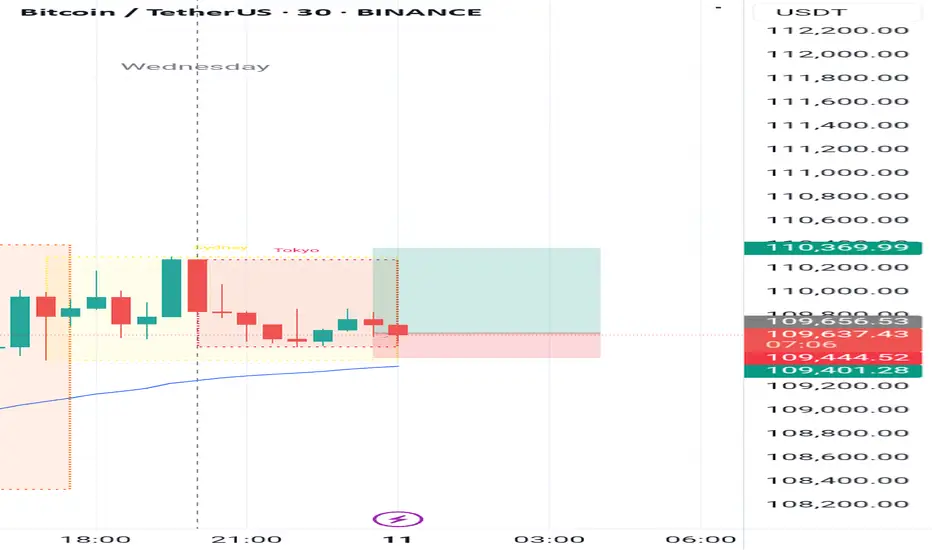
BTCUSD 15MThe chart you've shared is a 15-minute candlestick chart of Bitcoin/USDT (BTC/USDT) on Binance, with a short-term bearish outlook. Here's a breakdown of the analysis shown in the image:
---
🔍 Key Levels Identified:
Register Level Point (Resistance): Around 109,750 USDT
This is where price previously failed to break higher—acting as a local resistance.
Support Point: Around 109,350 USDT
This is the level where price has bounced before, now being tested again.
---
🎯 Trade Setup:
Entry Trigger: The price is approaching the support zone again. A break below the support could confirm the bearish move.
TP Target (Take Profit 1): ~109,250 USDT
A moderate take-profit level just below the support level.
TP2 Target (Take Profit 2): ~108,300 USDT
A deeper target, suggesting a stronger continuation of the downtrend if the support breaks convincingly.
---
🔻 **Bearish Bias Justification

BTC/USDT 1DAY CHART UPDATE !!Bitcoin displays a classic “cup and handle” structure on the daily timeframe – a historically bullish continuation pattern. The price has successfully broken above the neckline (~$107,000), indicating that bullish momentum is underway.
Thanks for your support!
DYOR. NFA

$BTC - Poor HighsBitcoin cleared the previous highs resting at 110k; however, it is still facing resistance at 110.3k.
We need to break above 110k to clear the significant highs at 112k.
Otherwise, I still expect a retest of 106k–107k before any further upward movement.

BTC - Short Play - Market Structure UpdateMarket Structure Update:
As we continue forming the right side of the current market structure, several key levels emerge as critical points of control. It's important to highlight that the current formation is mirroring the left side of the structure, and we are now approaching the midpoint of the cycle.
Based on this mirroring cycle, we anticipate downward movement today and tomorrow as the structure progresses toward completion.
---
🔻 Short Entry Zones
A close or wick below the following levels would confirm potential short entries:
109.6k – Left-side structure wick
109.3k – Structural support
108.2k – Key breakdown level
---
🎯 Short Targets
If confirmed, potential downside targets include:
108.3k
105.3k
104.6k
103.2k
102k
101.4k
100.3k
---
🔺 Important Levels to Monitor (If Uptrend Momentum Builds)
In the event of a bullish breakout, keep an eye on:
110.7k – All-Time High wick, right side of structure
111.9k – Wick just below ATH (May 25th), key structural zone
Stay alert. "As Above, So Below."
— ZemoG Trading Group

Is Bitcoin Ready to Launch? In-Depth Analysis of BTC, ETH, XRP, Hello everyone, I hope you're doing well.
Due to time constraints, I won't be analyzing each asset individually. Instead, I’ll provide a collective technical overview in this post.
This analysis includes the following cryptocurrencies: **Bitcoin, Ethereum, Ripple, Solana, Sui, and Chainlink**.
⚠️ **Please note:** On the **daily timeframe**, most of these assets are forming different patterns. However, the **weekly timeframe** provides a clearer and more reliable outlook.
---
### 🔍 **Technical Overview:**
📌 **Bitcoin (BTC)**
Currently forming a **"V" pattern**.
If BTC closes **above \$110,500 on the weekly timeframe**, the first target is **\$131,500**, and the second target is **\$165,000**.
📌 **Ethereum (ETH)**
Also in a **"V" pattern**.
If ETH closes **above \$2,833 on the weekly timeframe**, the first target is **\$4,200**.
📌 **Ripple (XRP)**
Forming a **bullish flag** pattern.
If XRP closes **above \$2.65 on the weekly timeframe**, the first target is **\$4.22**.
📌 **Solana (SOL)**
Forming a **"V" pattern**.
If SOL closes **above \$190 weekly**, the first target is **\$282**.
📌 **Sui (SUI)**
Also forming a **"V" pattern**.
If SUI closes **above \$4.26 weekly**, the first target is **\$6.97**.
📌 **Chainlink (LINK)**
Needs a **weekly close above \$18** to confirm breakout.
First target: **\$25**.
---
### 🧠 **Brief Fundamental Insights:**
* **Bitcoin** is being heavily accumulated by institutional investors and whales. On-chain metrics suggest we are **not at a cycle top**, and the ongoing **supply shock** and **massive exchange outflows** are strong bullish signs.
* **Ethereum** is under **strong accumulation** from both retail and institutional investors, as confirmed by recent **CoinShares reports**.
* **Ripple** is awaiting resolution of its ongoing lawsuit with the **SEC**.
* **Sui** is consistently rolling out updates and shows **unstoppable DeFi ecosystem growth**, giving it strong fundamental support.
* **Solana** is being accumulated by institutional players, including **SOL-specific strategies** and funds.
* **Chainlink** is seeing buying pressure supported by **positive news and strategic partnerships**, some of which are from **anonymous large players**.
---
🧠 Updated Fundamental Analysis (June 2025)
Bitcoin (BTC)
New Investment Record: In May, total investments in crypto funds reached $167 billion, with Bitcoin accounting for $5.5 billion, signaling strong institutional demand.
Institutional Buying Surge: ETF purchases, entries by institutions like Paris Saint Germain, and even countries like Pakistan have contributed to declining exchange reserves of Bitcoin.
Favorable Macro Conditions: Rising bond yields, stock market volatility, and a weakening U.S. dollar have made Bitcoin more attractive as a hedge asset.
Ethereum (ETH)
Consistent Inflows: Ethereum funds have seen seven consecutive weeks of capital inflows, with nearly $296 million added in the past week alone.
Institutional Confidence: Assets under management (AUM) in ETH funds have reached approximately $14 billion, indicating strong long-term faith by institutions.
Solana (SOL)
Strong Institutional Demand: Firms like Société Générale and Siebert Financial have recently invested in Solana.
On the Verge of ETF Approval: Franklin Templeton filed for a spot Solana ETF back in February, potentially boosting demand.
Whale & DeFi Growth: Increased whale activity, growing DeFi ecosystem, and rising developer engagement hint at a potential price rally to $200 and beyond.
Ripple (XRP)
While there is no major new fundamental data recently, the listing of XRP futures on CME and broader access for institutional investors may have a positive impact.
The ongoing legal case with the SEC remains a crucial factor in XRP’s future outlook.
Sui (SUI)
DeFi Expansion: Active daily users have grown by over 14%, and decentralized exchange volume has reached around $34 million per day.
TVL Growth: Suilend’s Total Value Locked (TVL) has hit $700 million, ranking 8th among all blockchains.
Institutional Attention: There are reports suggesting that an ETF for SUI may be under consideration, with on-chain utility continuing to expand.
Chainlink (LINK)
Collaboration with Major Financial Institutions: Chainlink is participating in CBDC pilots between Hong Kong and Australia, working with Visa, ANZ, and the Hong Kong Monetary Authority.
Ecosystem Growth: Development is supported via grants, like the $150K funding provided to Lightchain AI, strengthening Chainlink’s infrastructure.
Strategic Partnerships: Collaborations with JPMorgan, Ondo Finance, and Swift highlight Chainlink’s growing influence in connecting real-world data to blockchains.

BTC - Be mindful of resistance around 109,800 to 110,000Per my second last post about this red trendline - be mindful that there is a resistance located 109,800 to 110,000 zone.
Although Bitcoin can break above, that doesn’t mean the resistance is invalid. Price will weave above and below until it sticks and plays out.
Personally I watch these levels for sudden fast movement and confirmation that it’s holding as resistance.
If you see a fast drop initiate from these levels, be mindful that this could be indicative of intention to hit the lows around 20,000.
For more information see my previous posts.
Happy trading

