BTCUSDT: Positive CDV Divergence for Potential Long Setups• Market Overview: Bitcoin currently sits at a pivotal point. Although the price movement has been somewhat indecisive, we’re watching closely for signs of bullish momentum.
• CDV Divergence Focus: Our attention is on a potential positive Cumulative Volume Delta (CDV) divergence. This takes shape when the price makes a lower low but CDV registers a higher low (regular bullish divergence), or when the price posts a higher low and CDV shows a lower low (hidden bullish divergence). These patterns can hint at growing buying interest even if price action hasn’t caught up yet.
• Support Zones (Blue Boxes): The highlighted blue zones on the chart signal potential support levels where buyers may step in. These are mapped from prior demand areas or structural support points.
• Trade Setup: Should a confirmed positive CDV divergence appear near or inside one of these blue zones, it could offer a strong case for a long entry. This would suggest that while the price may look weak, buying strength is quietly building underneath.
• Managing Risk: Any long entry must be accompanied by a well-defined invalidation level—typically just below the blue box support or the lowest point of the divergence.
Disclaimer: This is a technical pattern-based analysis intended for informational purposes only. Trading involves risk. Always perform your own due diligence and assess your risk appetite before entering any trades.
BTCUSDT.5L trade ideas

BTCUSDT: building up for a bigger pullback.As it stands, BTC is at a very important area. There's a first sign that the trend will change for the coming days and I expect the price to drop towards the 103k area.

"BTC to $108,800 – How Likely Is It?"Bitcoin is showing strong bullish momentum as key technical indicators align in favor of a major breakout. With increasing institutional interest, rising ETF inflows, and a favorable macroeconomic environment, BTC appears to be setting up for a potential rally toward the $108,800 level. Historical price action also suggests that once Bitcoin breaks past major resistance zones, it often surges rapidly. If the current support levels hold and buying pressure continues, the $108,800 target may be closer than expected.

BTC Is Replaying a Bullish Fractal >>> Are You Watching?Hello guys!
I see a deja vu here! Let’s look at the historical daily chart (Jan–May 2025):
What happened?
Initial Drop (Yellow Oval): Bitcoin approached a key S&D zone but didn't touch it, triggering a short-lived bounce before dropping again.
Second Drop (Red Ovals): This time, price precisely touched the demand zone, triggering a clean bullish reversal.
What followed was a strong trend breakout, sustained higher lows, and an eventual surge past prior resistance levels.
Current 4H Chart Setup: A Mirror Image?
Yellow Highlight: Once again, we saw a bounce that didn't quite touch the key demand zone ($98K–$100K).
Red Zone Prediction: If this mirrors the historical move, the price is likely to return and touch this S&D area before launching a bullish leg.
Blue Path Projection: A sharp reversal is expected post-touch, aiming toward $111K–$113K as the next key resistance zone.
The descending trendline adds confluence
___________________
History Doesn’t Repeat, But It Often Rhymes
Based on this fractal analysis, Bitcoin is likely forming the same bullish base seen earlier in 2025. The setup hinges on one key event: a return to the $99K–$100K zone, where demand is likely to step in aggressively.
If the pattern repeats, the current market may offer one last high-reward long opportunity before a parabolic rally.

Btcusd techinical analysis.Btcusd techinical analysis next move psibale at h1 time frame.not finchinal advice.

BTC Analysis (4H)This analysis is an update of the analysis you see in the "Related publications" section
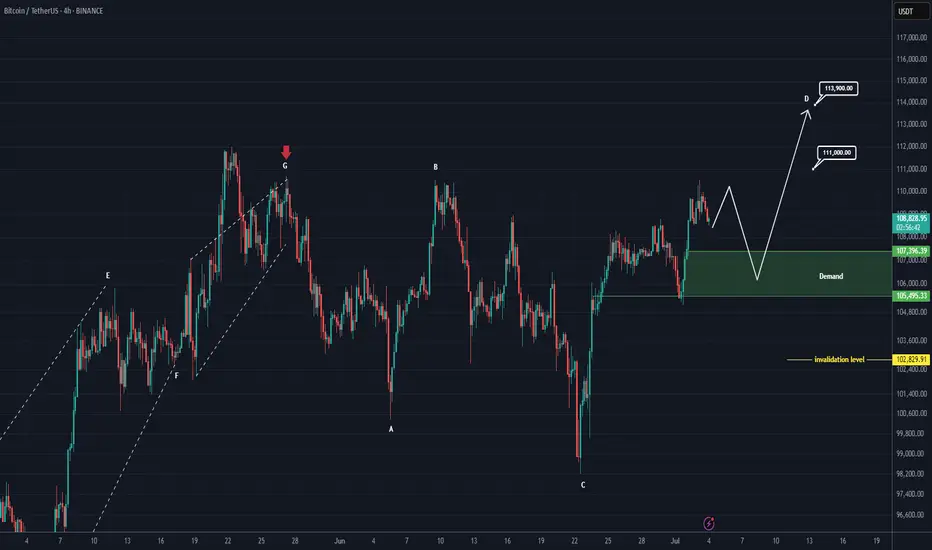
Since the red arrow was placed on the chart, Bitcoin's bullish phase has ended and it has entered a corrective phase. This correction appears to be forming a Diametric pattern, and we are currently in the middle of wave E.
After interacting with the demand zone, the price may move toward the specified targets.
A daily candle closing below the invalidation level will invalidate this analysis.
For risk management, please don't forget stop loss and capital management
Comment if you have any questions
Thank You

SatochiTrader Expecting a huge BTC CRASH AFTER This..BTC Market Update by SatochiTrader
EVERY CRASH DID START WITH A FALSE INCREASE TREND.
Depending on the market sentiment and price action, BTC is currently showing strength with a positive trend. However, based on deeper data and insights held by myself and a small group of early-cycle followers, this current movement may be a deceptive signal — potentially foreshadowing a major crash.
This is not trading advice. Those who are confident in the long position should continue, and those on the other side should stay prepared as well.
We have previously explained that the current cycle appears to have ended. Since 2013, BTC has consistently respected its macro cycle targets. The end of such a cycle typically leads to significant corrections.
A cycle ending implies not just a retracement, but the potential for a major crash. Hedge funds and real BTC whales understand the underlying indicators and risks at play. Our expectation remains clear: BTC may soon fall below the 100K level, with $85K identified as a critical support and target zone.
Stay sharp. Stay informed. The market may look bullish — until it isn't.
The best way to follow BTC is not the news.. but the cycle overview.
This update is an education update, which means the high expectations of the upcoming correction for BTC.
Compared to last quarter, miners are now less severely underpaid, though profitability remains low

Bitcoin Rejected at Value Area High — Full Market Auction Lower?Over the past 24 hours, Bitcoin has seen a short-term pullback after being rejected from the daily resistance level, which aligns with the value area high. The reaction also coincides with a volatility squeeze shown on the Bollinger Bands — hinting at a controlled, technical rejection rather than a panic selloff. If the market follows traditional auction theory, a full rotation toward the value area low may now be in progress.
Key Technical Points:
-Value Area High Rejection: Price was rejected from high time frame resistance and respected auction theory principles
-Targeting $103,000 Value Area Low: Price may rotate lower if resistance continues to cap upside
-$100,000 Psychological Support Untapped: Remains a magnet for liquidity if the range plays out fully
Bitcoin’s structure over the past week has remained range-bound between $108,000 and $100,000. The recent failure to break through the value area high at the upper end of this range has now triggered a controlled pullback — technically expected based on market auction dynamics. Once a value area high is respected and price cannot sustain above it, the natural response is for the market to seek equilibrium by rotating toward the value area low.
This theory aligns with current confluences: the rejection occurred exactly where daily resistance, the value area high, and upper Bollinger Band resistance converged. The rejection was not sudden or erratic, but gradual — indicating that this is likely a technical rejection, not emotional selling. If this rotation plays out as expected, the next key support will be found near the $103,000 region.
What further supports this narrative is the untouched $100,000 psychological level, which remains a natural magnet for both liquidity and sentiment. From a market structure perspective, $100K serves as a clean test zone for buyers to step in and attempt to form a bottom — particularly if the pullback is slow and controlled rather than volatile and sharp. Until then, all signs suggest that the upper limit of the current range has held.
If Bitcoin remains capped beneath $108,000, expect further downside pressure. A full market auction rotation could bring price to $103,000, with the potential to dip as low as the $100,000 psychological level. This zone will be key for judging the strength of buyers and determining whether the range continues or a broader breakdown begins. Only a reclaim of the value area high would invalidate this structure.

BTCUSDT: Bullish Outlook Following Liquidity Sweepnavigating around pivotal areas defined by Breaker Blocks (BB) and Fair Value Gaps (FVG) on both the 1-hour and 2-hour charts. These zones represent high-probability areas for market reactions, whether as support for continuation or as points for potential short-term retracement before a larger rally.
strongly favors a bullish continuation for BTC. monitor interactions with the identified BB/FVG zones for optimal entry points, anticipating a potential dip to sweep short-term BSL or mitigate imbalances before the next significant leg up.

Bitcoin - Flag pattern is brokenBitcoin had been consolidating within a flag pattern for the past three months. That pattern has now officially broken to the upside, with the price surging to $109K — a strong bullish signal fueled by encouraging news around institutional adoption.
Based on both the technical flag breakout and ongoing fundamental momentum, the next target for Bitcoin is $145K. Any move beyond that would be considered a bonus in this current bull cycle.
Stay tuned for more updates.
Cheers,
GreenCrypto

Bitcoin New Update (4H)This analysis is an update of the analysis you see in the "Related publications" section
If we were to publish an update for Bitcoin, wave D could move toward higher levels.
After hitting the green zone and gaining momentum, it could once again move upward to liquidate short positions.
In this update, we've naturally raised and revised the invalidation level.
The new targets have been marked on the chart.
A daily candle closing below the invalidation level would invalidate this analysis.
For risk management, please don't forget stop loss and capital management
Comment if you have any questions
Thank You
Mastering Inverse Fair Value Gaps (IFVG) - How to use them?In this guide, I’ll explain the concept of the Inverse Fair Value Gap (IFVG), how it forms, and how you can use it to identify high-probability trading opportunities. You'll learn how to spot the IFVG on a chart, understand their significance in price action, and apply a simple strategy to trade them effectively.
What will be discussed?
- What is a FVG
- What is an IFVG
- What is a bullish IFVG
- What is a bearish IFVG
- How to trade the IFVG
-------------------------------
What is a FVG?
A FVG is a technical concept used by traders to identify inefficiencies in price movement on a chart. The idea behind a fair value gap is that during periods of strong momentum, price can move so quickly that it leaves behind a "gap" where not all buy and sell orders were able to be executed efficiently. This gap creates an imbalance in the market, which price may later revisit in an attempt to rebalance supply and demand.
A fair value gap is typically observed within a sequence of three candles (or bars). The first candle marks the beginning of a strong move. The second candle shows a significant directional push, either bullish or bearish, often with a long body indicating strong momentum. The third candle continues in the direction of the move, opening and closing beyond the range of the first candle. The fair value gap itself is defined by the price range between the high of the first candle and the low of the third candle (in the case of a bullish move), or between the low of the first candle and the high of the third (in a bearish move). This range represents the area of imbalance or inefficiency.
-------------------------------
What is an IFVG?
An Inverse Fair Value Gap (IFVG) occurs when a traditional Fair Value Gap (FVG) is not respected by price, and instead of acting as a support or resistance zone, price breaks through it with strength. Normally, a Fair Value Gap represents a price imbalance left by a strong move, and when price returns to this area, it often reacts by respecting the gap, bouncing off it or reversing, because it's seen as a high-probability level where orders may rest.
However, in the case of an IFVG, price does not respect this imbalance. Instead, it slices through the FVG in the opposite direction, showing that the initial momentum behind the imbalance has weakened or reversed. This breach is a strong indication that market sentiment is shifting. What was once a zone of strength now becomes invalid, and this failed reaction signals that the opposite side of the market (buyers or sellers) has taken control.
The IFVG highlights a key transition in momentum. It tells traders that the prior bias, bullish or bearish, is breaking down, and the new dominant force is pushing price beyond levels that would typically hold. This makes the IFVG useful not only as a sign of failed structure but also as a potential confirmation of a trend reversal or strong continuation in the opposite direction. Essentially, where an FVG usually acts as a wall, an IFVG is what’s left after that wall gets knocked down.
-------------------------------
What is a bullish IFVG?
A bullish Inverse Fair Value Gap (IFVG) occurs when price breaks through a bearish Fair Value Gap (FVG) instead of respecting it. In a typical bearish FVG, the expectation is that when price retraces into the gap, it will react to the imbalance, usually by reversing lower, as the area represents previous selling pressure or inefficiency caused by aggressive sellers.
However, when price does not react bearishly and instead breaks cleanly through the bearish FVG, it signals a shift in market sentiment and momentum. This breakout through the imbalance suggests that buyers are now in control and that the bearish pressure in that zone has been absorbed or invalidated. What was once considered a resistance area is now being overpowered, often leading to continued bullish movement.
-------------------------------
What is a bearish IFVG?
A bearish Inverse Fair Value Gap (IFVG) occurs when price breaks through a bullish Fair Value Gap (FVG) instead of respecting it. In a normal bullish FVG, the expectation is that when price returns to the gap, it will act as support and prompt a move higher, as this area represents a previous imbalance created by strong buying pressure.
However, when price fails to respect the bullish FVG and instead breaks down through it, this signals a shift in momentum to the downside. The anticipated support fails to hold, suggesting that buyers are no longer in control or that their efforts have been overwhelmed by aggressive selling. This kind of move transforms the bullish FVG into a bearish signal, as it confirms weakness in what was previously considered a demand zone.
-------------------------------
How to trade the IFVG?
Trading the Inverse Fair Value Gap (IFVG) requires patience, precision, and clear confirmation of a shift in momentum. The process involves waiting for key conditions to form before entering a trade. Here's how to approach it step-by-step:
First, you need to wait for a liquidity sweep. This means price must take out a recent high or low, typically a short-term liquidity pool, trapping traders on the wrong side of the market. This sweep sets the stage for a potential reversal and indicates that the market is ready to shift direction.
After the liquidity sweep, watch for a 1-minute Fair Value Gap (FVG) to form and then get broken in the opposite direction. This break is crucial, it’s what creates the Inverse Fair Value Gap. The invalidation of this initial FVG confirms that momentum has switched and that the market is no longer respecting the previous imbalance.
Once the IFVG has formed, your entry comes on the close of the candle that breaks and closes beyond the IFVG, above it in a bullish scenario, or below it in a bearish one. This close confirms that the gap has not held and that price is likely to continue in the new direction.
Place your stop loss below the low (for a bullish setup) or above the high (for a bearish setup) of the structure that formed the IFVG. This gives you protection just beyond the level that would invalidate the setup.
-------------------------------
Thanks for your support.
- Make sure to follow me so you don't miss out on the next analysis!
- Drop a like and leave a comment!

Bitcoin Update 25.06.2025 —Altcoins, Top Altcoins Choice & MoreGood morning my fellow Cryptocurrency trader, I hope you are having a nice week and a wonderful day.
We have good news to start today and it is all based on Bitcoin's price action. This is going a bit deep on the daily noise, price swings.
Price action analysis
Bitcoin went deep on its sideways range and tested below 100K. This is normal for a sideways market. The positive news comes from the fact that Bitcoin is once more trading above $106,000 and already hit above $107,000. This type of action reveals a bullish bias.
If the market was mainly bearish with a major drop on the deck, say going below 90K or 80K even, then Bitcoin would not be allowed to go beyond $105,000. In fact, any bounce or small recovery would be quickly sold as bear would be active, waiting and selling each time prices move up.
The fact that Bitcoin can grow day after day and consume all selling pressure while doing so, reveals a strong presence from buyers. We know this to be true because Bitcoin is now in a new phase in its evolution and growth cycle. It is truly a young technology that only now is being fully accepted with plenty of room available for growth.
We have three instances where Bitcoin moved above 110K. The selling that happened afterward is not filled with pressure, instead you can see some standard candles as prices continue to consolidate.
On the other hand, notice the last session from 21-June (21-24 June —3D candles). You can see a long lower shadow, a bullish hammer; there was definitely strong buying pressure as soon as Bitcoin reached below support.
Altcoins market action
Some altcoins continue to produce multi-months high. The highest price since January 2025. These altcoins recovered, started to rise and continue rising in clear, standard bull market fashion. Literally straight up.
Some altcoins did even better and grew as high as December or November 2021. The highest price in almost four years. This is very important when we go deep into the chart and price action because it is the main revealing signal. The altcoins simply do not go on a major bull market before a market crash. If the altcoins are recovering or rallying, it is because the market is set to "buy." The Cryptocurrency market is in bullish mode.
If the market was set to drop long-term then we would be experiencing a rise that is running out of momentum. This rise would later peak and a surprise sudden flash crash would signal the start of a major downturn. This is not what we see.
Inversely, if prices are going to rise strongly we start by seeing some form of retrace or correction, this event losing momentum and volume and then finally a strong bullish jump as soon as support is confirmed. This bullish jump would signal the start of a major market move. This is what we are experiencing today.
Bitcoin & Altcoins
Bitcoin and the altcoins move together. Bitcoin leads the altcoins, the altcoins reveal what Bitcoin will do when the action is sideways.
We can always say that Bitcoin is leading the altcoins of course because Bitcoin has been growing non-stop since November 2022. The major trend being bullish the altcoins are set to follow at some point.
Now, when Bitcoin goes sideways, by definition, anything goes. The market can break-down just as it can break-up. This is where the altcoins become useful.
If smaller Cryptocurrency projects are moving ahead, strongly and even producing 3-4 multi-year highs, it reveals what Bitcoin will do once its consolidation period ends.
Buying Bitcoin
In short, Bitcoin is going up. The next major market move is a rise and we have proof coming from the signals, the altcoins and the charts.
Never again in its history Bitcoin will trade below 80K. 90K soon to be gone... Once the action starts, you will look like a genius for buying below $110,000.
What to choose: Bitcoin or altcoins?
Now, my personal suggestion is different. If you are not a whale, the way to go are the altcoins. Why? Because there is more room for these to grow. We can say that the altcoins are riskier, but risk is almost non-existent with spot. We can simply focus on the pairs that have been filtered by the major exchanges. Reputable pairs with a long track record and plenty of room available for growth. You can't go wrong with those.
If you are ready for the 2025 bull market, leave a comment below.
Altcoins analysis by request
I think it is time for a new Your Top Altcoins Choice, session. It is always wise to do these when the market hits bottom or before a major bullish wave, that's exactly where we are now. If you agree and would like to see a new session, leave a comment saying "Yes! Top Altcoins Choice." If there is enough interest we can work together and find many hidden gems. It can be done with your support.
Namaste.

$BTC Consolidating Before the Next Big Move?CRYPTOCAP:BTC consolidating after a strong bounce!
Bitcoin is holding well above the 106K support zone and forming a tight range just below resistance.
After a false breakout above 100K, the price is compressing just below key resistance at 108100.
This consolidation between 106500 and 108100 looks like a pause, not a top.
If BTC breaks 108100, the next targets are 110500 and ATH.
Market structure is still bullish.
A retest of 106500–105650 is possible before liftoff.
Are you positioned for the breakout?
If you find my updates helpful, don’t forget to like and follow for more!
DYOR, NFA
#BitcoinRecovery

Bitcoin (BTC): Going For Another Breakout | New ATH?Bitcoin is showing strong signs of buyside movement, where we are pressuring the local resistance zone, which upon breaking should lead us to a new ATH area.
We have had multiple attempts to break out from that area, so being back here does not mean anything. yeet, we have to ave clean breakout in order to see the $120K area tested.
Swallow Academy

Check if price can hold above M-Signal indicator on 1D chart
Hello, traders.
If you "Follow", you can always get new information quickly.
Have a nice day today.
-------------------------------------
I failed to register a modified indicator of StochRSI indicator on TradingView alone, so I added it to the existing OBV by readCrypto indicator.
From the top of the indicator setting window to the bottom
1. OBV indicator of Low Line ~ High Line channel
2. PVT-MACD oscillator indicator
3. StochRSI indicator
They are registered in the order above.
Since the values used are all different, you should activate and use one indicator.
Please check the chart above.
------------------------------------------
(BTCUSDT 1D chart)
It is showing a downward trend as it failed to rise above the HA-High indicator (108316.90) on the 1D chart.
It is currently checking whether there is support near 107340.58, which is the StochRSI 50 indicator point.
If it fails to receive support and falls, it is expected to fall to around 104463.99.
The 104463.99 point is the DOM (60) indicator point of the 1W chart, which corresponds to the end of the high point on the 1W chart.
Since the StochRSI 20 indicator point is formed near the 104463.99 point, its importance can be considered high.
-
Since the M-Signal indicator of the 1D chart is passing near 106133.74, there is a possibility of volatility when touching this area.
Since the volatility period begins around July 2 (July 1-3), it is necessary to keep an eye on the current movement.
-
However, the key is to buy near the HA-Low indicator and sell near the HA-High indicator, so the current movement may be natural.
This volatility period is expected to last until around July 10 (July 9-11), so be careful when trading to avoid being fooled by fakes.
----------------------------------------
- The StochRSI indicator is showing signs of transitioning to a state where K < D.
- The PVT-MACD oscillator indicator is showing signs of decline.
- The OBV indicator of the Low Line ~ High Line channel is showing signs of decline in the High Line.
Therefore, if you look at the indicators, they are showing signs of decline overall.
However, if the OBV rises above the High Line, the price will show signs of rise.
Therefore, we need to observe the movements of the indicators while checking whether there is support at the StochRSI 50 indicator point.
Basically, the time to make a purchase is when it shows support near the DOM (-60) ~ HA-Low indicator.
If you want to make a purchase outside of that, you should not forget that a short and quick response is required.
The indicators that tell you the high point are HA-High, DOM(60) indicators.
In addition, there are StochRSI 80 and StochRSI 20 indicators that require quick response.
-
Thank you for reading to the end.
I wish you successful trading.
--------------------------------------------------
- Here is an explanation of the big picture.
(3-year bull market, 1-year bear market pattern)
I will explain the details again when the bear market starts.
------------------------------------------------------

StochRSI indicator and support and resistance levels
Hello, traders.
If you "follow" me, you can always get the latest information quickly.
Have a nice day today.
-------------------------------------
The StochRSI indicator on the left chart is slightly different from the StochRSI indicator on the right.
The StochRSI indicator on the left chart is the StochRSI indicator provided by default in TradingView, and the StochRSI indicator on the right chart is an indicator with a modified formula.
The StochRSI indicator is a leading indicator that is reflected almost in real time.
Therefore, it reacts sensitively to price changes.
Although it is advantageous because it reacts sensitively, it also increases the possibility of being caught in a fake, so I thought that a slight delay(?) was necessary, and so I created the StochRSI indicator on the left chart.
If you look at the relationship between the K and D of the StochRSI indicators on the two charts, you can see that there is a big difference.
In the end, you can predict the movement by checking whether the movement of the K line has escaped the overbought or oversold section.
However, I think that you will receive information that can determine the sustainability of the trend depending on the positional relationship between K and D.
Therefore, it is important to distinguish the inflection points that occur in the StochRSI indicator.
This is because these inflection points provide important information for drawing trend lines.
Therefore, the StochRSI indicator on the left chart, which better expresses the inflection point, is being used to draw the trend line.
(Unfortunately, this indicator was not registered on TradingView because I did not explain it well.)
-
As a new candle was created, the StochRSI indicator on the left chart is showing an inflection point on the K line.
The StochRSI indicator on the right chart is showing a transition to a state where K < D.
We will have to check whether the inflection point was created only when today's candle closes, but I think that the fact that it is showing this pattern means that there is a high possibility of a change in the future trend.
Since the next volatility period is expected to start around July 2nd (July 1st-3rd), I think it has started to show meaningful movements.
-
It is true that you want to buy at the lowest price possible and sell at the highest price.
However, because of this greed, one mistake can lead to a loss that can overturn nine victories, so you should always be careful.
Therefore, if possible, it is better to check for support and respond.
In that sense, I think it is worth referring to the relationship between K and D of the StochRSI indicator on the left chart.
This is because the actual downtrend is likely to start when K < D.
-
In order to check for support, you definitely need support and resistance points drawn on the 1M, 1W, and 1D charts.
Ignoring this and checking for support at the drawn support and resistance points can result in not being able to apply the chart you drew to actual trading.
Therefore, you should draw support and resistance points first before starting a trade.
Otherwise, if you draw support and resistance points after starting a trade, you are more likely to set support and resistance points that reflect your subjective thoughts, so as I mentioned earlier, you are more likely to lose faith in the chart you drew.
If this phenomenon continues, it will eventually lead to leaving the investment market.
-
It is important to determine whether there is support by checking the correlation between the StochRSI indicator and other indicators at the support and resistance points drawn on the 1M, 1W, and 1D charts.
Even if the inflection point of the StochRSI indicator or other indicators occurs at a point other than the support and resistance points you drew, you should consider it as something that occurred beyond your ability to handle.
In other words, you should observe the price movement but not actually trade.
As I mentioned earlier, if you start to violate this, you will become less and less able to trust the chart you drew.
-
Accordingly, the basic trading strategy I suggest is to buy near the HA-Low indicator and sell near the HA-High indicator.
However, since the HA-Low and HA-High indicators are expressed as average values, they may move in the opposite direction to the basic trading strategy.
In other words, if the HA-Low indicator is resisted and falls, there is a possibility of a stepwise downward trend, and if the HA-High indicator is supported and rises, there is a possibility of a stepwise upward trend.
Therefore, the basic trading strategy mentioned above can be considered a trading strategy in the box section.
In the case of deviating from this box section, it is highly likely to occur before and after the volatility period indicated by the relationship between the trend line using the StochRSI indicator mentioned above and the support and resistance points drawn on the 1M, 1W, and 1D charts.
Therefore, special care is required when conducting new transactions during the volatility period.
This is because there is a high possibility of being caught in a fake when trading during the volatility period.
-
The DOM(60) and DOM(-60) indicators are good indicators to look at together with the HA-Low and HA-High indicators.
The DOM indicator is an indicator that comprehensively evaluates the DMI, OBV, and MOMENTUM indicators.
Therefore, the DOM(60) indicator is likely to be at the end of the high point range, and the DOM(060) indicator is likely to be at the end of the low point range.
In the explanation of the HA-Low and HA-High indicators,
- I said that if the HA-Low indicator receives resistance and falls, there is a possibility that a stepwise downtrend will begin,
- and if the HA-High indicator receives support and rises, there is a possibility that a stepwise uptrend will begin.
In order for an actual stepwise downtrend to begin, the price must fall below DOM(-60), and in order for a stepwise uptrend to begin, it must rise above DOM(60).
In other words, the DOM(-60) ~ HA-Low section and the HA-High ~ DOM(60) section can be seen as support and resistance sections.
-
If these correlations start to appear, I think you will be able to create a trading strategy that fits your investment style without being swayed by price volatility and proceed with trading.
The reason for analyzing charts is to trade.
Therefore, the shorter the time for chart analysis, the better, and you should increase the start of creating a trading strategy.
-
Thank you for reading to the end.
I hope you have a successful trade.
--------------------------------------------------

A Comprehensive Analysis !!!This market has shown disregard for technical patterns, and every time the price approaches historically significant levels, it reveals its true intentions and disappoints us. This cycle tends to repeat.
In my opinion, we’re likely to see one more drop in Bitcoin’s price. After that, instead of continuing the expected downtrend from the pattern, the price could break the descending formation and experience a strong upward move.
Stay Awesome , CobraVanguard.

Pine Screener - Powerful tool for building programmable screenerHello Everyone,
In this video, we have discussed on how to use pine screener utility of tradingview. We are making use of the indicator Divergence Screener for this demonstration and screen stocks undergoing bullish divergence.
In a nutshell, here are the steps:
🎯 Use Stock Screener to build watchlist of less than 1000 symbols
🎯 Add the indicator you want to use in the pine screener to your favorites.
🎯 Pine screener can be accessed from the tradingview screener menu or you can simply click on the link www.tradingview.com
🎯 Add the watchlist and indicator to the pine screener and adjust the timeframe and indicator settings
🎯 Select the criteria to be scanned and press scan

Bitcoin shortBitcoin has lost the daily level, has been rejected by weekly level
Not only, but also Bitcoin has lost weekly open, previous week's high and Monday high
I am currently short

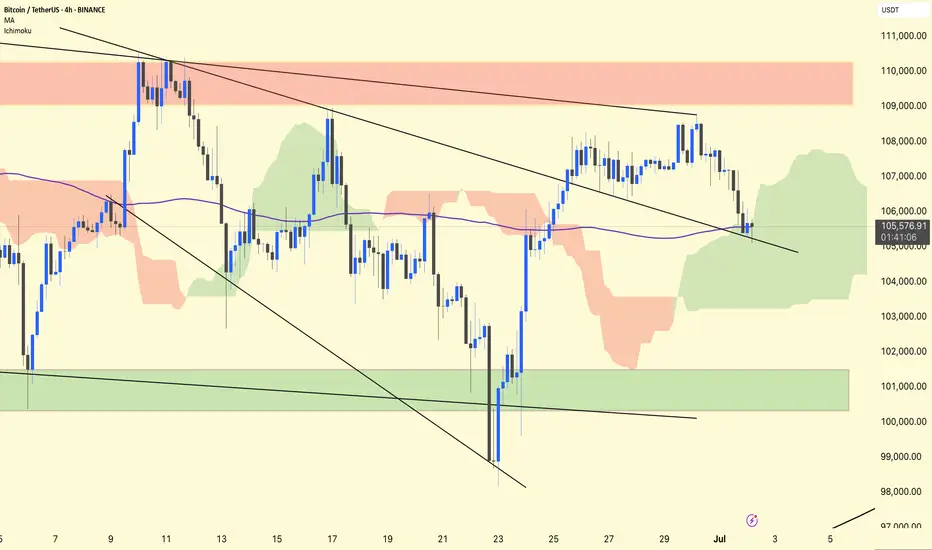
BTC/USDT 4H Analysis.
BTC remains in a retest phase after breaking out of the first descending broadening wedge.
The price has returned to test the upper wedge trendline, which is now acting as support around ~$105,500.
The purple 1 00-period MA (~105,570) overlaps this retest zone, adding additional confluence to the support.
Ichimoku
BTC is inside a green cloud, indicating indecision but not a confirmed trend reversal.
The cloud provides dynamic support in the ~$104,500–105,500 area.
Stay alert!
Analyzing the new month, new week, new day
Hello, traders.
If you "follow", you can always get the latest information quickly.
Have a nice day today.
-------------------------------------
(BTCUSDT 1M chart)
A new month begins in one day.
The key is whether it can hold the price by rising above 109588.0.
If not, there is a possibility that it will fall below the 94172.00 StochRSI 50 indicator point that the arrow is pointing to.
We need to see if it can rise with support near the Fibonacci ratio of 1.618 (89050.0).
Since the current low-point trend line is not complete, it is not surprising that it can show a downward trend at any time.
However, if it rises above 109588.0 and maintains the price, it is expected that there will be an attempt to rise near the Fibonacci ratio of 2.618 (133889.92).
I think it is likely to be the last target of the target bull market in 2025.
-
(1W chart)
It is a period of volatility around the week including June 23.
That is, from June 16 to July 6 is the volatility period.
The key is whether it can rise to the right Fibonacci ratio 2.24 (116940.43) during this volatility period.
Even if it fails to rise, if the price maintains above 104463.99, it is expected to show an upward trend around the next volatility period.
The next volatility period on the 1W chart is expected to be around the week of August 18.
-
When it falls below 104463.99, we need to check whether the HA-High indicator is newly generated.
If not, it is important to check whether there is support around the current HA-High indicator point of 99705.62.
Since the M-Signal indicator on the 1W chart is passing around 99705.62, its importance can be said to be high.
If it falls below the M-Signal indicator of the 1W chart, it is expected to determine the trend again when it meets the M-Signal indicator of the 1M chart.
-
(1D chart)
The key is whether it can maintain the price by rising above the HA-High indicator point of 108316.90 on the 1D chart.
If it fails to rise,
1st: 104463.99
2nd: 99705.62
You should check for support near the 1st and 2nd above.
If it falls below the M-Signal indicator of the 1W chart,
1st: 89294.25
2nd: M-Signal of the 1M chart
There is a possibility that it will fall near the 1st and 2nd above.
-----------------------------------------
(1W chart)
The chart above is a trend line chart drawn on the 1W chart.
It looks complicated, but what's important to look at is the correlation between the high-point trend line and the low-point trend line.
That is, even if the price rises above 109.588.0, if it doesn't rise above the high-point trend line, it is likely to fall near the low-point trend line.
Fortunately, since it is forming an upward channel, it is expected that the price will eventually rise even if it falls.
-
(1D chart)
Unlike the trend line on the 1W chart, the high-point trend line on the 1D chart forms a downward trend line.
Accordingly, the period around July 7, when the low-point trend line and the high-point trend line intersect, can be considered an important period of volatility.
However, the volatility period starts around July 2nd and is expected to end around July 10th.
----------------------------------------------
As shown above, many lines were drawn to analyze the chart.
I have roughly explained which of the lines drawn in this way should be prioritized.
Since chart analysis is for creating a trading strategy, the support and resistance points drawn on the 1M, 1W, and 1D charts are ultimately the most important.
Therefore, it is most important to check how the support and resistance points were created and find the reason for them.
Other analyses are only additional elements.
As I always say, chart analysis that does not show support and resistance points is only an analysis chart that can be used for trading.
You cannot trade with such analysis charts.
Also, if support and resistance points are shown, you should check the basis for setting the support and resistance points.
In order to serve as a support and resistance point, there must be a basis.
When you cannot confirm the basis for the support and resistance point, it is important to ask questions and find out the basis.
Fibonacci ratios are not suitable for actual trading.
However, when the ATH or ATL is updated, it is valuable enough for analysis.
Other than that, there must be support and resistance points drawn on the 1M, 1W, and 1D charts.
-
Thank you for reading to the end.
I hope you have a successful trade.
--------------------------------------------------
- This is an explanation of the big picture.
(3-year bull market, 1-year bear market pattern)
I will explain more details when the bear market starts.
------------------------------------------------------

BTCUSDT Analysis – Bullish Focus Amid ConsolidationBTCUSDT Analysis – Bullish Focus Amid Consolidation
Bitcoin is currently mirroring the broader market sentiment, particularly tracking the S&P 500. After a false breakout above the psychological 100K level, BTC entered a distribution phase, followed by a consolidation range. This indicates a potential accumulation before a bullish continuation, although resistance levels remain key hurdles.
False Breakout at 100K: A failed breakout attempt triggered a sharp reversal, signalling short-term weakness. Price rolled back and found temporary support around 106,200, pausing further downside The pair is consolidating within a tight range, indicating a possible setup for a renewed bullish push.
Outlook: Despite the resistance cascade, BTC remains in a bullish structural zone as long as it holds above 106,000. A clean breakout above 108,500–110,000 could open the path back toward 114,000–117,000. However, failure to break may result in a deeper pullback towards 104,000–102,500.
Ps Support with like and comments for more analysis Thanks for supporting.
