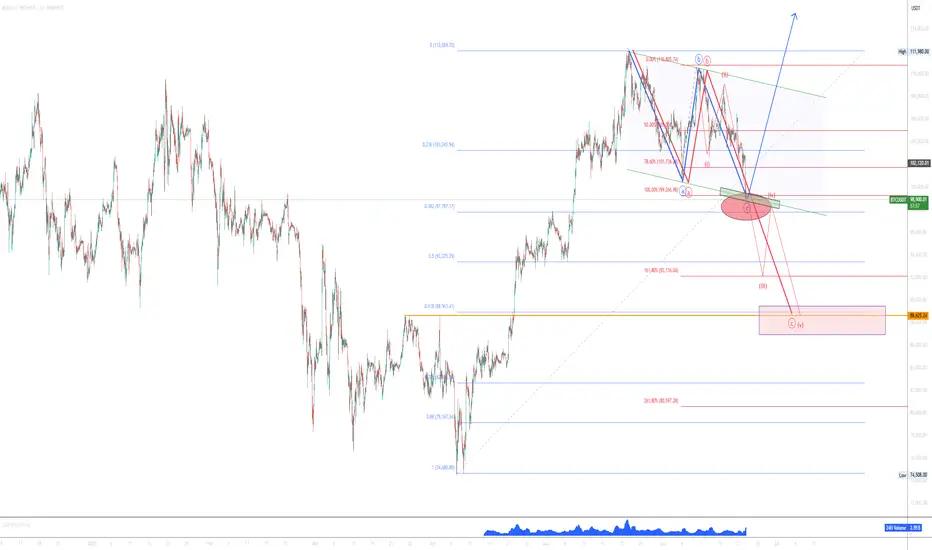
Red or Blue?Hi there!
Price is at crucial level, and we have two high probability scenarios.
We have parallel channel and Fibonacci extension 100% now and Clear Blue ABC. Some rejection can happen from here to the upside or this is it and trend continuation can start!
Red scenario is deeper ABC to the cluster level of previous HH and Fibonacci 61.8 level little under Fibonnaci extension 161.8!
Good luck traders
BTCUSDT.5S trade ideas
BTC - Key Battle Between Bulls and Bears – Symmetrical TriangleBitcoin ( BINANCE:BTCUSDT ) is currently consolidating within a Symmetrical Triangle , showing indecision among Bulls and Bears around the Support zone($104,380-$103,060) and just above the 50_SMA (Daily) .
From an Elliott Wave perspective, the current range may represent a WXY corrective structure . The market seems to be waiting for a breakout direction , potentially aiming to complete wave 5 after this correction.
The Monthly Pivot Point($103,300) and the presence of significant Cumulative Liquidation Leverage Zones (both Long and Short ) are key liquidity magnets to watch in the short term .
I expect Bitcoin to re-attack the Support zone($104,380-$103,060) AFTER breaking the lower line of the Symmetrical Triangle Pattern and decline to the targets I have outlined on the chart.
Note: Stop Loss: $106,703 = Worst Stop Loss(SL)
Please respect each other's ideas and express them politely if you agree or disagree.
Bitcoin Analyze (BTCUSDT), 1-hour time frame.
Be sure to follow the updated ideas.
Do not forget to put a Stop loss for your positions (For every position you want to open).
Please follow your strategy and updates; this is just my Idea, and I will gladly see your ideas in this post.
Please do not forget the ✅' like '✅ button 🙏😊 & Share it with your friends; thanks, and Trade safe.

23/06/25 Weekly OutlookLast weeks high: $108,948.76
Last weeks low: $103,569.91
Midpoint: $98,191.05
Last weeks chart is a clear reflection of what happens when there is a constant stream of bad news... Geo-political escalations, America becoming more involved in the Middle-east and the FED refusing to cut interest rates.
It's well known markets do not like uncertainty, and throughout the week more and more questions have been asked with very few answers. Risk-on assets have taken a hit generally and BTC is no different, especially over the weekend. This price action should be taken with a pinch of salt as the volume is never as high as it is during the week and often it paints a false picture of how the market really feels. The market makers ultimately are just, over the weekend they often aren't involved and so I think we will know more accurately how much of this geo-political escalation is priced in by the end of the trading day. How the SPX reacts will be important too.
The FED once again refused to cut interest rates, it's clear president Trump is not happy with this. The market could have done with a cut but that will have to wait.
So for Bitcoin it's been a tough week and I can't see this getting better immediately. Bearish price targets for me would be $97,000, the short term trend is clearly biased short until some solid support comes in or something drastic happens in the political world for good. This week is about survival and caution while looking for opportunities to present themselves without knife catching.
Good luck this week everybody!

BTC Loses Key Level — Will 100K Hold or Fold?Bitcoin has been locked in a range for the past 45 days, clinging above the critical psychological support at $100K. But cracks are starting to show…
Every bounce from the key level at $102,430 has been weakening — and now, for the first time, we’re breaking cleanly below it. Things are starting to tilt bearish.
So the question is…
⛏️ Will 100K be tested next?
🔍 Key Support Zone: $97.7K–$96.9K
Using the Fibonacci retracement from the swing low at $74.5K to the recent ATH, the 0.382 retracement lands at $97,655 — just below the $100K mark.
But there’s more…
Here’s why the zone between $97.7K and $96.9K is crucial:
0.382 Fibonacci retracement: A common pullback level in strong uptrends.
Anchored VWAP from $74.5K: Currently sitting around $96.9K, tracking cumulative volume-weighted average price — a key level.
Daily Order Block: Sits right at $96,887, aligning with the VWAP and reinforcing the area as demand-rich.
1.272 Fibonacci extension: From the previous move — providing another layer of confluence.
Fair Value Gap (FVG): The imbalance lies right in this zone. Price often fills these before continuing trend.
All of this stacks up to a high-probability long setup.
🕵️♂️ What to Do Now?
Set alerts at $100K and watch for a reaction. If price slices through, shift focus to the 0.382 Fib — monitor price action closely for signs of a reversal.
The first clean test of this zone could present a solid long — but as usual don’t trade blindly. Wait for confirmation.
_________________________________
💬 If you found this helpful, drop a like and comment!
Want breakdowns of other charts? Leave your requests below.

Good moment for try to Buy BTCGood moment for try to Buy BTC. A good triangle has formed. There are prerequisites for its upward breakout. Very good risk/reward ratio. Stop below the triangle. Let's see...
$BTCUSD: Bull or bear?Choose your adventure gents...
If price breaks up today, it can ignite a daily timeframe trend signal pointing to a rally towards 114k within a few days.
If it breaks down, it will hit 96k within the next two weeks.
I've taken steps to reduce risk but I still trade futures actively in crypto pairs. There's good alpha in my long/short trading system and screening criteria, so I am comfortable trading it actively.
Current techo/fundamental juncture is risky, the way I see it, so if you haven't, maybe consider taking some profits, getting rid of leverage, trailing stops higher, etc.
Definitely not a time to be complacent with record exposure to US stocks from the public and foreigners, Gold hitting levels where it can purchase the same $ in real estate as in previous tops (1980, 2011), and companies buying into crypto to pump their failing business' stocks...to name a few red flags. There's some merit in long term bullish variables, but we might face some technical difficulties before that can materialize, and I rather be prepared by reducing risk in my long term exposure and max drawdown tolerance variables in my positioning and general strategy.
Best of luck!
Cheers,
Ivan Labrie.

Bitcoin (BTC/USDT) – Bearish Continuation After Failed Support !Bitcoin attempted to hold the $101,409 support level but failed to sustain above it. The breakdown confirms weakness, and the chart now suggests a continuation of the downtrend if bulls don’t reclaim lost ground quickly.
Technical Breakdown:
Failed Bounce: BTC briefly bounced near $101.4K but got rejected and closed back below the zone.
Bearish Structure: Price continues forming lower highs and lower lows — a clear downtrend.
RSI at 30.34: Close to oversold but still room to fall, which means downside isn’t exhausted yet.
Market Sentiment: Weak hands are exiting, and support zones are getting tested faster than they’re defended.
Key Levels to Watch:
Resistance:
$101,409 – Immediate level, now flipped to resistance
$103,573 – Strong barrier if bulls attempt recovery
$105,807 – Major horizontal resistance and lower high zone
Support:
$97,340 – Next major support zone (possible short-term bounce)
$93,343 – Key level if $97.3K fails to hold
$92,200 – Final support before panic could set in
Trade Idea – Bearish Bias:
Short on Retest Zone: $101.4K – $102K
Stoploss: Above $103.6K
Take-Profit Targets:
TP1: $97,300
TP2: $93,300
TP3: Optional – trail lower if breakdown continues
What Bulls Need to Do:
Reclaim $101.4K fast with a strong close above it on the 4H chart
Otherwise, sellers remain in control
This is not financial advice. Always do your own research (DYOR) and manage your risk accordingly.

BTC ALL SET FOR ATH Price is forming a lower high and starting to roll over , this suggests bearish pressure is creeping in, Recent candles are showing smaller bodies and long wicks, indicating indecision and a potential slowdown in bullish momentum. BTC could test support zones 92,000 and show short term pull back but major trend is bullish from 84k zone , buckle up and watch it tightly.
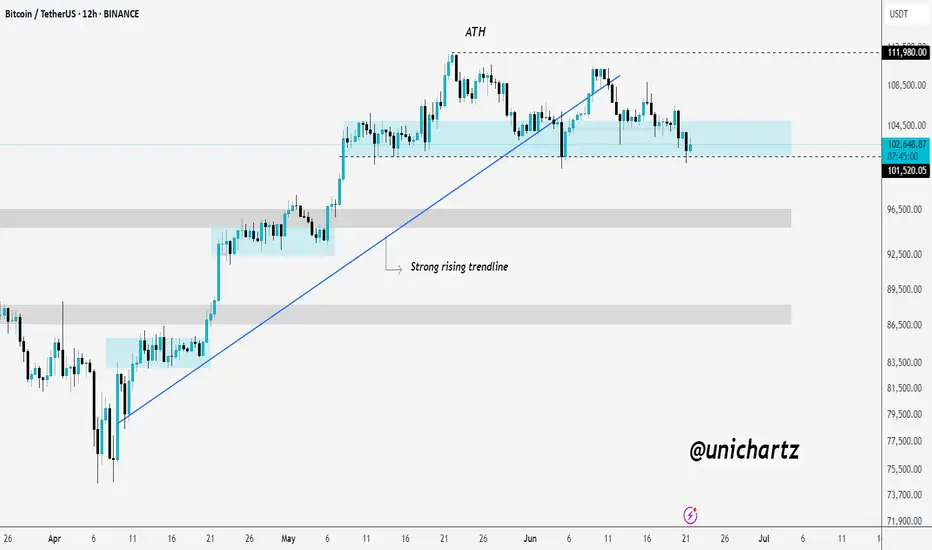
Support Tested: Can Bitcoin Withstand Global Fear?CRYPTOCAP:BTC is struggling to hold above the key support zone after losing its rising trendline.
This weakness comes as the Israel-Iran conflict intensifies, shaking global market confidence. While BTC has often acted as a hedge, rising geopolitical tension is pushing investors toward safety, causing hesitation even at critical support levels.
A breakdown here could trigger deeper downside.
DYOR, NFA
The Bull Run IS DONE! (For Now Anyway...)My bold declaration that price has reached it's all time high, has done enough buying and is now on sell-mode.

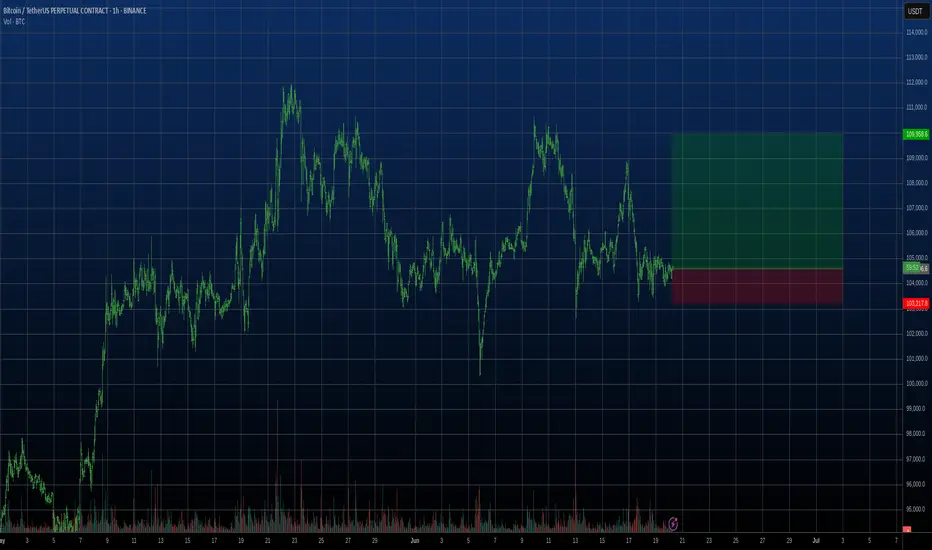
Bitcoin Expecting Relief moveBitcoin Poised for 109K
Bitcoin is showing resilience around the key psychological support level of 100K which appears to be holding firm despite recent volatility. The current price action reflects a complex consolidation pattern, but overall sentiment remains bullish, driven in part by ongoing geopolitical tensions that are boosting Bitcoin’s appeal as a safe-haven asset.
If this support holds, the structure suggests a potential move toward the next resistance level at 109K.
You may find more details in chart Ps Support with like and comments for more analysis.

Do you think I'm joking ???The price is currently forming the second corrective wave, and a slight price drop to reach higher levels is normal.
Best regards CobraVanguard.💚

BITCOINBINANCE:BTCUSDT.P Team bearish are not showing any signs of slowing down breaking every barriers. on these post i shared analysis on what i think that BTC is going to do next. All the best.

BTC ITS A TRAP Bitcoin is currently facing significant resistance at key technical levels and may be positioning for a potential sharp decline heading into Thursday, particularly as markets close and geopolitical tensions in the Middle East threaten to escalate.
Two key technical confluences support this thesis:
1. Bullish Gartley Harmonic Pattern: This setup is developing with highly precise ratio alignments, targeting a convergence at the Point of Control (POC) alongside multiple anchored VWAP levels. While the pattern typically involves a sharp decline, it often precedes a powerful reversal once liquidity is swept from the lows, making this a potentially attractive risk-reward inflection zone.
2. Failed Auction Structure: Price action has demonstrated an inability to sustain a breakout above the established fair value range, instead reverting back within the bounds of a parallel channel. This failed breakout—confirmed by a rejection at the upper end of the volume profile—suggests heightened probability of a move back toward fair value, marked in blue, which coincides with the POC and represents the market's most accepted / traded price.
We’ll observe how the setup develops from here.

Bitcoin Crash Predicted! Here are the next targets! Bitcoin is crashing as predicted, and here I am showing you the next targets, and the changes in market structure that would make me take profits earlier!
Enjoy and feel free to smash the rocket button if you feel the bearish vibe!

Bitcoin Poised to Reach 111500Bitcoin Poised to Reach 111500
Bitcoin faced a strong support zone for the second time during this month near 104K.
The pattern is taking a complex shape but overall remains supported by the Geopolitical situation as well.
During the last 5 hours BTC bounced from that zone showing a strong momentum and is poised to test the old structure zones again 107855 ; 108710 ;
The other important zones that may have more value are 110230 and 111500
You may find more details in the chart!
Thank you and Good Luck!
❤️PS: Please support with a like or comment if you find this analysis useful for your trading day❤️

BTC Approaching Key Confluence Zone: Pivot + PRZ + LiquidationsBitcoin ( BINANCE:BTCUSDT ) appears to have broken the Support lines and is currently declining .
In terms of Elliott Wave theory , Bitcoin appears to be completing a corrective wave C . The corrective wave structure is a Zigzag Correction(ABC/5-3-5) .
I expect Bitcoin to start rising again from the Support zone($104,380-$103,660) , Potential Reversal Zone(PRZ) , Cumulative Long Liquidation Leverage($104,471-$103,124) , Monthly Pivot Point , Support line , and 50_SMA(Daily) , and the small CME Gap($106,190-$106,150) will also fill.
Note: Stop Loss: $102,520
Please respect each other's ideas and express them politely if you agree or disagree.
Bitcoin Analyze (BTCUSDT), 1-hour time frame.
Be sure to follow the updated ideas.
Do not forget to put a Stop loss for your positions (For every position you want to open).
Please follow your strategy and updates; this is just my Idea, and I will gladly see your ideas in this post.
Please do not forget the ✅' like '✅ button 🙏😊 & Share it with your friends; thanks, and Trade safe.

The Nature of Zones — Reversals, Continuations, and the FlowWe’ve all heard trading terms like Major Trend and Major Counter-Trend levels. These are zones where price either breaks through and continues (Trend Levels) or sharply reverses (Counter-Trend Levels). In the crypto world, these levels are often separated by enormous gaps, due to the nature of the space — as I’ve mentioned in a previous idea: Crypto Charts Whisper—Are You Listening?
Let’s get one thing clear from the start. These levels are not just thin lines that traders casually draw across a chart. They are zones. So, as a skilled trader, anytime someone mentions support or resistance, keep in mind: interact with these as zones, not levels.
Why? The answer lies in the nature of the candlestick itself. Most support and resistance areas — 99% of the time — are defined by candlesticks such as inverted hammers, shooting stars, etc. For instance, in an uptrend near its peak, you’ll often spot an inverted hammer with a rejection wick that’s at least 25–50% of the candle’s body. The longer the wick, the stronger the rejection. In that sense, the high and the close of that candle form the zone. And what better tool to use for this than the rectangle?
Now, to slowly return to our main point — many of you might’ve noticed that zones often change their nature, especially resistance zones. If you’re experienced, you already know: price tends to go higher by nature. So when a counter-trend zone gets broken and price pushes above it, it shifts — it becomes a trend zone. Later, if price retests it from above, it often turns into support, and with another reversal, it can shift again — becoming a counter-trend zone once more.
But my point goes deeper than what you’ll hear in lessons or YouTube videos. Like I said in another post — A Follow-up to “Adjustments for Better Readings & VSA vs BTC” — if it’s already out there, it’s probably old news.
A skilled trader keeps an open mind — merging everything into one system. And it's part of this oneness mindset that elite traders follow, which I want to share now.
So I ask you:
What if the idea of trend and counter-trend zones didn’t just apply to major levels?
What if this concept applied everywhere on the chart?
For me, this isn’t just a question anymore — it’s a fact. A fact that made me a better trader. I won’t lie — before I got good at this, I failed over and over. But I never quit. That’s not the point though. The point is to expand your vision and train yourself to react just like the elite do.
Take double or triple tops/bottoms — standard or rounded. These formations also act exactly like trend and counter-trend zones. And they stay relevant well into the future. Every level is tested at least twice, from both directions. Maybe not immediately, but eventually — across multiple time frames.
And just like that, a level becomes a major zone for future use — especially if you trade across multiple time frames. So be careful: if you’re only looking at the 1-hour chart, you might miss something important that’s playing out on the 3-minute. And that can trigger psychological discomfort... leading to FOMO — and all the mistakes that come with it.
Also remember — double and triple tops/bottoms are zones, not exact lines. Many traders lose trades by a single tick, just because they forget that rule.
Let’s go a bit deeper now.
Think about all the small highs and lows that appear between those tops and bottoms on a 3-minute chart.
How can they help you trade better? The answer goes back to my previous idea: Location, Location, Location — Consistency and Alignment.
I get it — staying observant 24/7 is hard. That’s why institutions and big players work in teams, in shifts. They’re never alone. You shouldn’t be either.
There’s a lot more that could be said about these levels and zones — how they reveal future trend behavior, a flow! even without indicators or VSA. It has to do with how specific highs and lows behave at certain points in time... but let’s leave that for now.
For the outro, remember this:
The real edge isn’t in indicators.
It’s in your ability to catch the flow of price,
And to read strength or weakness through the simple structures within the zones Big Players create — whether visible or hidden.
A chart isn’t a single truth.
It’s a battlefield of conflicting zones and mixed signals.
If this mindset resonates with you and you want to go deeper — whether it’s building confidence or spotting hidden signals early — I work with a small circle of traders, sharing TA privately every day. Feel free to reach out.
Until next time, be well and trade wisely.
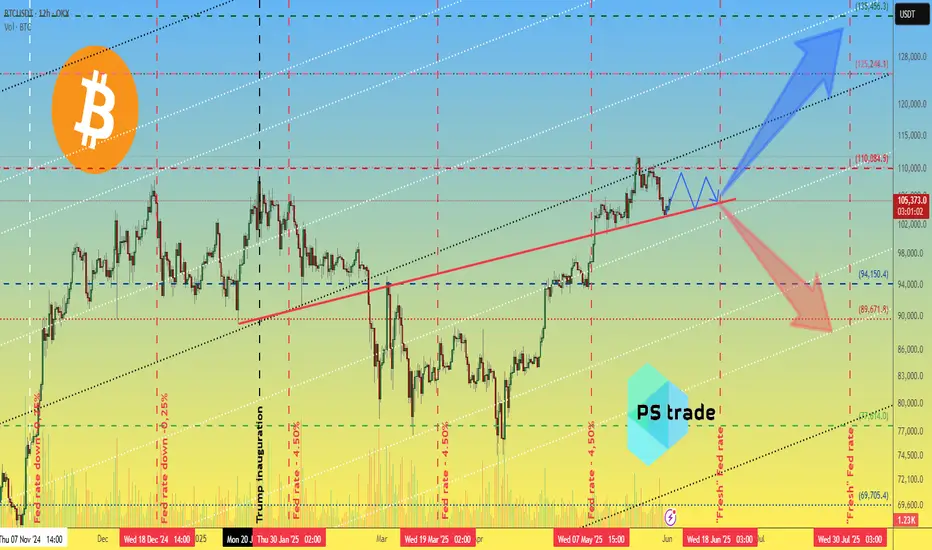
#Bitcoin Update - 19.06.2025🚨 #Bitcoin Update – 19.06.2025 🚨
For the first time after FOMC, Bitcoin is showing an unusual calm – and yes, that’s pretty strange, especially considering the ongoing tensions in the Middle East. But let's break it down clearly and from my point of view. 👇
🔹 Arrow #2 remains a crucial resistance level. Price *did* break above it, but there was no strong confirmation or momentum – it got rejected and pulled back.
🔸 Currently, Bitcoin is stuck in a range, moving between Arrow #2 and Arrow #4 (marked by black lines). This range-bound behavior might continue for a while unless we get a strong breakout.
🌟 Now, pay close attention to the yellow lines under Arrow #3 and Arrow #5 – these are key support zones. As long as these hold, bullish sentiment remains intact.
✅ Also, Arrow #6 (black line) is the last strong support – only if this breaks, we can start talking about a potential bearish move or at least a deeper retest.
📈 In my opinion, we might see another attempt to break the All-Time High (ATH) very soon. Price still looks bullish, and as long as we hold above Arrow #6, there’s no clear sign of weakness.
🎯 Summary:
* Market is calm but not dead.
* Still bullish unless Arrow #6 breaks.
* Range between Arrow #2 & Arrow #4 continues.
* Eyes on next ATH attempt! 🚀
🧠 Stay patient. Stay focused.
📊 Next up: ETH and Bitcoin Dominance analysis coming soon – make sure you follow so you don’t miss the update!
\#Crypto #BTC #Trading #BitcoinAnalysis #CryptoUpdate #BTCUSDT

[SeoVereign] Bitcoin Bearish Outlook – June 22, 2025We are the SeoVereign Trading Team.
With sharp insight and precise analysis, we regularly share trading ideas on Bitcoin and other major assets—always guided by structure, sentiment, and momentum.
🔔 Follow us to never miss a market update.
🚀 Boosts provide strong motivation and drive to the SeoVereign team.
--------------------------------------------------------------------------------------------------------
Currently, Bitcoin appears to have entered a downward phase based on the counting criteria. A movement breaking below the S1 support line has been detected, which I previously mentioned as a signal to consider a mid-to-short term bearish trend.
From a trend perspective, a bullish reversal has not yet occurred. The reason is that on the 20th, when the 105550 level was broken upward, a strong momentum-driven upward move did not follow. If a true trend reversal had occurred at that point, there should have been immediate strong buying pressure without a whipsaw movement after the breakout. However, the market quickly reversed downward, indicating that selling pressure still dominates.
At that point, I was preparing a long idea, but as the bearish trend became clear, I chose not to upload it. At the same time, the 1.414 butterfly pattern I personally developed was confirmed, further supporting the continuation of the downward trend.
As a result, I have continued to hold the Bitcoin short position that began with the idea on the 11th, and I plan to provide further analysis and idea updates as market movements unfold.
I wish you sound judgment in the market and continued good fortune.

BTC Flips Bullish Above $104k — 1D 50EMA & OB Cluster HoldCRYPTOCAP:BTC | #4h
Price reclaimed 1D 50EMA & $104k after a clean bounce from 1D FVG ($98k).
As long as $104k and the 4h OB cluster hold, lower targets are off the table.
Maintaining bullish bias toward $106k+.
Lose $104k? Bull plan is invalid, reassess for lower.

How Bitcoin can impact alt coins like sol and sui This video is a very quick update on the potential for bitcoin to drop into the 96/97k region and the effect it will have on alt coins .
If you hold altcoins and you see them bleed in price then its important to know and understand whats ahead for Bitcoin .
Understanding this will help you with your entry's and your exits on all altcoins .

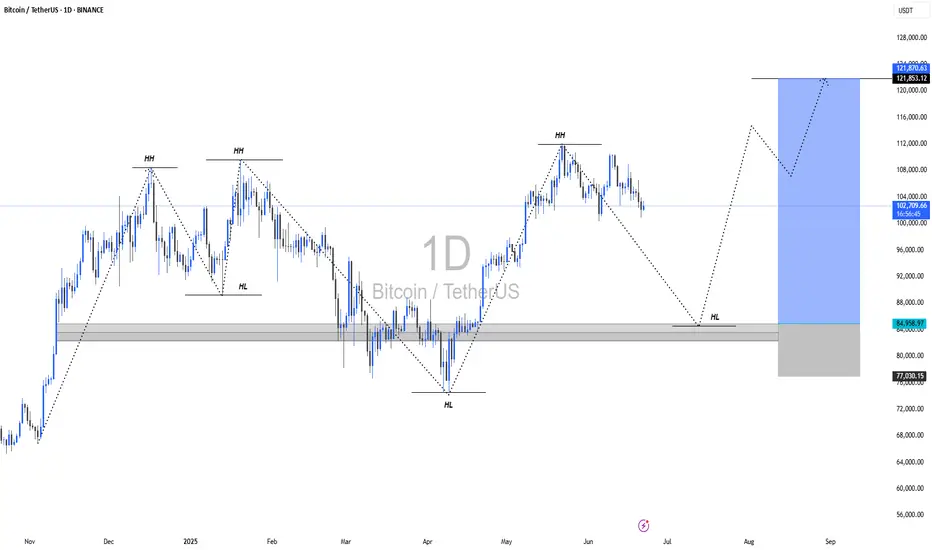
Bitcoin BTC price analysis🍿 At the OKX:BTCUSDT chart, we show one of the scenarios that could play out in the first half of June.
Much will be decided today with the opening of the US market. It is very likely that there will be a downward movement at the opening in response to the new tariffs announced by Trump on Friday after the markets closed.
🕯 Well, then we'll have to “keep our fingers crossed” that market players show their strength and hold on and buy back the drop — like say: we're tired of shaking with every crazy statement from Trump.
💰 If the price of CRYPTOCAP:BTC stays above $103k, there is a chance that it will be “stuck” in the $103-110k consolidation. The market needs to digest and redistribute the results of two months of #BTCUSD price growth from $75k to $112k.
And considering the position of the BTC.D and USDT.D indices, there is a chance that the “little bit” of capital will pass to the altcoins, and they will shoot up a little.
⁉️ Probably, the safest thing to do would be to watch the altcoins and buy only those that have started a significant upward movement with volume.
What do you think?