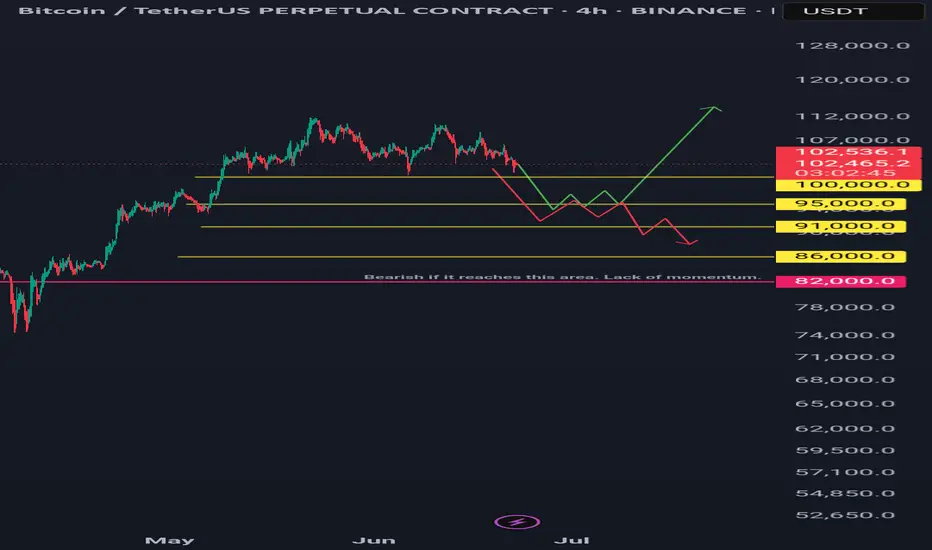
BTC at the Crossroads — $91k Demand or Deeper Flush to $76k?🎯 BINANCE:BTCUSDT Trading Plan:
Scenario 1 — Bullish Reclaim:
If price reclaims 1D 50EMA and $104k, bias flips bullish; look for continuation toward ATHs
Scenario 2 — Base Case (Favored):
Remain patient for a move to $91k–$92k; swing-long setup on signs of strength or iH&S formation
If $91k–$92k holds, expect a summer rally and new ATHs later in 2025
Scenario 3 — Breakdown:
If $91k fails, prepare for deeper move to $73k–$76k; this is the “max long” zone if tested
Must hold here; below $73k–$76k, next support is $55k
🔔 Triggers & Confirmations:
Long only above $104k + 1D 50EMA, or after bullish structure at $91k–$92k
Major long only on strong support at $76k, with clear confirmation
📝 Order Placement & Management:
Buy: On reclaim of $104k (trend confirmation) or at $91k–$92k with iH&S/reversal pattern
Backup Buy: If $76k is tagged with confirmation
Stops: Under $91k or $73k (based on entry)
Targets: New ATHs for late 2025
🚨 Risk Warning:
Losing $91k opens path to $76k; losing $76k is a major structure break
Don’t knife-catch — wait for confirmation at each level
BTCUSDT.5S trade ideas

Can #BTC continue to rise?📊Can #BTC continue to rise?
🧠From a structural perspective, we started to rebound after being very close to the ideal target area of the bearish cup-handle structure, and broke through the downward trend line, which means that the correction phase is over.
➡️So next we need to pay attention to the long trading opportunities after the pullback. At present, this position belongs to the contradictory range. It can continue to rise, but it will be very uncomfortable if we chase the rise. So wait patiently for trading opportunities after the pullback. We can pay attention to the neckline support area (102000-103000).
➡️If there is no pullback, but it continues to rise, then the resistance near 106500 is also worth our attention. This is the support-resistance conversion area that has been tested many times.
🤜If you like my analysis, please like 💖 and share 💬
BITGET:BTCUSDT.P

Btcusdt 4hr tf scenarios.Two scenarios: green and red lines.
Green Line: A bounce and sustained recovery above the 100-day and 200-day daily moving averages is bullish.
Red Line: A bounce followed by a lack of momentum and a break below a previous low is bearish.
Long Horizontal Red Line: If the price reaches this area, it could signal the start of a downtrend unless new bullish fundamentals emerge.
My Point of View (POV): I am bearish, primarily due to the ongoing war, similar to the conflict that began between two other countries a year ago.
However, it's important to note that every crisis and recession has historically presented a buying opportunity for institutions and 'whales.' Therefore, be prepared with funds for dollar-cost averaging (DCA), then simply hold and forget. It is recommended to conduct backtesting and research to identify optimal buying areas. DCA is key. Only invest money you can afford to lose.
BTCUSDT Short Setup at Fresh Supply ZoneBTCUSDT is currently trading near $102,397, approaching a clean supply zone between $102,887 – $104,030, where strong historical rejection has occurred.
A short entry around $102,887 offers a high-probability setup with a stop above the zone at $104,030, targeting $98,780 as the take profit level. This aligns with a previous demand structure and offers an excellent Risk:Reward ratio of approximately 1:3.6.
Trade Setup:
- Entry: $102,887
- Stop Loss: $104,030
- Take Profit: $98,780
- Risk:Reward Ratio: ~1:3.6
This setup expects sellers to defend the supply zone, rejecting bullish attempts and triggering a downward move.

Bitcoin to revisit $100k | Summer price target = $120kGeopolitical tension is causing fear in the markets. Today, Bitcoin fell from $107.7k to current price $105k with no sign of buyer support whatsoever, printing 11 consecutive H1 red candles intraday. Like a hot knife through butter.
At $105k, there is very little support. Sell volume absolutely overshadowed the tiny buy volume. Bulls have yet to close a green candle. I believe in the next few hours Bitcoin will be trading at $104k, followed by the first stop $102k.
$102k can serve as an entry point, depending on how price reacts. $100k is the optimal entry point for maximum profit, after mass liquidations. Retail traders are confident that the liquidity hunt is over after the initial tap, placing stops and liquidation levels at $100k.
Invalidation level will be beyond the 200SMA. The 200SMA have historically proven itself time and time again as a safe zone during rallies after golden crosses.

Bitcoin BTC price analysis🍿 At the OKX:BTCUSDT chart, we show one of the scenarios that could play out in the first half of June.
Much will be decided today with the opening of the US market. It is very likely that there will be a downward movement at the opening in response to the new tariffs announced by Trump on Friday after the markets closed.
🕯 Well, then we'll have to “keep our fingers crossed” that market players show their strength and hold on and buy back the drop — like say: we're tired of shaking with every crazy statement from Trump.
💰 If the price of CRYPTOCAP:BTC stays above $103k, there is a chance that it will be “stuck” in the $103-110k consolidation. The market needs to digest and redistribute the results of two months of #BTCUSD price growth from $75k to $112k.
And considering the position of the BTC.D and USDT.D indices, there is a chance that the “little bit” of capital will pass to the altcoins, and they will shoot up a little.
⁉️ Probably, the safest thing to do would be to watch the altcoins and buy only those that have started a significant upward movement with volume.
What do you think?
BTC - Continuation of Bull Trap 21.06.2025Hello Friday! Never, ever, ever trade crypto on weekend, but let's hop in!
🔻 What I expect more? Continuation of Bull Trap! (Probability 70/30)
Few Reasons:
Price broke 20 EMA(daily) and is sliding just above the 50 EMA with "dead-cat" bounce attempts.
RSI is going down below 50 — momeentuum is faaadiing.
No signs of some big demand at this level (low volume on small green candles + Iran uncertainty).
Notable, that we are far from any bounce move (which would support re-accumulation).
Scenario 1: Bearish Continuation (Most likely)
Expecting BTC to test the 99.5k zone — this is the key support level becasue of several arguments:
1) 0.886 Fib
2) Confluence with previous horizontal range support
3) 100 EMA
4) Under psychological level 100k
5) RSI needs to cool off before taking higher targets.
If 99.5k broken, next stop is near 88.5k (0.786 Fib)
I wouldn't like to analyse further possible downslide of BTC, so lets stay so far in already negative scenario within 88.5k, but let's keep in mind, that maximum pain we will see near 75k zone.
🟡 Alternative: Short-term Bounce (Probability 30/70)
BTC could attempt bounce towards 105–106.5k (retest of broken structure + 20 EMA resistance)
If this bounce has low volume and rejection near EMAs or RSI stays below 50 , it's a sell opportunity — not a bullish reversal.
✅ Final thoughts for short term: stay away from the market.
From 103.5k I would expect downward continuation toward 99.5k with possible minor bounce attempts along the way.
Wait for strong reversal signal near 100k and enter LONG with tight SL.
Don't trade during the weekend, unless there's a once in a lifetime opportunity.
Have fun!

BTCUSD next target releasedNo comment needed. All information is in the chart analysis.
Steps to follow:
Analyze yourself.
Take the position with SL and Take Profits.
Wait, it may take a couple of days, so take a break and step away from the screen from time to time, just like I do :)
Get the result.
I will update the trade every day.
Like, comment with your good mood or viewpoint, share with your circle. It’s together that we get stronger!
Good trades, Traders!
The golden bear

Today's BTC trading strategy, I hope it will be helpful to youToday, Bitcoin's price is like a ball caught between two forces, swaying around $103,300. On one side, the Fed just said "let's wait and see" (latest report states the impact of tariffs is uncertain, so no hurry to cut rates), putting a temporary brake on leveraged crypto speculators. On the other side, Middle East tensions are on a rollercoaster—Israel and Iran alternate between clashes and talks, but Iran's move to accept Bitcoin for oil purchases has put a floor under prices. Right now, the market feels like a spring compressed too far: $103,000 acts as a strong support (like a sofa cushion), while $107,000 looms as a ceiling, likely confining short-term moves to this range.
Recent Price Dynamics
The $103,000 level has emerged as a critical support zone, functioning like an "invisible mattress" for prices. During recent volatility, prices repeatedly rebounded when testing this level, indicating many investors view it as a relative low—willing to absorb selling pressure here. For example, on June 13, when Bitcoin fell due to Middle East tensions, it quickly bounced after hitting a low of $102,614, confirming the support at $103,000.
Today's BTC trading strategy, I hope it will be helpful to you
BTCUSDT BUY@102000~103000
SL:101000
TP:105000~106000

BTC/USDT Smart Money Roadmap | Daily FVG + ATH TargetSeenForex | ICT-Based Smart Money Analysis
Bitcoin is currently reacting within a Daily Weak Fair Value Gap (WFVG) after a series of liquidity sweeps ($$$). Price structure suggests two possible scenarios:
✅ Bullish Continuation Setup:
Daily WFVG acting as potential mitigation zone
Targeting ATH liquidity above $112,000
Confirmation required: bullish BOS or entry model near FVG
🔄 Bearish Liquidity Sweep Scenario:
Deeper liquidity draw possible below WFVG
Next potential demand zone around $85,000–$87,000
Clean inefficiency (FVG) below waiting to be filled
🧠 Wait for price reaction inside WFVG or deeper zone before taking action.
📊 Strategy Used:
ICT | Smart Money | Liquidity Sweep | Order Block | BOS | FVG
📅 Date: June 19, 2025
🔍 Analyst: SeenForex
#BTC #Bitcoin #BTCUSDT #SmartMoney #ICT #FVG #Liquidity #TechnicalAnalysis #CryptoTrading #SeenForex #OrderBlock #TradingViewIdeas

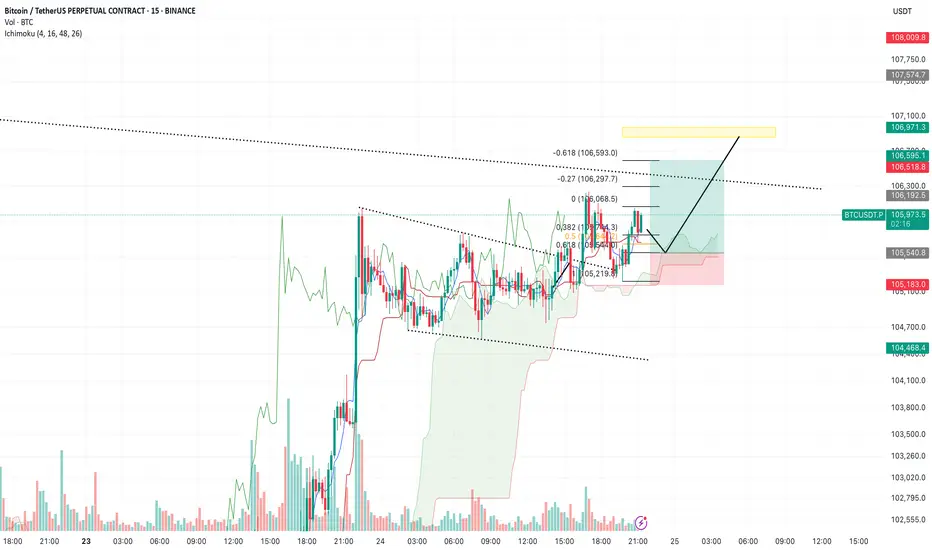
BTC/USDT – Update & New Plan (15m, Ichimoku)Previous idea recap:
Bulls proved stronger than expected — we didn’t get the move down to 104,000 as anticipated. Instead, price rallied directly to the 106,300 block, as outlined earlier, and saw only a brief pullback.
Current outlook:
Buyers remain in control here. My new base case is a move towards 106,900 (yellow liquidity block). Ideally, I’d like to see a quick dip to the 105,550 area first, which would set up a strong launch for the next leg higher into the key liquidity zone.
Watching how price reacts on minor pullbacks — still expecting buyers to step in and push us to 106,900 where significant liquidity is stacked.
Key levels:
Minor support: 105,550
Main target: 106,900 (yellow block)
Bulls remain in control above 105,550
Will update if conditions change.
How to Tell BITCOIN is BULLISH using MOVING AVERAGES OnlyBTC is trading sideways and it sparks a lot of debate whether or not we are at the beginning of a new bearish cycle, or if there is still a push upwards waiting to happen.
Here's how you can use the Moving Averages to determine whether or not BTC is bullish.
Don't miss this update on my stance on the market and why I think ALT Season is waiting:
______________________
BINANCE:BTCUSDT

Bitcoin BTC Pullback Strategy: How I’m Planning My Next EntryI’m currently watching BTCUSDT 👀. Yesterday, we saw a bullish break of structure 🔼, and my bias is to follow that momentum moving forward 📈. Right now, price is overextended 📊, so I’m looking for a retracement into equilibrium, ideally around the 50–61.8% Fibonacci zone 📏.
If price pulls back into that range and holds above the bullish imbalance (discussed in the video) 🧱, I’ll be watching for a long opportunity 🎯. My targets are set at the previous highs and the Fibonacci extension levels 🔝.
⚠️ Disclaimer
This is not financial advice. Trading involves risk, and you should only trade with capital you can afford to lose. Always do your own analysis or consult a qualified financial advisor.

Possible next scenario from BTCTakes Monday's high, traders get too excited.
Followed by a strong H1 candle close back inside Monday's range (trigger)
Aim for the H12 inside candle consolidation (and value area low of last week)

The Pattern That Could Launch BitcoinSpotted a long-term inverted head & shoulders pattern forming over a 7–8 month stretch on Bitcoin — much more reliable than short-term setups. If this bullish structure plays out, we could be looking at a breakout that pushes BTC firmly into price discovery.
I’ve included local Fibonacci levels on the chart, though I couldn’t fit the macro one (going from $4k → $69k → $15k — the 1.618 extension of that larger swing lands at $119,800. That could be a key resistance target if we clear the ATH and continue the uptrend. After that, there's the smaller timeframe, but more recent, fib ext 1.618 sitting at $131k.
I'd be very cautious of a failed pattern if $101k doesn't hold. As a last support, 95k and the red 20EMA might hold.
Let’s see how this plays out 🚀

Breakdown: BTC/USDT 15m – Riding the Trend
🔹 Smart Money Confluences:
CHoCH at the bottom with a clear liquidity sweep (LL formed, then reversal)
Multiple FVGs aligned with structure—price keep respecting mitigation blocks
POI + OB near $99,800 gave the final long confirmation
BOS and strong HHs show clean bullish order flow
🟩 Premium/Discount Zones:
You entered at da discount, targeting premium—textbook ICT
Midline equilibrium held nicely before bullish continuation.
💡 Final Push:
Price is consolidating under weak high and buy-side imbalance.
Possible continuation if new FVG near $105k holds
🔔 Watch for:
Higher timeframe liquidity grab above $106k
Rejection near inefficiency = potential partial TP zone
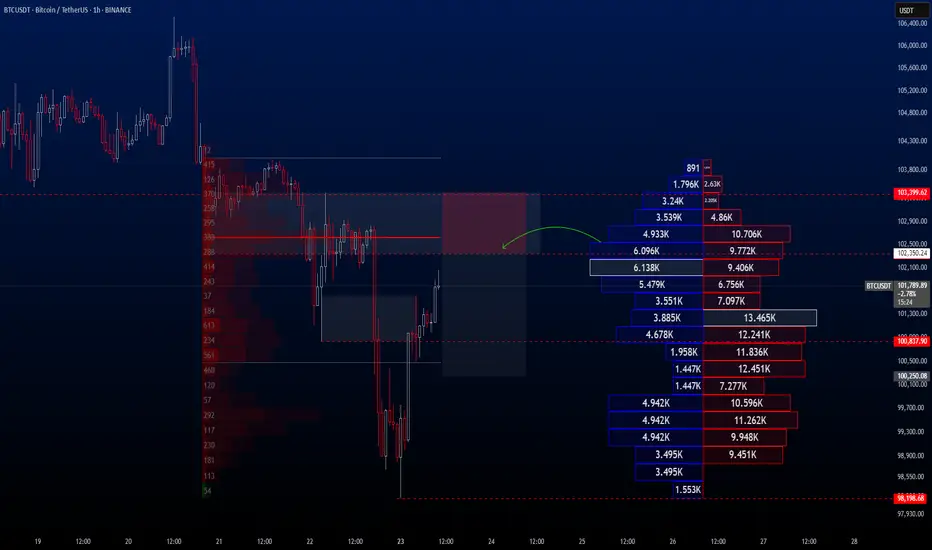
BTCUSDT Hello traders.
The BTCUSDT trade I shared the other day played out just as expected, with BTC experiencing a significant drop in value shortly after. The price fell all the way down to the 98K level.
Following this decline, I anticipate a short-term rebound toward the 102K–103K range, after which I expect the downtrend to resume. Therefore, I’ve placed a Sell Limit order at 102,350, and I’m currently waiting for the price to reach that level.
If you'd like, you can consider this opportunity in the same way.
🔍 Trade Details
✔️ Timeframe: 1-Hour
✔️ Risk-to-Reward Ratio: 1:2
✔️ Trade Direction: Sell Limit
✔️ Entry Price: 102,350.24
✔️ Take Profit: 100,250.08
✔️ Stop Loss: 103,399.62
🕒 If the trade doesn’t gain strong momentum, I will keep the position open only until 23:00 (UTC+4) today. Otherwise, I will manually close the trade—either in profit or at a loss—depending on price action.
🔔 Disclaimer: This is not financial advice. I’m simply sharing a trade I’ve taken based on my personal trading system, strictly for educational and illustrative purposes.
📌 Interested in a systematic, data-driven trading approach?
💡 Follow the page and turn on notifications to stay updated on future trade setups and advanced market insights.
BTCUSDT Technical Outlook TC is trading at $106k , with resistance confirmed near $106.14k–$106.22k and support at $104.8k .
A daily drop below $104.8k would confirm a short setup. Conversely, a break above $106.2k on elevated volume is required to challenge the $107k–$108k zone.
Absent significant volume, expect continued sideways action between $105k–$106k.

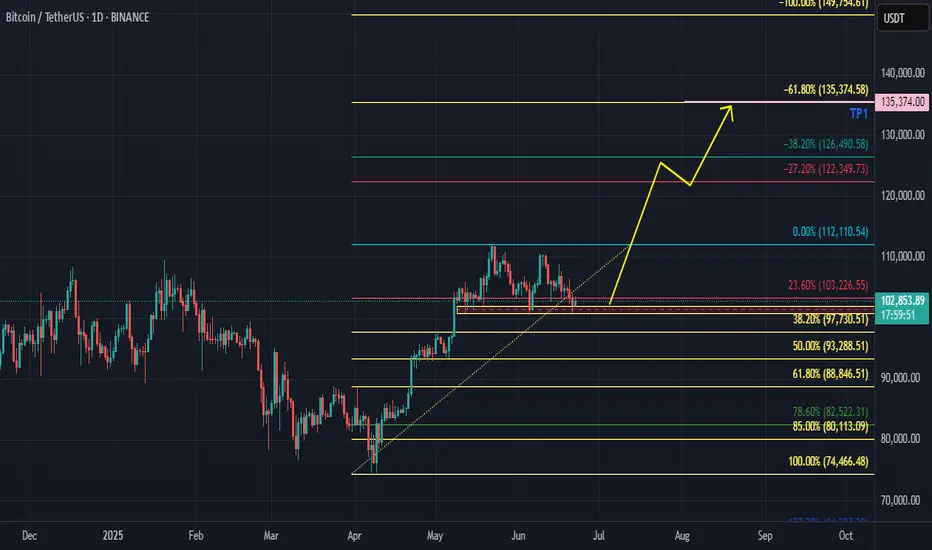
BTCUSDT Daily 22th JunI have drawn Fibonacci Retracement and specified TP 135k$. I think BTC would may bullish.
We PREDICTED correction, and here is the NEXT step⚡️ Hello, everyone! As I said in my previous ideas, the correction is just beginning. Some people link this to the hostilities in the Middle East.
But, in reality, this is just a way to find a reason. In fact, the charts have long predicted a correction, which I have been actively talking about for the last month.
📊 Let's take a look at what lies ahead:
Having gathered liquidity below 100k, we are now seeing a short-term rebound. For me, the maximum target for this rebound is 106,000-107,000.
We have started to close the GAP at levels of 102,760 - 97,400. I expect it to close completely, after which we can move into a range. The next GAP is at levels of 93,280 - 85,230. So the further direction of movement is also obvious. After all, in 99% of cases, gaps close sooner or later.
⚙️ Metrics and indicators:
Money Flow - liquidity has been declining for more than half a year. This updated ATH was accompanied by a significantly smaller inflow of capital and formed a divergence. This means that there is still no new liquidity in Bitcoin, and for it to move higher, a new catalyst and cheaper prices are needed.
Liquidity Depth - as we know, the price tends to move from one liquidity zone to another. And now, there is significantly more liquidity at the bottom than at the top.
Dynamic Support/Resistance - Currently, 99,890 is a strong support level. However, each time we move lower below it. So I am confident that this level will be broken in the near future. The next major support level is 91,460.
Volume - is another indicator of the lack of new liquidity in Bitcoin. Since November 2024, purchase volumes have continued to decline!
📌 Conclusion:
I don't expect us to see Bitcoin at 60,000 before the fall. But 80,000 by September is quite possible. The fact that we will probably test the 90,000 level is not even up for discussion. Unless, of course, a new bullish catalyst appears. Altcoin ETFs are not even close to being one.
So, for now, I advise everyone to be patient and not try to predict the bottom. Prepare your bags for spot purchases, sit back in your chair, and enjoy the show!
🔥 Have a great week, everyone! 🔥

Market SIGNALS SHOW THAT BTC CAN FALL TO 85K USDMarket follow-up study shows that there is a good chance BTC can fall to 85K in the coming time period. The market cycle seems to end the green trend and to enter a new red zone.
Time will show what really can happen with BTC.
The market can make a fake trend, with a trend fall on a high time frame.
The crash can also happen on the main markets.
This is not trading advice, trade always only depending on your plan.

Potential Long Setup on BTC After Fakeout and V-Shaped Recovery🟢 Potential Long Setup on BTC After Fakeout and V-Shaped Recovery
After the fake breakdown around $101,116 and a strong V-shaped recovery, Bitcoin is showing signs of strength. If $105,771 breaks to the upside, a long entry with a stop at $104,579.8 could be a solid setup.
Keep in mind:
This long position should be taken with the bigger picture in mind — if BTC breaks $110,246.8, it might be much harder to catch a position then. So it's wise to already be in the market.
📌 Important note:
Don’t take heavy risk just yet. Skip taking profit (TP) on this one for now, but size your position cautiously. If the market confirms a trend later, you'll have more room to enter altcoins with higher conviction.
---
💬 What’s your take on this V-recovery? Are you entering early or waiting for more confirmation? Let me know in the comments!

The Bull Run IS DONE! (For Now Anyway...)My bold declaration that price has reached it's all time high, has done enough buying and is now on sell-mode.
