BTC is expected to give move by mid or end of July 2025BTC is expected to make a move by mid or end of July 2025
BTC is forming a Bullish Flag Pattern, and it is expected to give a breakout from this flag, by mid or end of July.
BTCUSDT.5S trade ideas

Today's BTC trading strategy, I hope it will be helpful to youBitcoin prices hovered around $103,300, retreating from the $104,000 threshold seen in previous days and showing an overall volatile adjustment trend. The market has experienced a notable correction recently, with prices dropping significantly from earlier highs, but currently stabilizing around $103,000. Such fluctuations have left many investors confused about the price trend ahead.
Support and Resistance Levels
Technically, Bitcoin is facing key support and resistance levels. The lower support at $102,300 is critical: if prices hold above this level, the short-term decline may halt or even rebound. However, a break below this support could lead to further declines to test lower levels.
The upper resistance lies in the $107,000–$108,000 range, acting as a "wall" where prices have repeatedly stalled due to trapped positions and profit-taking pressure. For prices to continue rising, a successful breakout of this resistance zone is essential.
Technical Indicator Performance
Multiple technical indicators show bearish dominance in the market. Both MACD and RSI indicators signal bearish sentiment, implying short-term weakness may persist. Notably, prices are approaching oversold territory—similar to a spring compressed too far, Bitcoin may experience a technical rebound if the decline continues.
Today's BTC trading strategy, I hope it will be helpful to you
BTCUSDT BUY@102000~103000
SL:101000
TP:105000~106000

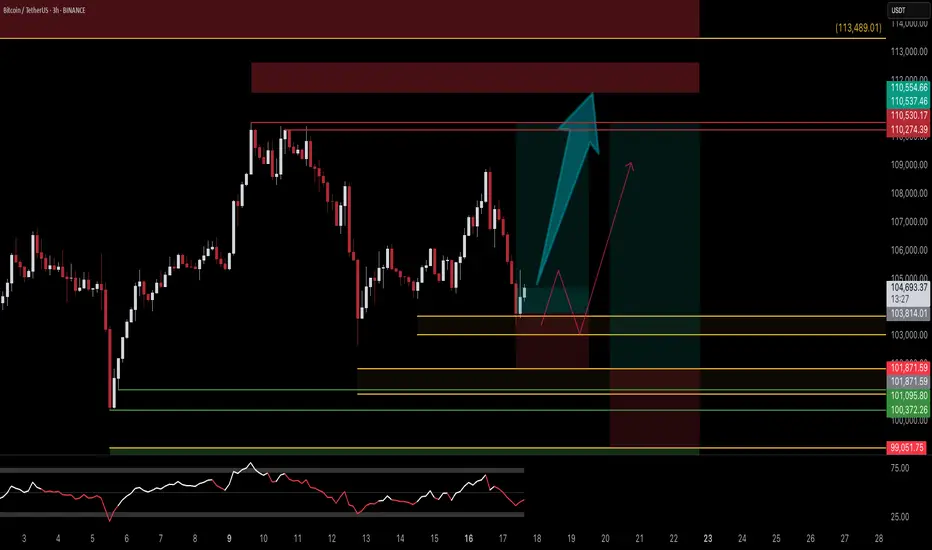
Trade Plan Update #12: Navigating BTC’s Critical Levels
*Conflicting timeframes (bullish 1H/Daily vs. bearish 4H/Weekly) are causing choppy price action. Here’s my 2-step game plan: *
📈 Scenario 1: Bullish 1H Play
Key Support Zone: $100,314 - $102,000 (last line of defense for 1H bullish structure).
Trigger: A strong rejection + bullish reversal signal in this zone.
Action: INSTANT LONG ENTRY. No waiting—aggressively capitalize on momentum.
📉 Scenario 2: Daily Structure Fallback
If $100,314 fails:
1- First Demand Zone: $93,300 - $98,000
Watch for a strong bounce → Go long if momentum confirms.
Weak reaction? Hold and monitor lower.
Second Demand Zone: $84,000 - $88,000
Ideal reversal zone for resuming the bull run.
LONG on confirmed strength.
Bull Run Lifeline: $74,600
Non-negotiable: A daily close below this invalidates the bull trend.
✅ Key Reminders:
Patience is strategy: Only act when price confirms your thesis (no guessing!).
Risk first: Define stops for every entry.
Watch price action—NOT hopes.
👇 What’s your take?
Which scenario seems more likely?
Are you adding any key levels?
Let’s discuss below! 👀

BTCUSD TO FALLBACK TO $100kFrom the technical perspective, btcusd seems quite bearish from the H4 perspective. We recently saw a continuous printing of lower highs therefore we expect a formation of new low around the $100,400 price level. A sell opportunity is envisaged.
DeGRAM | BTCUSD rebound from the demand zone📊 Technical Analysis
● The BTCUSDT 4-hour chart on KUCOIN highlights a pronounced descending channel, with price action recently rebounding from a well-defined demand zone between 98,000 and 100,000. This green-shaded area has repeatedly acted as a springboard for bullish reversals, as evidenced by the strong wick and immediate recovery after the latest test. The chart also marks a series of lower highs and lower lows, but the most recent price action shows a break in bearish momentum, with a projected zigzag path indicating a potential move toward the 104,970 resistance. The confluence of the lower channel boundary and the demand zone suggests that buyers are stepping in aggressively at these levels, aiming for a retest of the upper resistance band.
● The technical setup is further reinforced by the presence of a major resistance level at 111,977, which has capped previous rallies. The chart’s structure, with its clear trendlines and highlighted resistance and support zones, points to a tactical opportunity for bulls to capitalize on the oversold conditions. The anticipated path, as drawn on the chart, suggests a gradual recovery with intermittent pullbacks, targeting the 104,970 area as the next significant hurdle. The overall pattern indicates that while the broader trend remains bearish, the immediate outlook favors a corrective rally from the current demand zone.
💡 Fundamental Analysis
● Recent fundamentals support the technical case for a short-term recovery. Over the past two days, Bitcoin has experienced heightened volatility due to escalating geopolitical tensions, notably US military action in the Middle East, which triggered a sharp sell-off and flushed out leveraged positions. Despite this, institutional accumulation remains robust, with over $1.2 billion in Bitcoin added to corporate treasuries in the last week, and Texas officially establishing a state-managed Bitcoin reserve. On-chain data shows sustained negative netflows from exchanges, indicating that large holders are moving coins to cold storage, a historically bullish signal. Meanwhile, derivatives data reveals a cautious market, with open interest skewed toward protective puts, but spot ETF inflows and long-term adoption trends continue to underpin the market.
✨ Summary
● BTCUSDT is rebounding from a key demand zone, with technicals pointing to a corrective move toward 104,970. The bullish scenario is supported by strong institutional accumulation and strategic adoption, even as short-term volatility persists. A sustained close above 104,970 would open the path to the 111,977 resistance, while a drop below 98,000 would invalidate the recovery thesis.
-------------------
Share your opinion in the comments and support the idea with a like. Thanks for your support!

Bitcoin Holding Above $100K – Bullish Bias IntactIn my previous analysis, I mentioned that a daily close below $100K would trigger a short bias. However, price closed above the $100K level, sweeping liquidity and rejecting the downside.
This move invalidates the bearish setup and confirms a bullish continuation. Market structure remains intact, and we're now looking for potential long setups on retests or pullbacks.
Key Points:
Liquidity sweep below $100K
Daily close above key support
Bullish structure remains valid
Watching for continuation targets and retests
📍 Stay patient and follow price action. Structure never lies.
#BTCUSD #Bitcoin #CryptoAnalysis #LiquiditySweep #BullishContinuation #PriceAction #TechnicalAnalysis #TradingView #CryptoTA

June 12, 2025 Historical Comparison Analysis [Wave Analysis]No one knows tomorrow but what if???
Here, we have a historical comparison between December 07, 2020 to June 13, 2022, and January 22, 2024 to present day.
December 07, 2020 to November 08, 2021:
• Uptrend
• Flag (retracement)
• Uptrend continuation
• Range
• Downtrend
• Range (W or Double bottom pattern)
• Uptrend
• Flag (retracement)
• Uptrend continuation
November 08, 2021 to June 13, 2022:
• Downtrend
• Flag (retracement)
• Downtrend continuation
January 22, 2024 to May 19, 2025:
• Uptrend
• Flag (retracement)
• Uptrend continuation
• Range
• Downtrend
• Range (W or Double bottom pattern)
• Uptrend
May 19, 2025 to present day:
• .......
JUST WHAT IF HISTORY REPEATS ITSELF

BITCOIN TO 193000!!!!EVERYONE IS WRONG!it has been 5 years that i have been studying the btc and linkusdt cycles, and what i know is that a bull market is coming this summer, starting in july—maybe on the 4th or 7th.

Bitcoin (BTCUSDT) - Price Testing Resistance after Morning StarBitcoin (BTCUSDT) price is currently testing the resistance zone of $105,000 to $110,000 (yellow lines).
A morning star candle pattern has formed above the 100 ema (orange line), which is also $100,000 price support.
Some bullish momentum is forming on the MACD Histogram, however, Bitcoin is still technically in a short-term downtrend for the past 30 days.
Bitcoin price needs to create a new uptrend on the daily chart, a series of higher-highs and higher-lows in the price, which could take several months.
At this time, Bitcoin is still reacting to global news and stock market correlations.

Little market update on btc 23/07/25. hope you enjoycheers just a quick one yo update people on my current thoughts on btc

Bitcoin | Long | 3hrsThis technical analysis is for informational and educational purposes only. It does not constitute financial advice. Remember to always research and consult with a professional before making investment decisions. Good luck! 📈💼🚀
Bitcoin Crash To $93k Incoming?!!!!I am discussing the bearish signs i am seeing right now on Bitcoin, and talking about the confirmations I want to see, that will confirm that Bitcoin is about to crash down to 93k!!!

bitcoin update btc struggling to hold the 100k position market is choppy in lower tf but on higher tf its clearly shows sign of tapping below. with a double top on 3d tf, and breaking down of it will push long term holder book profits and with increasing tension in iran and usa 90k looks good support and as i mentioned previously about the cme gap in that area which works asa magnet for btc.
thanks
Measured move target madePrice bounced near the target and has been confirmed by the 4 hour SAR.
The 4 hour SAR is currently on a bearish retrace relative to the daily SAR.
As long as the Daily SAR is above price, the bearish Wolfewave is still in play.
Price is anticipated to go lower than what the 4 hour SAR has established as support.
To see more details and for faster movement, we look to the shorter intervals.
Shorter interval price action could invalidate longer interval patterns.

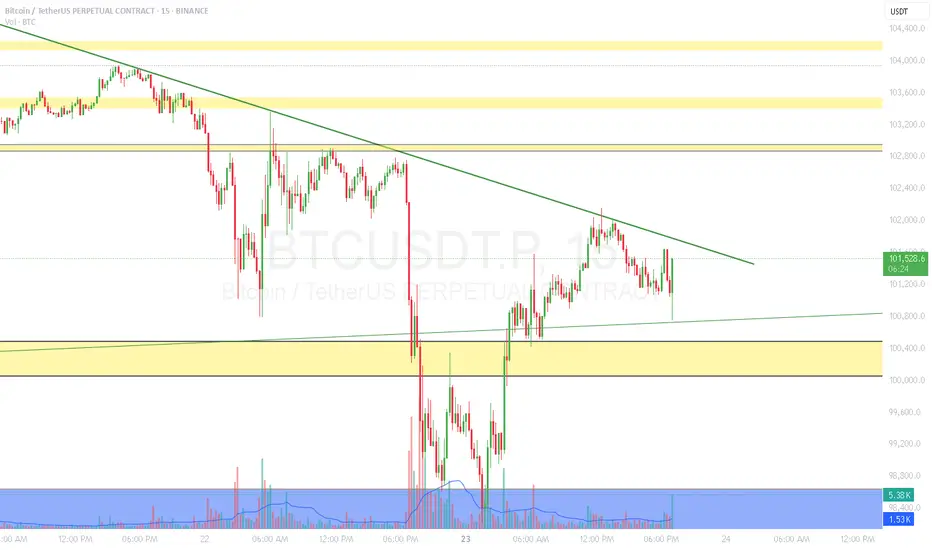
BTC, Selling pressure below 100K, 23 JunePlan BTC today: 23 June 2025
Related Information:!!!
Market capitalisation fell to $3.03 trillion over the weekend, likely due to speculators expecting a sell-off in response to US strikes on targets in Iran. However, the limited reaction from traditional financial markets brought buyers back to the crypto space, showing their willingness to buy at a discount and pushing market capitalisation back up to $3.12 trillion.
The cryptocurrency sentiment index dropped to 42 on Sunday, its lowest level in two months, but rebounded to 47 at the start of the new week, moving from the fear zone into neutral territory.
Bitcoin slipped to $98K over the weekend, briefly touching the classic support level at 61.8% of the April–May rally. However, by the start of the European trading session, it had already recovered to around $102K, compared to $102.7K at the beginning of Sunday. Still, last week’s sell-off broke the 50-day moving average support, weighed down by external factors. A breakout from the $96K–$105K range will likely determine the direction of the next major move
personal opinion:!!!
Selling pressure caused gold price to drop below 100k yesterday, macro economy has not changed much. Gold price continues to suffer selling pressure
Important price zone to consider :!!!
support zone : 100.800 ; 98.200
Sustainable trading to beat the market

BTC Bitcoin: Where I'm buying this war crash. Buy in strategyBTC Bitcoin: Where I'm buying this war crash. Buy in strategy
We're in a buy zone right now but I'm looking for bullish divergences for entry. I'll add more if we start getting higher highs.
If we lose this zone, then I'm looking again around the 90k area.
I think this is a wonderful opportunity to get BTC under 100k.

BTCTHE BTC 99k is a strong demand floor as shared across all platform weeks ago, my ema+sma strategy is giving me another lower buy floor on the daily ascending trendline in the zone of 94k.
that zone will be watched as it will represent a break of a strong demand floor 100k floor .

BTC Accumulation modelI would love to see some more ranging, followed by another deviation into this 4h demand to then turn this range into a model 1 accumulation. I would expect the overall range low to hold a little bit longer, since it's a confirmed daily cycle low. I will update this idea if it looks like it could play out.

Bitcoin– bearish momentum builds after rejection at $109KIntroduction
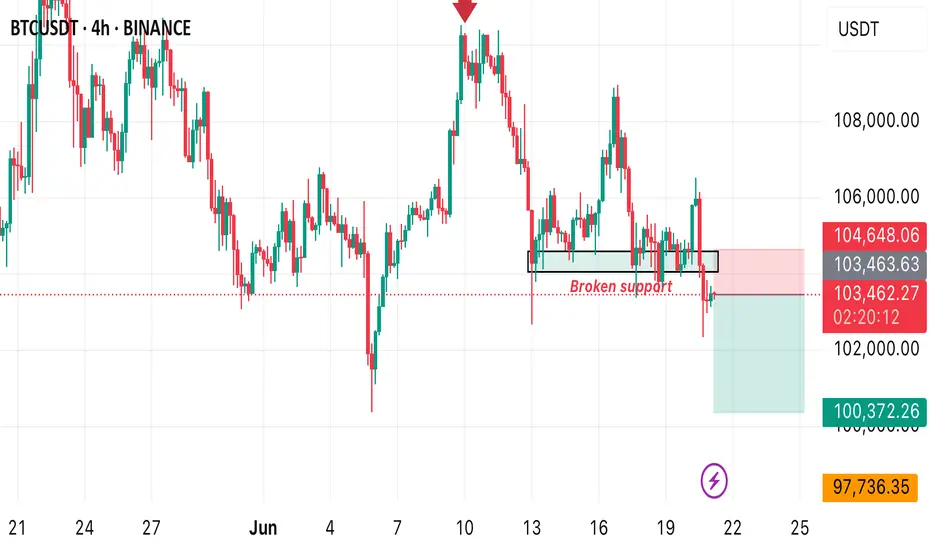
Bitcoin (BTC) is currently showing weakness after forming a lower high at $109,000. This level acted as a significant point of rejection, and since then, BTC has been moving lower. The price has broken through key support areas, indicating a possible shift in market structure. In this analysis, we’ll break down the recent price action, explain the technical signals behind the move, and discuss what could be expected in the short term.
Rejection from the 0.786 Fibonacci Level
The rejection at the $109,000 level aligns perfectly with the 0.786 Fibonacci retracement on the 4-hour timeframe. This level is often seen as a strong resistance point during corrective moves, and in this case, it held firmly. The precision of this rejection gives it more weight, and since hitting that point, BTC has been steadily declining. This move down suggests that buyers were unable to push through the resistance, leading to increased selling pressure.
Break of the 4H Bullish FVG
As BTC started its decline from $109,000, it broke through the bullish Fair Value Gap (FVG) that had formed earlier on the 4-hour chart. This gap previously served as a support zone but has now been decisively broken with strong volume. The loss of this level is significant, as it marks a breakdown of the bullish structure and opens the door for further downside movement. In the process of this move lower, BTC has created a new bearish FVG on the 4-hour timeframe. This gap remains open and could potentially act as a magnet for price to revisit, offering a possible short entry if price retraces into that zone. However, the clear break below the previous bullish FVG indicates a shift in momentum and supports a more bearish bias for now.
Downside Target at $102.7K
Given the recent breakdown, the next key level to watch is around $102,700. This area marks the wick low on the 4-hour timeframe and stands out due to the size and sharpness of the wick. Such large wicks often leave behind unfilled orders, which markets tend to revisit over time. The presence of these resting orders makes this level a likely target for the ongoing move down. It also acts as a strong area of potential support, where buyers might step back in if the price reaches that point.
Conclusion
With the rejection from the 0.786 Fibonacci level and the failure to hold the bullish 4H FVG, BTC has shown clear signs of weakness. The breakdown in structure suggests a continuation to the downside is likely, with $102.7k being the most immediate target. This level could serve as a strong support zone due to the unfilled orders left behind by the previous wick. Until BTC reclaims key support levels or shows a shift in momentum, the bias remains bearish in the short term, and traders should remain cautious while expecting further downside.
Thanks for your support.
- Make sure to follow me so you don't miss out on the next analysis!
- Drop a like and leave a comment!

Perspective -- all basic indicators point DOWNI feel it's easy to get lost in what is happening NOW and forget what has happened OVERALL.
Zooming out to a weekly chart and using basic trading indicators, we can see where this is going.
Trading Volume: Low
Double Top: Confirmed
Elliot Pattern: Concluded
SMA50 & SMA100: Same setup as Dec 2021
Stochastic RSI: Turning bearish
First target: 92 - 93k range
Second target: 77 - 78k range
Third target: 33 - 34k range
I suspect a slight uptick at 93k, but not surprised if it breezes past this onto 78k.
Strange that anyone views this as a bulllish movement. This is a clear signal of a bearish market, and if altcoins follow then it'll be a full on crypto winter.

USA bombs IRAN - Bitcoin Falling!Operation Midnight Hammer was a major U.S. military strike carried out on June 21, 2025, targeting three of Iran’s key nuclear facilities: Fordow, Natanz, and Isfahan.
The operation involved seven B-2 Spirit bombers, each flying an 18-hour mission from Missouri, supported by over 125 aircraft, including refueling planes, fighter escorts, and surveillance assets.
To maintain the element of surprise, the U.S. used deception tactics, such as sending decoy aircraft westward over the Pacific while the actual strike force flew east toward Iran with minimal communications.
The bombers dropped Massive Ordnance Penetrators (MOPs)—30,000-pound bunker-busting bombs—on the fortified nuclear sites. Cruise missiles launched from a U.S. submarine struck additional infrastructure targets.
The Pentagon described the mission as the largest B-2 operational strike in U.S. history and the first known combat use of the MOP. Officials emphasized that the operation was aimed solely at nuclear infrastructure and not at Iranian civilians or military personnel

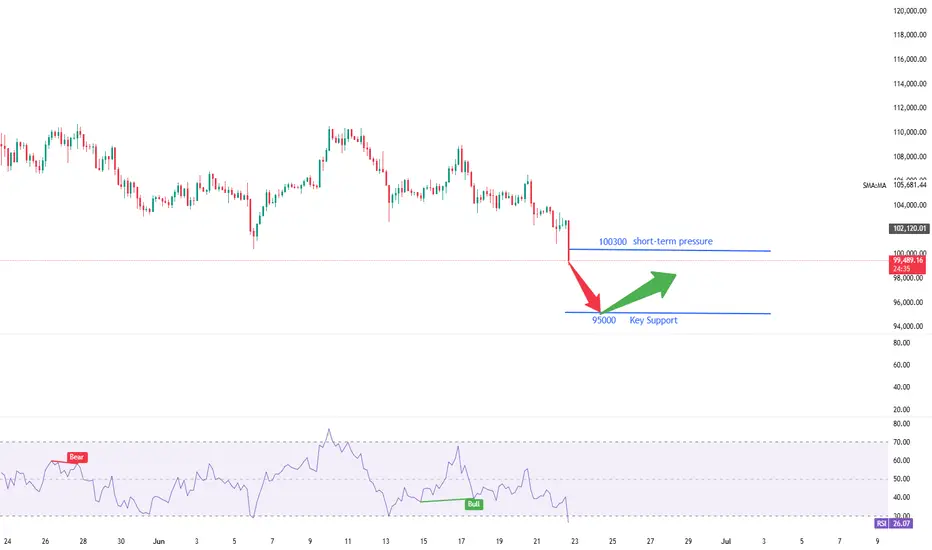
Need to wait for the key turning point.The Bitcoin market has currently broken below the key support level of 100,300, confirming a downward trend reversal. A daily-level recovery rally is now underway, and the 4-hour wave structure has not yet concluded. First, the downside target is seen at 95,000 to 98,000. Next week, the key turning point at 92,000 will likely determine the low of a rebound. Although this rebound low is not the ultimate bottom, it will trigger a relatively strong rebound after formation.
you are currently struggling with losses,or are unsure which of the numerous trading strategies to follow,You have the option to join our VIP program. I will assist you and provide you with accurate trading signals, enabling you to navigate the financial markets with greater confidence and potentially achieve optimal trading results.
Trading Strategy:
buy@95000-95500
TP:97500-98000
BTC/USDT Technical Analysis, 2025-06-20 19:45 UTCBTC/USDT Technical Analysis, 2025-06-20 19:45 UTC
💡 Trade Setup Summary
Pattern Detected: Bullish Hammer at local bottom
Confirmed by bullish candle close above pattern high
Volume Confirmation:
Volume Flow Analysis → Increasing OBV
Current Volume = 5.17, which although lower than the short-term mean, is paired with a positive trend
Order Book & Whale Confirmation:
Whale Bids > 2 BTC detected: 1 order, 3.54 BTC
Order Book Imbalance: 36.84% favoring buyers
Technical Indicators :
✅ Oversold region confirmed (likely RSI < 30, inferred by engine)
✅ Bullish pattern with volume trend confirmation
✅ Order book imbalance > 2%
✅ Whale bid presence
✅ Market pressure shows buyer dominance
✅ OBV increasing
Entry Price: 103146.58
Target (TP): 105646.58
Stop Loss (SL): 102146.58
Risk:Reward Ratio: ~2.5:1
