BTC to 102.5k game plan. here you can see that bitcoin is trading within a zone that will likely lead to a breakout to the downside, unless geopolitical tensions somehow get freed up. I believe that we will see 102.5k by the end of the month, if not sooner.
BTCUSDT.5S trade ideas

BTC – 15min Reversal Structure & Fibonacci ReclaimWe’re currently witnessing a potential short-term reversal on BTC’s lower timeframe after a volume-supported breakdown and sweep of local lows.
🔍 Key Observations:
Price swept liquidity at local lows (~103,929.27)
Entered into a clear reaccumulation box with responsive buyers
Volume profile shows prior POC just above – room for fill
Fibonacci retracement aligns with key structure:
0.5 = 104,372.94
0.618 = 104,268.23
1.0 = 104,816.60 (final high target for this impulse)
📈 Potential Play:
Entry Zone: Just above the sweep candle (104,100–104,200)
Target 1: 0.382 at 104,477
Target 2: 104,816.60
Invalidation: Close below 103,926
🧠 Mindset:
This is a classic liquidity sweep → reaction → reclaim pattern. If BTC flips the 0.5 level with strong momentum, a short squeeze toward the 104.8K area becomes likely.
Great opportunity for scalpers or day traders.
Let me know if you want this turned into a long-form breakdown or sent in another format.

BTC: Short 19/06/25Trade Direction:
BTC Short
Risk Management:
- Risk approx 0.25%
Reason for Entry:
- M30 + M15 Bear Div
- Rejected off Monday low
- Failure to break weekly open
- H1 overbought
- Market is choppy, HTF Bearish
Additional Notes:
- Compounding shorts to maximize edge if trade confirms, currently have a risk free SOL short running. Moving my risk to this.

BTC
BTC is currently in local consolidation. After a liquidity grab on either side, potential entry setups may form via the AMD pattern — but only if key conditions are met.
No setup — no trade. Wait for confirmation.


BTC/USD – Price Rejected at ATH | Key Support in PlaY Bitcoin recently reached a new all-time high at $111,942, but the daily candle closed lower around $109,550, signaling a potential rejection.
On the 1D timeframe, we are now watching the $100,725 level closely. A confirmed break below this support would be a strong signal to consider short positions.
Until then, BTC may consolidate or attempt another push higher. Patience is key here — wait for confirmation.
📌 Key levels:
• Resistance: $111,942 (ATH)
• Support: $100,725 (critical break level)
🧠 Trade safe, manage risk, and follow for more analysis.

HolderStat┆BTCUSD forms a triangleBYBIT:BTCUSDT trades inside a narrowing flag between 104 k and 108 k. A push past 108 k activates the pole projection toward 112–114 k and possibly the ATH rail; rejection sends price to retest 102 k support before the next offensive.

Bitcoin (BTC): Buyers Accumulating Near 200EMA | Pump Incoming?Buyers are showing dominance near the 200EMA, which might lead the price to upper zones and give us a good bounce from here.
What we are expecting is some sort of sideways or neutral movement before the weekend hits, and during the weekend we are looking to see strong upside movement.
Swallow Academy

BTC: Scalp Long 18/06/25Trade Direction:
Long BTC Scalp BINANCE:BTCUSDT.P
Risk Management:
- Risk 0.1% (very low risk due to market conditions)
- Target approx 0.5% gain
Reason for Entry:
- 0.618 retracement
- Sweep of recent low
- M30 Fair Value Gap tapped (partially mitigated earlier)
- Multi time frame Oversold
- Market structure holding key support level
Additional Notes:
- Confidence level low low likely hood this succeeds but trading my plan
- Very cautious trade in a volatile unpredictable market environment

Technical Analaysis Setup – #BTC/USDTTechnical Analaysis Setup – #BTC/USDT
#Bitcoin is currently forming a bearish harmonic pattern indicating a potential correction toward key support zones.
📉 The price action suggests the development of a Gartley pattern with projected downside targets around $103,679, $101,931, and possibly extending to $97,419.
A critical resistance zone between $105,000 and $106,000 will be pivotal for either confirming bullish momentum or triggering a bearish reversal.
If BTC fails to break through this resistance and confirms the bearish reversal signal, a deeper decline toward the aforementioned support levels becomes highly probable.
🎯 Target 1: $103,679
🎯 Target 2: $101,931
🎯 Target 3: $97,419

US entering the war,~25% drop will happen if it's gonna escalateUS about to enter the war with Iran, as long the war finish quickly with US destory Fordow nuclear site and other facilities, we can stop around 94k$ zone,
war escalating more, will engage a bigger drop in markets.
Likely they will announce it after markets close on Friday. stay updated.

BTC Short | FVG Setup + RSI Filter | 18.06
Smart Money Concept | Intraday Trade | 1:2 RR
🔍 The setup:
Today I was watching for a short opportunity.
Price reached a key level and formed a bearish FVG — looked clean at first.
But I held off entering because I noticed RSI divergence — a red flag I always consider when expecting a potential level break.
💡 Why it matters:
RSI divergence often signals weakness in momentum.
For me, it's a key filter that helps avoid fake breaks — this was a good example of how I apply it.
📈 What happened next:
Price moved up to test the 1H FVG (zone #2) and formed another FVG slightly lower.
That second one was my entry point for the short.
🎯 Target:
I exited at a 1:2 risk-reward, which is my minimum.
The day was ending, and I didn’t want to hold the position longer — I’m not convinced the down move would continue cleanly (possible wicks or traps).
🤔 Question to the community:
How do you filter FVG entries?
Do you also use RSI or wait for structure shifts?
And what’s your outlook on BTC from here?

BTC Accumulated Over 104K💎 BTC PLAN UPDATE (June 16)
NOTABLE BITCOIN (BTC) NEWS:
At least four publicly listed U.S. companies announced plans on Tuesday to significantly increase their cryptocurrency exposure, committing a combined $844 million in new investments. The move reflects a growing corporate appetite for Bitcoin and other digital assets as alternative stores of value and growth opportunities.
The most substantial commitment came from Hong Kong-based ready-meal provider DDC Enterprise Ltd, which disclosed three separate purchase agreements totaling $528 million. The entire sum is earmarked for expanding the company’s Bitcoin reserves.
Technical analysis angle
DAY DAY: Bitcoin is united when uncertainty takes root
Bitcoin price moves widely at about $ 106,300 at the time of writing the article after failing to reach the $ 107,000 resistance threshold on Monday. Its technical structure, as observed from the daily chart below, shows the trend of price increases.
The dynamic convergence indicator (MACD) has maintained the signal to be confirmed on Thursday when the blue MACD line cut under the red signal line. This signal often encourages traders to consider reducing exposure to Bitcoin, thereby creating a dynamic motivation.
The relative power index (RSI) highlights the discount trend when it is sloping, approaching the middle line 50. The movement is below this important neutral level that can catalyze the downtrend, bringing the average exponent dynamic line of 50 days (EMA) at $ 103,064, the 100 -day EMA road at $ 98,783 and the 200 -day EMA road at $ 93,083 to become expected targets.
==> Comments for trend reference. Wishing investors successfully trading

Bitcoin's Latest Market AnalysisThe recent escalation of the situation in the Middle East has triggered a surge in risk - aversion sentiment across global financial markets. As a risk - on asset, Bitcoin has faced certain selling pressure in a market environment dominated by risk - off sentiment.
From a technical chart perspective, Bitcoin has made multiple attempts to break through the key resistance range of $108,800 - $110,000 in the recent period, but has encountered significant selling pressure each time. On the other hand, the area between $105,000 - $103,000 forms an important support zone. When the price drops to this area, it attracts some bargain - hunting capital inflows, which provides a certain degree of support for the price.
The price of Bitcoin is expected to fluctuate within a relatively narrow range. If it can hold the key support level of $105,000 and the bulls can regain strength, the price is likely to rebound to the range of $106,000 - $108,000. However, if the $105,000 support level is effectively breached, it may trigger additional selling pressure, potentially driving the price down further to $103,000. In extreme cases, if market panic sentiment spreads further, it may test the psychological threshold of $100,000.
you are currently struggling with losses,or are unsure which of the numerous trading strategies to follow,You have the option to join our VIP program. I will assist you and provide you with accurate trading signals, enabling you to navigate the financial markets with greater confidence and potentially achieve optimal trading results.

Bearish btcLooking at the market and what is going on around the globe 🌍
From my technical stand point btc would drop (80k)

Bitcoin Double TopDouble top formation and now in support line and support trendline
if this line break, it will give rug and rug in altcoin, and maybe bitcoin can heading to 94k
But if bitcoin can solid above the lines, we can expect sideway with resist in 110k

BTCUSDT Long-Term Roadmap: From Capitulation to a $310K BreakoutAfter a confirmed breakdown from both the ascending trendline and the horizontal support near $110,000, BTCUSDT has entered a bearish phase. However, the projected green candles in your forecast suggest a long-term recovery structure—a potential accumulation phase, followed by a breakout cycle toward a new all-time high at $310K.
📈 Long-Term Phases in the Projection:
1. Phase One: Capitulation & Accumulation (~$65K–$90K)
BTC breaks down below $100K, potentially finding support between $65K and $90K.
This becomes a classic accumulation zone, where smart money begins to position.
Volatility decreases, and price action flattens while volume builds.
2. Phase Two: Recovery & Structure Break (~$105K–$110K reclaim)
Price reclaims the broken support at $105K–$110K, now acting as resistance.
A successful flip of this level into support signals the start of a new bullish cycle.
Market sentiment starts to shift from fear to cautious optimism.
3. Phase Three: Expansion Phase ($110K → $180K)
Once past $110K, BTC enters a momentum-driven rally.
Important psychological levels like $120K, $150K, and $180K are reached.
Institutions and retail FOMO begin re-entering the market.
4. Phase Four: Mid-Cycle Reaccumulation (~$180K–$210K)
BTC consolidates in a wide range, forming a reaccumulation base.
This becomes the launchpad for the final parabolic leg upward.
Market disbelief turns into euphoria.
5. Phase Five: Parabolic Rally to $310K
Once $230K–$250K resistance is cleared, BTC enters parabolic mode.
Targeting the macro top at $310,000, aligning with a future cycle peak (likely post-halving cycle).
Could happen within 12–24 months, depending on macro and cycle momentum.
🔍 Key Technical Conditions to Watch:
Successful reclaim of $110K on high timeframe (weekly close)
Formation of a higher low above $90K
Volume confirmation during breakout of $150K and $180K
Break and hold above $230K confirms macro breakout

#Bitcoin Roadmap for 2025–2026 A Deep Corrective Scenario UnfoldI believe the major top for Bitcoin was already printed on May 21st, at $111,000.
From here, I expect a three-wave corrective structure to unfold:
• 🔻 First drop to $69,000
• 🔼 Then a relief bounce to $85,000
• 🔻 Followed by a deeper decline to $46,000
If Bitcoin breaks the historical ascending trendline after reaching $46,000, I anticipate a five-wave bearish structure to continue:
• Further drop to $33,000
• Temporary correction up to $45,000
• And finally, a capitulation wave towards $19,000
I know this may sound early or even extreme to some, but if you review my previous Bitcoin outlooks going back to 2014, you’ll notice that many of these scenarios—however bold—have eventually played out with precision.
📌 Invalidation Level:
This scenario would be invalidated if Bitcoin closes a weekly candle above $115,000.
Good luck, fellow traders—stay sharp and prepared. 🧠📉
⸻

weekly BULL-FLAG!it looks like after the rally bitcoin had since early April, now this is a bull-flag pattern on weekly and that can push bitcoin to $140k.

BTCUSDT. Initiative Analysis Market OverviewHey traders and investors!
📍 Context
On the daily and 4H timeframes, the market is in a sideways range (Black lines = range boundaries).
Buyer initiative is active on 4H. The target initiative is 108,952.
However, on the daily timeframe, the seller initiative is in control, and a seller zone has formed. The seller zone is the red rectangle on the chart.
📊 Key actions
The buyer attempted to break out of the range on the daily timeframe twice, but both times the seller pushed the price back inside.
The price is currently interacting with the seller zone. Watching for the reaction.
🎯 Trade Idea
🔸 Long positions — with caution. Only valid if the price holds above 105,336, aiming for the target at 108,952.
🔸 Until that happens, the priority is on further downside, in line with the current seller initiative on the daily. It’s reasonable to look for short setups if the seller defends 105,336.
This analysis is based on the Initiative Analysis concept (IA).
Wishing you profitable trades!

Stocks fall, Bitcoin follows.
The stock market frenzy that reached multiple all-time highs finally cooled, and Bitcoin fell with it.
Bitcoin Slides, Stocks Slide
The stock market finally ended its record-breaking rally, with the S&P 500 and Nasdaq falling 0.36% and 1.10%, respectively. Bitcoin, which has been trading sideways for more than a week, also fell slightly, down 1.50% at press time. The only star was the Dow Jones, which maintained its upward momentum, rising 0.72% to 44,410.13 points, still more than 600 points away from the record of more than 45,000 points set in December 2024.
Tesla (NASDAQ: TSLA) led the stock market decline, with its shares plunging 5.15% after U.S. President Donald Trump criticized the company's CEO Elon Musk and the government subsidies Tesla received in a scathing post on Truth Social.
"Elon probably gets way more subsidies than anyone in history, and without them, Elon would probably have to close up shop and go back to his home in South Africa," Trump wrote. "Maybe we should give DOGE a look at this? Could save a lot of money!!!"
The friendship between Trump and Musk took a sharp turn after Musk criticized the president's "Great, Spectacular Bill," which the Committee for a Responsible Federal Budget claimed could add $3-5 trillion to the nation's $36 trillion debt.
"It's clear that with the insane spending on this bill, which raises the debt ceiling by a record $5 trillion, we now live in a One Party State - Fat Pigs PIGS!!!" Musk wrote on X.
Bitcoin prices have fluctuated between $105,689.17 and $107,855.98 over the past 24 hours and are currently trading at $106,002.05, down 1.50% year-over-year, according to Coinmarketcap. The cryptocurrency is up slightly by 0.56% over seven days.
Trading volume rose 8.61% to $444.48 billion, and Bitcoin’s market capitalization fell 1.48% to $2.1 trillion, outperforming the overall cryptocurrency market, which fell 1.61%. The difference was reflected in Bitcoin’s dominance rate, which rose 0.32% to 65.43%.
The value of open futures contracts fell 2.78% to $69.92 billion, indicating a decline in speculative appetite. Coinglass data showed that total liquidations in the past 24 hours reached $60 million, with most of the liquidations or $55.08 million coming from long positions, while bearish short sellers were liquidated $4.93 million.

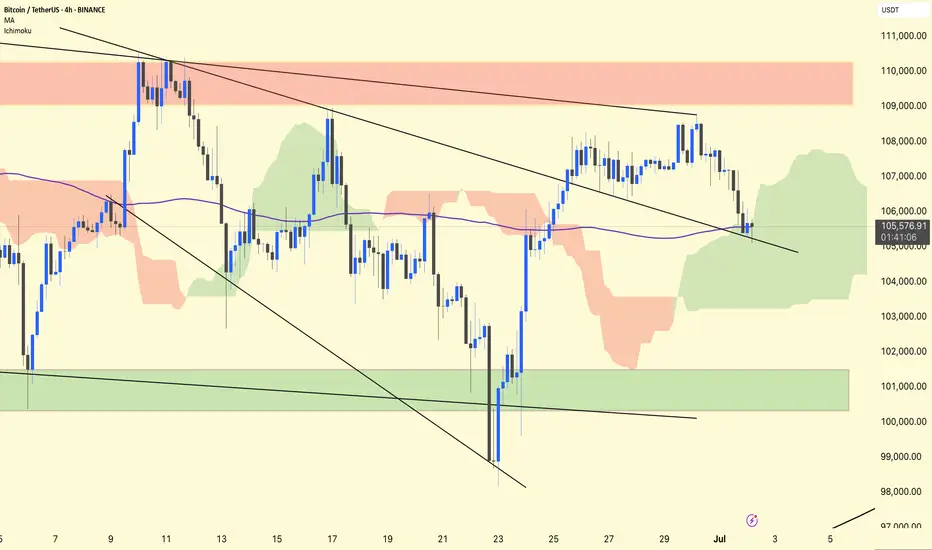
BTC/USDT 4H Analysis.
BTC remains in a retest phase after breaking out of the first descending broadening wedge.
The price has returned to test the upper wedge trendline, which is now acting as support around ~$105,500.
The purple 1 00-period MA (~105,570) overlaps this retest zone, adding additional confluence to the support.
Ichimoku
BTC is inside a green cloud, indicating indecision but not a confirmed trend reversal.
The cloud provides dynamic support in the ~$104,500–105,500 area.
Stay alert!
As simple as it gets - Short then longDescending channel, posible scalping trades ahead before support confirmation at 98,000-100,000. Once confirmed, I would expect a nice bullish swing towards breakout. What do you all think?
