Master the Trio => to Level Up Your Trading🧠Most traders obsess over chart patterns and price action—but lasting success comes from mastering three pillars together:
Technical Analysis. Risk Management. Trading Psychology.
Miss one, and the structure collapses.
Let’s dive into each one, and see how they work together like a high-performance trading engine:
📈 1. Technical Analysis – Think in Layers, Not Lines
Most traders draw lines. Great traders read behavior.
Instead of asking “Is this support holding?”, ask “Why would smart money defend this level?”
Markets aren’t driven by lines—they’re driven by liquidity, trapped traders, and imbalances. That’s why:
A fakeout isn’t failure—it’s often a feature.
A breakout isn’t a buy signal—it’s bait.
Trendlines aren’t magic—they’re just visualizations of collective bias.
🔍 Advanced tip: When analyzing a chart, map out:
Where liquidity is resting (above equal highs/lows, tight consolidations)
Who’s likely trapped (late buyers at resistance, early sellers during accumulation)
Where the market must not go if your bias is correct (invalidations)
The real edge? Seeing the chart as a battle of intentions, not just candles.
🛡️ 2. Risk Management – Your License to Play the Game
Every trade is a bet. But without proper risk, it’s a gamble.
Risk management isn’t just about stop losses—it’s about position sizing, asymmetry, and survival.
I risk no more than 1% per trade , regardless of conviction.
I aim for 2R minimum —because even with a 50% win rate, I still grow.
I define my invalidation before I enter, never after.
You can’t control the outcome, but you can control your exposure. That’s professional.
🧠 3. Trading Psychology – Where Most Traders Break
You can have the perfect setup and smart risk, but still sabotage yourself.
Why? Because emotion overrides logic —especially when money is on the line.
Ever moved your stop? Chased a candle? Closed a trade too early, only to see it hit your TP later?
That’s not lack of skill—it’s lack of emotional discipline.
What works for me:
Journaling every trade—not just the result, but how I felt
Practicing “sit tight” discipline after entries
Reminding myself that no single trade matters—only the process does
You don’t trade the chart—you trade your beliefs about the chart. Master yourself first.
🔄 Final Thoughts
Trading isn’t just about entries.
It’s a mental game played on financial charts, where edge lies in understanding market mechanics, protecting capital, and staying emotionally grounded.
TA shows you the “what”
Risk shows you the “how much”
Psychology decides the “how well”
Master all three—and you’ll separate yourself from 95% of traders.
💬 Which of the three is your strongest? And which one needs more work?
Let’s grow together—drop your thoughts in the comments 👇
All Strategies Are Good; If Managed Properly!
~Richard Nasr
BTCUSDT.5S trade ideas

Bitcoin Purchase Plan!If the price breaks resistance #1, another bullish wave will be more likely in the medium term
Trading Setup:
Traders can open their Buy Trades NOW
BTCUSDT Bitcoin (Daily)
Buy now or Buy on 101500.0
SL @ 93200.0 (-8%)
TP1 @ 121900.0 (+19%)
TP2 @ 136000.0 (+33%)
TP3 @ 150000.0 (+47%)
What are these signals based on?
Classical Technical Analysis
Price Action Candlesticks Fibonacci
RSI, Moving Average , Ichimoku , Bollinger Bands

Bitcoin Weekly & $120,000This weekly Bitcoin chart says it all... Please, allow me to reveal to you what the future holds!
Good evening my fellow Cryptocurrency trader, what a wonderful day.
Only one week ever produced a higher close than the current price. Only once, 19-May, Bitcoin managed to close above $107,000... What happens if Bitcoin closes above $107,000? New all-time high confirmed.
Two days remain for the week to close and we—the bulls—only need to maintain a price of $107,000 or higher to send such a strong bullish signal that everybody will come out and start buying.
The next target on this timeframe is $120,000.
Bitcoin is using EMA13 as support. This level was tested and holds, the same for EMA8. When Bitcoin moved above these levels in April, it produced an advance from $83,000 to $112,000, more than 33%. The price now is $107,000 but instead of recovering from below EMA8/13, BTCUSDT is trading above; this means that the bullish bias is fully confirmed.
The weekly timeframe looks great. We can expect higher prices soon, with growth happening for an extended period of time. Bitcoin is very strong now and this is only the start.
I will continue to share proof that shows the entire Cryptocurrency market going up.
Thank you for reading.
Leave a comment with your questions.
Thanks a lot for your support.
Namaste.

do not SHORT Bitcoin with 20XA consolidation range happens when the market trades sideways, in a neutral capacity. This sideways trading is neither bearish nor bullish, thus neutral. The bearish or bullish tendencies can only be defined based on the broader market structure.
If the consolidation range develops coming from a major drop, you can say that the market is bearish and the consolidation a bearish consolidation even if the breakout happens to the upside. Once it happens to the upside we can say that a reversal developed but the tendencies were bearish nonetheless.
If the consolidation range develops coming from a major rise, you can easy say while being correct that the market is bullish and the consolidation phase a bullish one, because of the bigger structure, previous price action and the chart.
Bitcoin is consolidating with bullish tendencies but there is a boundary which we call resistance and another boundary which we call support, this is the trading range. When the market is ranging, this is when margin traders lose the most because the trend remains hidden and money tends to be made when the market is in a clear trend.
Whenever the upper boundary gets challenged we get a retrace and a test of support. Whenever the lower boundary gets tested prices recover and move back up. This process gets repeated for as long as it is needed to remove all the weak hands, most of the signals are pure noise.
This is the situation in which we find Bitcoin today. Ultra-bullish but sideways and anything can happen short-term. Do not SHORT Bitcoin with 20X. You might end up with some fast and easy profits.
Thank you for reading.
Namaste.

BTC - 108k?BTC looks it has power to go more up, remember the more it goes up the more shorts are active, but 108,500 good look for shorts as well!

BTC 26.06.25This could be the range i was waiting for to create the 3rd tap of the accumulation model later. Yesterday we had a mini model 1 at NY open which could have had the intention to be the starting point of the new range. I am now watching for new deviations which then would form a bigger range. There is nothing but liquidity until 104.536$ which would be a perfect target for a range low, but until there are no confirmations this only is an expectation. If the accumulation model is already complete, like i mentioned in my last post, then the target becomes the range high (110.652$).

Bitcoin Roadmap: Key Levels to WatchBitcoin( BINANCE:BTCUSDT ) managed to pump as I expected yesterday , of course, the main catalyst could have been the ceasefire announcement between Iran and Israel , which had a major impact on high and medium risk assets in the financial markets .
Bitcoin is once again moving near the Heavy Resistance zone($110,720-$105,820) and the Resistance zone($107,520-$106,100) after breaking the Resistance lines .
In terms of Elliott Wave theory , it seems that given Bitcoin’s bullish momentum , Bitcoin has completed the main wave 3 and is currently completing the main wave 4 on the 1-hour time frame . The corrective wave structure of wave 4 could be a Double Three Correction(WXY) .
I expect Bitcoin to start rising again near the Support zone($104,380-$103,060) , 50_SMA(Daily) , Support lines , and Cumulative Long Liquidation Leverage($104,412-$103,812) to rise at least to the Potential Reversal Zone(PRZ) and Resistance lines .
Note: Stop Loss(SL)= $102,600 = We can expect more dumps.
Please respect each other's ideas and express them politely if you agree or disagree.
Bitcoin Analyze (BTCUSDT), 1-hour time frame.
Be sure to follow the updated ideas.
Do not forget to put a Stop loss for your positions (For every position you want to open).
Please follow your strategy and updates; this is just my Idea, and I will gladly see your ideas in this post.
Please do not forget the ✅' like '✅ button 🙏😊 & Share it with your friends; thanks, and Trade safe.

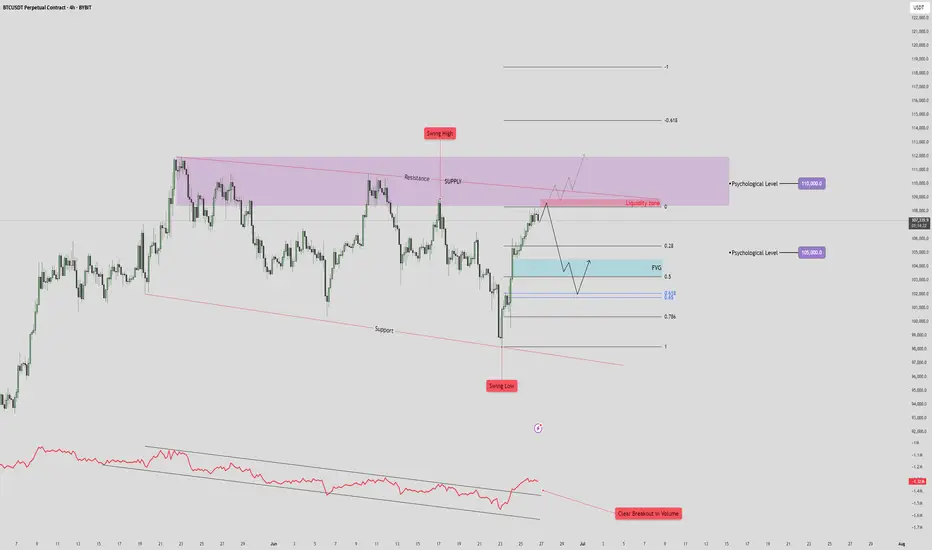
BTC/USDT Drop to 101k?🧠 High Time Frame Context
Trend: Consolidation within a broad range (support and resistance clearly defined).
Key Psychological Levels:
105,000 USDT – minor level, acting as a magnet in short-term PA.
110,000 USDT – major supply confluence and liquidity target.
🟪 Supply & Resistance Zone
Zone: Marked in purple (108.5k-112k).
Key Observation:
Swing high formed inside this zone, indicating liquidity trap.
Potential fake-out or strong rejection from this area.
Strong confluence with a descending resistance trendline, adding to the selling pressure.
🔵 Fair Value Gap (FVG) & Retracement Targets
FVG identified just below the current price (~103.5k-104.5k).
Price is projected to:
Reject from the current high.
Drop to fill the FVG zone.
Possibly bounce between FVG and Fibonacci retracement levels:
0.5
0.618
0.786
🔴 Volume & RSI Divergence
Volume breakout is noted on the last push down (bottom red annotation), followed by a retrace.
OBV shows bullish divergence with price:
🔻 Support Structure
Lower red trendline is a key long-term support.
Previous swing low aligns with this trendline – buyers showed strong interest here.
If FVG fails to hold, expect a retest of this trendline near 97,000–98,000.
📈 Likely Scenarios
Base Case (Neutral-Bearish):
Price rejects current zone (~107,000).
Pullback into FVG (101–104K).
Bounce to 105K (minor resistance), then decide next direction.
Bullish Breakout:
If price breaks and closes above 110K, it invalidates supply zone.
Opens door to 115–118K range.
Bearish Breakdown:
Fails FVG zone.
Tests previous swing low and support (~97K).
Below that, structure becomes macro bearish.
🧩 Summary
Short-Term: Retracement into FVG likely. Monitor reaction.
Medium-Term: Bearish bias while price is below 110K.
Invalidation for bears: Clean break and hold above 110K.
Bitcoin BTC price analysis BTC.D and events calendar for JulyToday is the last day of the month and the last day of the second quarter, so there may be some volatility in the markets between 🐂 VS 🐻
💰 The CRYPTOCAP:BTC chart shows an interesting picture — the price has reached the upper limit of the consolidation channel, and now:
1️⃣ The scenario with an upward breakout is quite clear: a breakout from the channel upward and consolidation above $108-110k= a move to $125k during July.
2️⃣ A correction to $99k will mean that buyers have taken control of the OKX:BTCUSDT price, preventing it from updating its lows. This will be a clear signal to buy, because further growth is inevitable.
3️⃣ A deep correction to $91,660 (filling the GAP that formed on the CME BTC chart) or slightly lower. This is the last “unclosed” GAP, which, according to TA rules, should be filled for a full-fledged growth trend to begin.
So which scenario is closer to your heart, which one do you believe in?
Or write your version of events in the comments.
Interesting observations to think about:
◆ Over the past two weeks, the inflow of funds to #BTCETF has exceeded $5 billion, but the price of #BTCUSD on CEX exchanges has not been able to “break out” upward. Is this just ETF "property of numbers", or are spot #Bitcoin sales that strong?
◆ The BTC.D indicator has reached a critical level of 66%, and it will be interesting to see whether it will give altcoins some breathing room next month.
(If there are a lot of likes and comments under the idea, we will additionally describe our thoughts on BTC.D and USDT.D.)
◆ SP 500, by the way, has updated its highs, and the last few months on the stock market are very similar to the beginning and middle of the COVID-19 pandemic in 2020.
◆ And in principle, July promises to be very eventful:
👉 By July 9, Trump is expected to make a statement regarding the tariff wars with the rest of the world, which he has put on hold.
👉 July 18 marks the beginning of Mercury retrograde, which “influences” people's behavior and ‘superstitions’ and forces them to be “more cautious” when making trading decisions (and trading bots don't care about emotions and beliefs)
👉 And on July 30, there will be a FOMC meeting, where Mr. Powell may announce a rate cut, as the US is in a recession, which is time to acknowledge.
If we have forgotten anything, please add it in the comments!

BITCOIN I Daily CLS I KL - OB I Target ATHHey, Market Warriors, here is another outlook on this instrument
If you’ve been following me, you already know every setup you see is built around a CLS range, a Key Level, Liquidity and a specific execution model.
If you haven't followed me yet, start now.
My trading system is completely mechanical — designed to remove emotions, opinions, and impulsive decisions. No messy diagonal lines. No random drawings. Just clarity, structure, and execution.
🧩 What is CLS?
CLS is real smart money — the combined power of major investment banks and central banks moving over 6.5 trillion dollars a day. Understanding their operations is key to markets.
✅ Understanding the behaviour of CLS allows you to position yourself with the giants during the market manipulations — leading to buying lows and selling highs - cleaner entries, clearer exits, and consistent profits.
🛡️ Models 1 and 2:
From my posts, you can learn two core execution models.
They are the backbone of how I trade and how my students are trained.
📍 Model 1
is right after the manipulation of the CLS candle when CIOD occurs, and we are targeting 50% of the CLS range. H4 CLS ranges supported by HTF go straight to the opposing range.
📍 Model 2
occurs in the specific market sequence when CLS smart money needs to re-accumulate more positions, and we are looking to find a key level around 61.8 fib retracement and target the opposing side of the range.
👍 Hit like if you find this analysis helpful, and don't hesitate to comment with your opinions, charts or any questions.
⚔️ Listen Carefully:
Analysis is not trading. Right now, this platform is full of gurus" trying to sell you dreams based on analysis with arrows while they don't even have the skill to trade themselves.
If you’re ever thinking about buying a Trading Course or Signals from anyone. Always demand a verified track record. It takes less than five minutes to connect 3rd third-party verification tool and link to the widget to his signature.
"Adapt what is useful, reject what is useless, and add what is specifically your own."
— David Perk aka Dave FX Hunter ⚔️

Bitcoin ready to move towards 85,000When a trend line is broken, it suffers for a few days and then moves
Tp1:85000
To2:80000
2p3:63000

Bitcoin Bounced Right Where It ShouldBitcoin continues to respect the script — breakout, clean retest, and now holding strong.
The 50 EMA has been a reliable dynamic support throughout the entire uptrend, and once again, it helped catch the recent dip. Price has now successfully retested the breakout zone and is starting to bounce.
Structure looks healthy, momentum is building, and unless the support fails, the next leg up could be just around the corner.
Simple setups. No noise. Just trend.
DYOR, NFA

Bitcoin Fractal, increase to $116k Hi Everyone☕👋
BINANCE:BTCUSDT
Been such a long time since I posted. Today I'm looking at BTCUSDT, and I'm looking at the previous all time high cycle and what we were seeing (the pattern aka fractal).
Here's why we're likely going a little higher.
First correction of -32%
Followed by first peak, ATH
Correction, then the second peak and the REAL ath. Which is where we likely are:
Interesting to note that the previous time, the second ath was NOT THAT MUCH HIGHER. This should be considered to manage expectations in terms of how high we can go. Anything above +6% is a bonus.

Lingrid | BTCUSDT possible Channel Break - Upside Surge The price perfectly fulfilled my last idea . BINANCE:BTCUSDT is pulling back slightly after rejecting the descending red trendline near the 108,000 level, while remaining above the breakout zone around 105,000. The structure suggests a potential bullish continuation if the price holds this level and forms a higher low. A successful breakout above 108,000 could ignite a move toward the 111,000 resistance band.
📈 Key Levels
Buy zone: 105,000–105,300
Sell trigger: breakdown below 105,000
Target: 111,000
Buy trigger: breakout and retest above 108,000 with strong momentum
💡 Risks
Failure to hold 105,000 reopens path to 98,700
Bearish rejection at 108,000 could maintain lower high structure
Weak volume breakout may lead to a bull trap under 111,000
If this idea resonates with you or you have your own opinion, traders, hit the comments. I’m excited to read your thoughts!

Lingrid | BTCUSDT potential Bullish Momentum after Fake BreakoutBINANCE:BTCUSDT just reclaimed the support area after a deep liquidity grab below 100,000, rebounding sharply toward the mid-range. Price is still trapped below the descending resistance trendline, but the recent fake break and reversal signal a bullish shift in momentum. If bulls hold above 100K, a breakout toward 105,000 looks increasingly probable.
📈 Key Levels
Buy zone: 99,000–100,500
Sell trigger: break below 99,000
Target: 105,000
Buy trigger: strong breakout above the descending blue trendline
💡 Risks
Retesting resistance at 105,000 may trigger a pullback
Descending structure still intact until breakout confirms
Sharp volatility spikes could invalidate short-term setups
If this idea resonates with you or you have your own opinion, traders, hit the comments. I’m excited to read your thoughts!

BEst long on Btc is at $104 600CRYPTOCAP:BTC
Our plan is still bullish
But price reached VAH
That's why some pullback is possible
$104 600 is key zone for me. POC + VWAP. I`ll take a long trade in a case of local confirmation.

Bitcoin Breakout Incoming? Flash PMI & CME Gap in FocusBitcoin ( BINANCE:BTCUSDT ) started to fall ( about -4%) after the news that the US was involved in the Middle East tension , but it has risen again with good momentum .
Do you think Bitcoin will go below the previous bottom($98,200) again on the 1-hour time frame?
Bitcoin is trading in the Resistance zonezone($102,130-$100,700) and near the Resistance lines .
In terms of Elliott Wave theory , it appears that a Double Three Correction(WXY) has been completed near the Potential Reversal Zone(PRZ) . Also, the first 5 microwaves of the Impulsive have now been completed .
---------------------------------
Bitcoin traders should monitor today’s Flash Manufacturing (expected 51.1) and Services PMI (expected 52.9) . Both forecasts are already lower than last month’s figures (51.3 and 54.8) , but I see a chance they come in even weaker.
Why weaker PMI is likely?
Slowing retail sales and softer labor data point to reduced consumer demand.
High interest rates are starting to pressure both the production and services sectors.
Regional Fed surveys already showed a cooling in business activity.
If the PMI prints below expectations, the market may anticipate a more dovish Fed, pushing the dollar( TVC:DXY ) down and giving Bitcoin a potential bullish boost.
---------------------------------
I expect Bitcoin to move towards filling the CME Gap($103,730-$102,275) after breaking the Resistance lines , and if the Resistance zone($104,380-$103,060) is broken, we should expect further increases.
Cumulative Short Liquidation Leverage: $103,391-$103,934
Cumulative Long Liquidation Leverage: $100,800-$100,250
Cumulative Long Liquidation Leverage: $97,691-$97,241
Note: Increased tensions in the Middle East or new and important news surrounding this news can make the analysis invalid, so be more careful with capital management.
Note: If Bitcoin can touch $98,170 , we can expect more dumps.
Please respect each other's ideas and express them politely if you agree or disagree.
Bitcoin Analyze (BTCUSDT), 1-hour time frame.
Be sure to follow the updated ideas.
Do not forget to put a Stop loss for your positions (For every position you want to open).
Please follow your strategy and updates; this is just my Idea, and I will gladly see your ideas in this post.
Please do not forget the ✅' like '✅ button 🙏😊 & Share it with your friends; thanks, and Trade safe.

UNEXPECTED RISK CRASH FREE FALL AFTER TREND DATA FOR TH NEXT 48HDepending on our study, BTC has a high chance of a new crash below 100K.
The next 48 hours are important for the trend change of BTC, which can allow the trend to free-fall below 100K
BTC is at a top, and it did recovery always recovered on the M volume top., We are now again on the same trend.
BTC can return below 100K as this update shows, with the possibility of targeting the main target 85K - This is the trend zone for new interest.
The reason for this crash is that BTC has not confirmed the cycle, which means the end of the cycle. There is always possibility that the market can act green, but we expect it can show an unexpected breakdown.

Bitcoin Price Analysis! What's Next?Bitcoin Price Analysis! What's Next?
From our last analysis, Bitcoin increased from 107K to 108.5K
The price reached the limits of the pattern so far making everything more difficult because it increased, but with very low volume.
This time, BTC added some more data.
You may watch the analysis for further details
Thank you!

Short BTC, it is about to retrace and test 100000 again!As BTC gradually fell back, the rebound did not stand above 110,000 in the short term, proving that there is strong selling pressure above, and the trend line formed by the technical high point 111,000 and the second high point 110,000 formed an important resistance area, which limited the rebound space of BTC and strengthened the demand for BTC's short-term retracement.
According to the current trend, the short-term oscillation bottom area of 106,000 may be broken at any time. Once it falls below the oscillation area, it may arouse a certain degree of profit-taking chips and stimulate BTC to accelerate its decline. I think BTC will at least test the 105,000-104,000 area again during the retracement, and may even test the 100,000 integer mark again.
Therefore, shorting BTC is still the preferred option for current short-term trading.
Consider shorting BTC in the 108,000-109,000 area, and the target area in the short term is 104,500-103,500. After breaking this area, the target can be extended to 101,000-100,000.
BINANCE:BTCUSDT BINANCE:BTCUSDT BITSTAMP:BTCUSD

Waiting for the Liquidity Flush – Will We Get That Drop or a StoCurrently holding a short position and have been waiting for a decent liquidity flush towards my TP zone for almost a day now. The thing that bothers me is how slow the price action is—it's grinding lower, but at the same time, building up a new liquidity shelf just above my entry.
This makes me concerned that we might see a quick liquidity sweep to the upside (taking out stops, possibly including mine) before any real move down happens. The area around my TP is loaded with liquidity, but the market seems hesitant to make that push.
What’s your opinion—are we likely to get that clean drop soon, or should we brace for a fake-out and stop hunt first?

BTCBtc was trading inside falling wedge since a weak. it has cleared it now and has very good possibility of pumping hard to 112k

[SeoVereign] BITCOIN Bearish Outlook – June 29, 2025We are the SeoVereign Trading Team.
With sharp insight and precise analysis, we regularly share trading ideas on Bitcoin and other major assets—always guided by structure, sentiment, and momentum.
🔔 Follow us to never miss a market update.
🚀 Boosts provide strong motivation and drive to the SeoVereign team.
--------------------------------------------------------------------------------------------------------
Hello,
This is Seobeorin, approaching technical analysis not as a result but as a prediction, from a realistic perspective.
I am presenting a bearish view on Bitcoin as of June 29, 2025.
If you refer to the Ethereum idea from June 27, 2025, you can confirm that I presented a bearish perspective on Ethereum at the time. The basis for that perspective is still valid, and we are currently waiting for the take-profit level to be reached. The reason I selected Ethereum at the time was because I believed that the downward pressure on Ethereum was relatively stronger than that on Bitcoin.
However, based on today’s Elliott Wave count on the Bitcoin chart, I now judge that Bitcoin is also likely to experience some short-term downward pressure. Therefore, I am presenting a short position idea on Bitcoin.
The first take-profit target is set near $106,056. Depending on future price movements, this take-profit target may be narrowed or expanded. I will continue to track this idea, and as it develops, I will align the reasoning accordingly to organize the thought process more clearly.
Thank you.
