Upon reaching PDL price
Previous Day rejected the previous day's low.
When price reaches PDL if price shows a bullish CHOCH to the upside
there could be a bullish orderflow change @ near previous day low's
Could be a good long entry towards previous day high
BTCUSDT.5S trade ideas

BTC to 102.5k game plan. here you can see that bitcoin is trading within a zone that will likely lead to a breakout to the downside, unless geopolitical tensions somehow get freed up. I believe that we will see 102.5k by the end of the month, if not sooner.


ABC or 12345Just a little deeper to finish the wave count and we're all set. If it stays an ABC, it could mean an expanded flat correction, which wouldn't be good since it would mean we'd go deeper later.

Future market trend predictionIn the short term, the price trend of Bitcoin is full of uncertainties. On the one hand, if the global macroeconomic environment continues to deteriorate, with slower economic growth and increased inflationary pressures, it may prompt more investors to seek safe-haven assets. As an asset with certain safe-haven properties, Bitcoin may attract some capital inflows, providing support for its price. However, if regulatory policies are further tightened in the short term, especially if more stringent restrictive measures are introduced in countries and regions where Bitcoin trading is active, then the price of Bitcoin may face significant downward pressure.
you are currently struggling with losses,or are unsure which of the numerous trading strategies to follow,You have the option to join our VIP program. I will assist you and provide you with accurate trading signals, enabling you to navigate the financial markets with greater confidence and potentially achieve optimal trading results.

BTC RESPECTING THIS BOXESLast time we had great btc trade
This time play this boxes with good risk management

Possible outcome for $BTCBitcoin Price Analysis: Signs Pointing to a Potential Downtrend
The chart above illustrates a detailed analysis of BTCUSDT (Bitcoin paired with USDT) using Elliott Wave theory and key support/resistance levels. After what appears to be a completed 5-wave bullish cycle, the technical outlook suggests that Bitcoin may be poised for a significant downside correction.
Completion of the Elliott Wave Structure
The chart marks the completion of five distinct waves:
Wave (1) initiated the bullish trend.
Wave (2) represented the first significant pullback.
Wave (3) delivered a strong upward surge, surpassing previous highs.
Wave (4) brought another retracement, finding support near a previous resistance zone.
Wave (5) capped off the structure, reaching above the $100,000 mark before exhibiting signs of exhaustion.
According to Elliott Wave theory, a 5-wave impulse is typically followed by a corrective ABC pattern. The chart suggests that this correction is now underway.
But I think it is trying to create a double top pattern.
Key Levels to Watch
Highlighted on the chart are several crucial horizontal zones:
Near-term resistance: Around $109,600 – $112,000. Bitcoin struggled to maintain momentum above this area and has since started declining.
First major support zone: Around $75,000 – $80,000. This was a former resistance zone during Wave (3) and may now act as support during the early stages of the correction.
Critical support levels: Marked at $54,019, $50,000, and $46,877.5. A break below these levels would indicate a deeper corrective move, potentially aligning with the projected path shown on the chart.
Trendline Break and Bearish Outlook
The yellow upward trendline that supported the entire rally is at risk of being decisively broken. The chart projection shows Bitcoin slicing through this trendline, signaling a shift from a bullish to bearish market structure. If this occurs, it could lead to accelerated selling pressure as confidence in the uptrend erodes.
Projected Price Path
The white arrows in the image depict a scenario where Bitcoin could fall to around $54,000 and possibly as low as the $46,000 region if key supports give way. This represents a significant correction, but one that aligns with historical post-impulse patterns seen in previous Bitcoin cycles.
Conclusion
While Bitcoin has enjoyed an impressive rally culminating above the $100,000 level, technical indicators on this chart point to the increasing likelihood of a sustained downward correction. Traders and investors should monitor the key support levels closely and be prepared for heightened volatility as the market seeks a new equilibrium following this extended bull run.


Bitcoin Ready For Fall Check my levels Hello trader's
Here is the chart level of bitcoin for selling...
So if you want to Know about intrday levels
Comment...

BTC-----Buy around 104900, target 106000 areaTechnical analysis of BTC contract on June 19:
Today, the large-cycle daily level closed with a small positive line yesterday, the K-line pattern was a single positive line with continuous negative lines, the price was below the moving average, and the attached indicator was dead cross. The general trend of the decline was still relatively obvious, but in trading, we should pay more attention to the rhythm of the price range in the shock, so the operation should be decisive, not greedy, and do a good job of risk control; the short-cycle hourly chart yesterday's intraday support was corrected upward, the European session fell but did not continue to break down, the price support rebounded in the early morning, the current K-line pattern was a single positive line with continuous positive lines, and the attached indicator was golden cross, so it is highly likely to break through yesterday's high of 105500 area within the day.
Today's BTC short-term contract trading strategy:
Buy at the current price of 104900 area, stop loss at 104000 area, and target 106000 area;

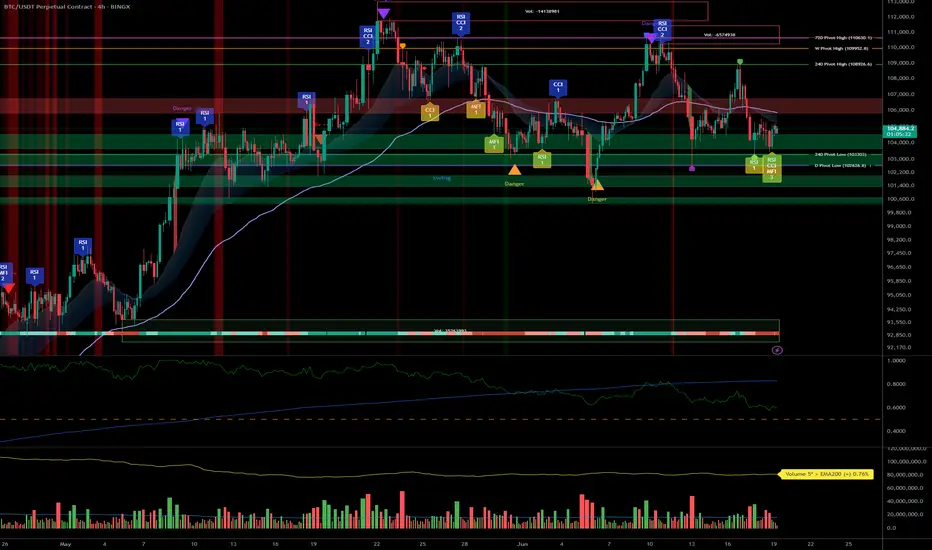
BTC – Bullish bias under review: 102k/103k supports in focus__________________________________________________________________________________
Technical Overview – Summary Points
__________________________________________________________________________________
Momentum : Dominant on all major timeframes (1D, 12H, 6H, 4H). Risk On / Risk Off Indicator signals STRONG BUY except on 15min (neutral).
Support/Resistance : Structurally key pivot zone 102k–106k; major supports 102k/103k. Potential breakout above 106k (swing target 109k).
Volumes : Normal across all timeframes. No excess signals, no accumulation/capitulation peaks.
Multi-TF Behaviors : Horizontal consolidation with bullish dominance. Short-term bearish divergence on 2H–15min, micro-TF in correction only, no panic.
__________________________________________________________________________________
Strategic Summary
__________________________________________________________________________________
Global Bias : Solid bullish structure as long as 102k/103k hold. “Risk On” maintained by sector outperformance.
Opportunities : Entries on pullback/main base 103k–104k; breakouts to watch above 106k.
Risk Zones : Clear invalidation <102k, potential rapid flush to 97k–88k; keep strict stop-loss below 102.5k.
Macro Catalysts : FOMC, Fed projections, Middle East geopolitics keep volatility high, but no shock. Price action leads near-term strategy.
Action Plan : Swing buy on confirmed support, dynamic hedge post-news, monitor volumes/closures on key pivots.
__________________________________________________________________________________
Multi-Timeframe Analysis
__________________________________________________________________________________
1D : Bullish momentum, major supports intact (102k/105k). Risk On / Risk Off Indicator = STRONG BUY, stable volume, no excess. Healthy structure for long swings.
12H : Positive bias, range 102.6k–106k. Risk On / Risk Off Indicator = STRONG BUY.
6H : Presumed accumulation 103k–106k, momentum still strong. No volume weakness.
4H : Range oscillation, structural support test at 103k. Sector outperformance, neutral volume.
2H : First sign of short-term weakness. Divergent with higher TFs but no panic.
1H : Technical rebound towards 104.8k possible as long as 103k support holds.
30min : Short-term trend remains bearish (trend 30min = down). Correction/purge ongoing.
15min : Neutral momentum, supports being tested. No panic or melt-down observed.
Summary : Strong bullish confluence on higher TFs, temporary divergence on micro-TFs. “Range with bullish bias” scenario as long as 102k/103k holds the structure.
__________________________________________________________________________________
Macro and Fundamental Analysis
__________________________________________________________________________________
FED/FOMC (June 18) : Rates unchanged, “data dependent” guidance. Raised volatility but no risk-off shift.
Market Sentiment : BTC technical structure holds, moderate post-FOMC volatility.
S&P500 : Above all key moving averages. Sector momentum (software, uranium, semis) remains dominant.
Energy Level : Weak oil = little macro pressure against BTC.
Geopolitics : Israel–Iran escalation / US posture reinforced. High FX/oil volatility but BTC resilient (>102k), no panic on record.
Economic Calendar : Closely watching BoE & SNB, but low BTC impact odds.
Implications : Post-news phase = ideal for range trading, no rupture event expected within 48h.
__________________________________________________________________________________
Strategic synthesis & R/R guidance
__________________________________________________________________________________
Long on pullback 103–104k, swing targets 106/109k. Optimal R/R (>2.5) if stop 102.5k (D Pivot Low).
Invalidation area : Clean close <102k or heavy downside volume (capitulation via ISPD/volumes).
Risk Management : Dynamic stops, partial hedge post-FOMC during macro volatility.
Conclusion : Bullish structure preserved. Range trading scenario dominant, no extreme signals or panic. Actions: support watch, technical buy on confirmed pullback.
BTC continues to accumulate above 103,500Plan BTC today: 19 June 2025
Related Information:!!!
Bitcoin (BTC) price edges slightly higher, trading near $104,700 at the time of writing on Thursday, after stabilizing above a key level — the 50-day Exponential Moving Average (EMA) at $103,100. A breach below this level could trigger a sharp fall in BTC. Risk aversion could intensify, as reports indicate that US officials are preparing for a strike on Iran in the coming days. Despite this risk-off sentiment in global markets, institutional demand remains strong, with US spot Bitcoin Exchange Traded Funds (ETFs) seeing positive inflows for eight consecutive days
personal opinion:!!!
btc continues to accumulate above 103,500, the market is no longer sensitive to interest rate information yesterday
Important price zone to consider :!!!
support zone : 103.500 \ 101.000
Sustainable trading to beat the market

#BTC Ascending Triangle📊#BTC Ascending Triangle
🧠From a structural perspective, the daily upward trend has ended, which means that the correction expectation at the daily level has always existed, so we need to be alert to this possibility and do a good job of risk management. At present, there is no short structure, so if you want to participate in short trading, you need to look for opportunities in the heavy resistance area (106500-108200).
➡️From a graphical perspective, we have been sideways for nearly a month, and the price is gradually being squeezed to form an ascending triangle. At present, the price shows signs of stabilization at the lower edge of the triangle, and we need to be alert to the risk of rebound. Only when the closing price at the 4h level is lower than the lower edge of the triangle or the price falls below the inflection point of 102611, can we think that the market direction has chosen to go down.
⚠️Note that there will be a Fed interest rate decision and geopolitical negotiations in the Middle East today, and the market may fluctuate violently, so be sure to do a good job of risk management.
Let's take a look👀
🤜If you like my analysis, please like💖 and share💬 BITGET:BTCUSDT.P

Volume spikes on down moves add to selling pressure.📉 BTCUSDT – 1H Chart Technical Outlook
🔍 Structure Insight:
Bitcoin is currently trading within a descending channel, forming lower highs and lower lows, indicating persistent bearish pressure. Price action appears compressed between key trendlines, hinting at an imminent breakout.
---
🔻 Scenario 1: Bearish Breakdown (Primary Bias)
If BTC fails to hold above the lower boundary of the range, a decisive break below could trigger a sharp move toward the 103,650–103,000 demand zone. The structure supports continuation to the downside if the price rejects resistance again.
🧊 Bearish Confluence:
Price is unable to break above dynamic resistance.
Momentum remains weak near the mid-range.
Volume spikes on down moves add to selling pressure.
---
🔼 Scenario 2: Bullish Breakout (Alternative View)
A breakout above the descending trendline and confirmation candle could flip bias short-term bullish. This would target the 105,400+ region as the next liquidity area.
⚡ Bullish Signs to Watch:
Break and retest above trendline resistance.
Bullish engulfing or breakout candle with volume.
---
🔍 Key Levels to Monitor
Support: 103,650 / 103,000
Resistance: 105,000 / 105,400
Breakout Zones: Watch for clean breaks and retests outside the wedge pattern.
---
📌 Conclusion:
BTC is coiling within a tightening range. The breakout direction will likely dictate the next short-term trend. Maintain flexibility — breakout confirmation is key before positioning.
🚨 Not financial advice — always DYOR before trading!

BTC - 106k now, whats next?106k is a rotational move, means the top liquidity get inside at first hence and then it goes down, watch it for

Trade #12: $BTC - Bullish Alignment Confirmed! Long Setup WatchRecap & Lesson Learned:
In Trade #11, I noted the daily structure was strongly bullish, but the 1HR chart was bearish. My expectation was for price to dip toward the 98,000 daily demand zone. However, the 1HR structure reversed structure before reaching that level — a reminder that markets don’t always follow our ideal path.
The Shift: Timeframe Synced = Conviction Amplified!
Now, BOTH daily AND 1HR structures are BULLISH and aligned. This synchronization signals robust momentum, and I’m positioned fully bullish — awaiting the right technical trigger to enter a long trade.
The Opportunity: Precision Entry at Demand
I’m eyeing the green demand zone near 106,500 for a potential long entry. This is where buyers previously stepped in aggressively, making it a high-probability reaction area.
Key Refinement: Patience & Confirmation
(Learning from Trade #11):
I will NOT enter blindly at 106,500. Instead, I’ll:
1️⃣ Watch price behavior for signs of strength
2️⃣ Confirm my entry criteria are met
3️⃣ Execute ONLY if evidence validates the setup.
Why This Discipline?
"It’s better to enter slightly higher WITH confirmation than chase a ‘sniper entry’ without confirmation."
No confirmation = No trade. Period.
My Plan:
WAIT for price to test ~106,500.
CONFIRM buyer strength and alignment with my rules.
EXECUTE a long position only if all boxes are checked.
Stay Alert, Stay Patient.
The trend is our friend — but only if we respect its rhythm. Updates to follow!
✅ Key Takeaways:
Daily + 1HR = Bullish Synergy.
Watch 106,500 for a confirmed long entry.
No confirmation = No trade. Discipline over FOMO.

Classic H&S pattern in Daily chart of BTCHello Good Morning everyone:
Are your preapared for this classic pattern of Head and Shoulder of BTC at daily chart??

US entering the war,~25% drop will happen if it's gonna escalateUS about to enter the war with Iran, as long the war finish quickly with US destory Fordow nuclear site and other facilities, we can stop around 94k$ zone,
war escalating more, will engage a bigger drop in markets.
Likely they will announce it after markets close on Friday. stay updated.

Bitcoin buy ideaBitcoin (BTCUSD) had a challenging week of consolidation, but it remains stable above $100,000 despite losing some weekly gains. On the 4-hour chart, demand is holding above $102,000. With the Fed maintaining interest rates at 4.50%, if Bitcoin consolidates above $102,000-$103,000, we could see short-to-mid-term growth towards $106,000-$110,000.

H&S $92K Short + CME Gap Fill Towards Support LineCurrently CME Gap already hit H&S with are target towards Gap Fill

BTC – Stop Hunt at the Edge of ValueThis is what a liquidity raid looks like.
Price just swept the bottom of the range, tapped into the low-volume zone (as seen on the volume profile), and reclaimed — classic sign of a trap sprung.
Key points:
The downtrend line labeled “comp” = compression — bulls forced to capitulate into a thin zone
High probability deviation with stop run and reclaim — this fuels the next move up
The green box shows risk-defined entry off the sweep low
Targeting the prior high: 106,787
Volume imbalance filled = no inefficiency above — price can now move cleanly
Execution mindset:
Trap spring → retrace into structure → expansion
Risk is clear, liquidity is engineered, structure remains
Late shorts just became the fuel.
Watch the reclaim of the box top. If that flips support, we ride momentum.
📈 For more setups like this — including pre-breakout traps — check the description in the profile.

BTC Bitcoin VAL, S1, Weekly, 1.27 confluence at $102,700BTC Bitcoin VAL, S1, Weekly, 1.27 confluence at $102,700
If we do drop more, this is where I'm looking to buy. Lots of support in this area for a bounce back to the POC. A rejection of POC means we may be looking at 100k. Get past it, then target is VAH around 106k.

Bitcoin Eyes $110K or $94K – Depends on Global HeadlinesBitcoin (BTC/USDT) – 4H Technical Outlook
📅 Update: June 18, 2025
🧭 Current Market Status:
Bitcoin is currently trading around $105,296, sitting in a tight consolidation above key support ($104K). The price has respected both demand and supply zones over the past few sessions but remains sensitive to macro-driven events, especially geopolitical instability.
We can clearly see BTC is caught between strong support around $100K–102K and resistance around $108K–110K, awaiting a directional break.
📊 Key Technical Levels:
Resistance Zones (Red):
$108K–110K – intraday resistance block
$112K – short-term breakout target
$114K–116K – final bullish extension zone
Support Zones (Green):
$102K–104K – immediate demand
$100K – psychological round number + previous breakout base
$98K / $96K / $94K – downside targets if panic sets in
🔺 Scenario 1: No US-Iran War (Bullish Case)
If no escalation occurs:
BTC could bounce from current support or even dip to $102K before pushing higher.
A clean break above $108K may trigger a move toward $112K and then $114K–116K.
Stochastic shows bullish divergence forming (see trendline), supporting a possible upside breakout if momentum strengthens.
🟢 Look for breakout candle + volume confirmation above $108K.
🔻 Scenario 2: US-Iran War Escalates (Bearish Case)
If military conflict breaks out:
Safe-haven rotation may favor cash or gold short-term; BTC could lose traction.
Breakdown below $102K may lead to panic drop toward $98K, followed by potential flush into $94K.
Watch for failure to hold $100K — this would mark a major shift in sentiment.
🔻 BTC has historically struggled during initial shock of war-related uncertainty.
🔁 Neutral/Bounce Scenario:
If price holds $104K–102K range but no major trigger emerges, expect sideways consolidation.
Traders can scalp range levels until a confirmed breakout or breakdown.
🛡️ Risk Management Notes:
BTC remains headline-driven — adjust position size based on volatility spikes.
If trading directionally, place tight SLs below key support or above resistance, depending on side.
Consider hedging with stablecoins or options if holding long-term spot.
📢 If you found this analysis valuable, kindly consider boosting and following for more updates.
⚠️ Disclaimer: This content is intended for educational purposes only and does not constitute financial advice.
