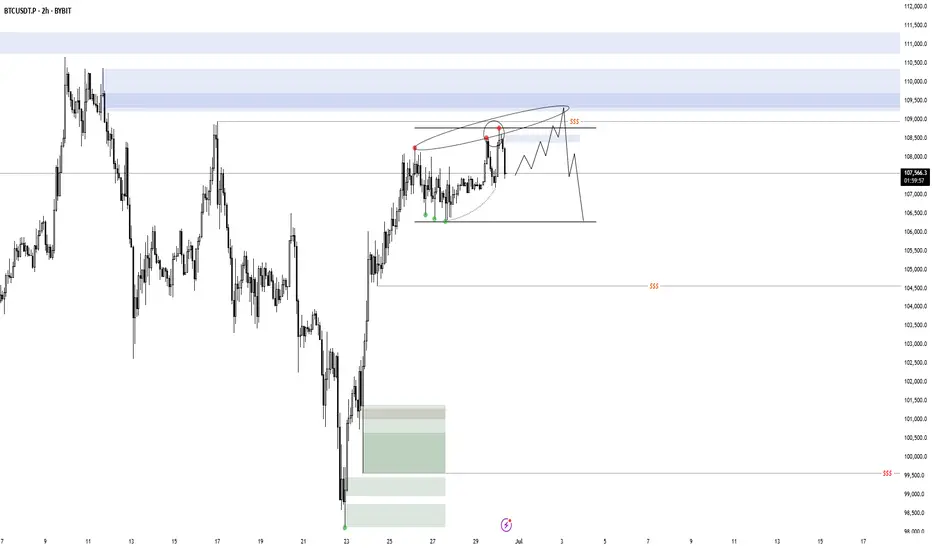
BTC AnalysisSince the red arrow was placed on the chart, Bitcoin's bullish phase has ended and it has entered a corrective phase. This correction appears to be forming a Diametric pattern, and we are currently in the middle of wave E.
After interacting with the demand zone, the price may move toward the specified targets.
A daily candle closing below the invalidation level will invalidate this analysis.
BTCUSDT.5S trade ideas

Mastering Inverse Fair Value Gaps (IFVG) - How to use them?In this guide, I’ll explain the concept of the Inverse Fair Value Gap (IFVG), how it forms, and how you can use it to identify high-probability trading opportunities. You'll learn how to spot the IFVG on a chart, understand their significance in price action, and apply a simple strategy to trade them effectively.
What will be discussed?
- What is a FVG
- What is an IFVG
- What is a bullish IFVG
- What is a bearish IFVG
- How to trade the IFVG
-------------------------------
What is a FVG?
A FVG is a technical concept used by traders to identify inefficiencies in price movement on a chart. The idea behind a fair value gap is that during periods of strong momentum, price can move so quickly that it leaves behind a "gap" where not all buy and sell orders were able to be executed efficiently. This gap creates an imbalance in the market, which price may later revisit in an attempt to rebalance supply and demand.
A fair value gap is typically observed within a sequence of three candles (or bars). The first candle marks the beginning of a strong move. The second candle shows a significant directional push, either bullish or bearish, often with a long body indicating strong momentum. The third candle continues in the direction of the move, opening and closing beyond the range of the first candle. The fair value gap itself is defined by the price range between the high of the first candle and the low of the third candle (in the case of a bullish move), or between the low of the first candle and the high of the third (in a bearish move). This range represents the area of imbalance or inefficiency.
-------------------------------
What is an IFVG?
An Inverse Fair Value Gap (IFVG) occurs when a traditional Fair Value Gap (FVG) is not respected by price, and instead of acting as a support or resistance zone, price breaks through it with strength. Normally, a Fair Value Gap represents a price imbalance left by a strong move, and when price returns to this area, it often reacts by respecting the gap, bouncing off it or reversing, because it's seen as a high-probability level where orders may rest.
However, in the case of an IFVG, price does not respect this imbalance. Instead, it slices through the FVG in the opposite direction, showing that the initial momentum behind the imbalance has weakened or reversed. This breach is a strong indication that market sentiment is shifting. What was once a zone of strength now becomes invalid, and this failed reaction signals that the opposite side of the market (buyers or sellers) has taken control.
The IFVG highlights a key transition in momentum. It tells traders that the prior bias, bullish or bearish, is breaking down, and the new dominant force is pushing price beyond levels that would typically hold. This makes the IFVG useful not only as a sign of failed structure but also as a potential confirmation of a trend reversal or strong continuation in the opposite direction. Essentially, where an FVG usually acts as a wall, an IFVG is what’s left after that wall gets knocked down.
-------------------------------
What is a bullish IFVG?
A bullish Inverse Fair Value Gap (IFVG) occurs when price breaks through a bearish Fair Value Gap (FVG) instead of respecting it. In a typical bearish FVG, the expectation is that when price retraces into the gap, it will react to the imbalance, usually by reversing lower, as the area represents previous selling pressure or inefficiency caused by aggressive sellers.
However, when price does not react bearishly and instead breaks cleanly through the bearish FVG, it signals a shift in market sentiment and momentum. This breakout through the imbalance suggests that buyers are now in control and that the bearish pressure in that zone has been absorbed or invalidated. What was once considered a resistance area is now being overpowered, often leading to continued bullish movement.
-------------------------------
What is a bearish IFVG?
A bearish Inverse Fair Value Gap (IFVG) occurs when price breaks through a bullish Fair Value Gap (FVG) instead of respecting it. In a normal bullish FVG, the expectation is that when price returns to the gap, it will act as support and prompt a move higher, as this area represents a previous imbalance created by strong buying pressure.
However, when price fails to respect the bullish FVG and instead breaks down through it, this signals a shift in momentum to the downside. The anticipated support fails to hold, suggesting that buyers are no longer in control or that their efforts have been overwhelmed by aggressive selling. This kind of move transforms the bullish FVG into a bearish signal, as it confirms weakness in what was previously considered a demand zone.
-------------------------------
How to trade the IFVG?
Trading the Inverse Fair Value Gap (IFVG) requires patience, precision, and clear confirmation of a shift in momentum. The process involves waiting for key conditions to form before entering a trade. Here's how to approach it step-by-step:
First, you need to wait for a liquidity sweep. This means price must take out a recent high or low, typically a short-term liquidity pool, trapping traders on the wrong side of the market. This sweep sets the stage for a potential reversal and indicates that the market is ready to shift direction.
After the liquidity sweep, watch for a 1-minute Fair Value Gap (FVG) to form and then get broken in the opposite direction. This break is crucial, it’s what creates the Inverse Fair Value Gap. The invalidation of this initial FVG confirms that momentum has switched and that the market is no longer respecting the previous imbalance.
Once the IFVG has formed, your entry comes on the close of the candle that breaks and closes beyond the IFVG, above it in a bullish scenario, or below it in a bearish one. This close confirms that the gap has not held and that price is likely to continue in the new direction.
Place your stop loss below the low (for a bullish setup) or above the high (for a bearish setup) of the structure that formed the IFVG. This gives you protection just beyond the level that would invalidate the setup.
-------------------------------
Thanks for your support.
- Make sure to follow me so you don't miss out on the next analysis!
- Drop a like and leave a comment!

BTC/USDT – Intraday Plan (15m, Ichimoku) by RiscoraToday’s idea:
I’m expecting a retracement to the 107,867 level as a pullback to the recent impulse. The move we observed earlier aligns with my prediction from last Friday — liquidity was taken out above the highs, and now I anticipate a deeper correction against the overall bullish move.
My main scenario for the day is a move down into the 106,400 area at minimum, targeting the liquidity below.
Ideally, I’d like to see a push to 107,870 first, as that would provide the best entry for a short setup. I’m willing to open a short in that scenario, but it’s important to remember the higher timeframe trend remains bullish, so any short should be approached with caution.
Key levels:
Retracement target: 107,867
Main downside target: 106,400
Cautious shorting only — trend still bullish overall
Let’s see how the price develops. Will update if conditions change.
#BTC #Crypto #Trading #Ichimoku #Riscora

BTCUSDT – Spring + S&R Rejection | 15min Power EntryBTCUSDT – Spring + S&R Rejection | 15min Power Entry
📅 June 26, 2025
Price swept support and printed a clean spring pattern on the 15-minute —
Rejection off key structure + volume surge confirms buyers are back in control.
✅ Demand stepped in hard
✅ Strong wick below consolidation
✅ Protected by the rising 200 EMA
✅ Entry aligns with a Fibonacci 1.618 projection target
I’m long to 109,290.56 — nothing less.
Stop is clean, invalidation obvious.
BTC just tapped the spring — I’m in.

#BTC Update. Here's the trigger point.CRYPTOCAP:BTC Update:
Bitcoin is trading around the key $108K resistance, one of the most crucial levels for bulls to break.
A strong close above this zone could spark a rally toward $ 117,000. However, if rejected, we might see a pullback to $ 103,000.
I’m not touching futures just yet.
I’m okay with missing a few green days; I’d rather wait for clear momentum than get caught in this choppy price action.
Let me know what you think in the comments.
Thank you
#PEACE

BTC 30.06.25So far BTC is behaving exactly as expected, i'm just waiting for a valid setup to appear. I would love to see a model 1, which takes out the high and mitigates supply, but i'm also not ignoring a potential model 2. These 2 deviations merge together on a higher time frame, where the range is also valid on, so they can be counted as one. There are many altcoins with similar behavior and USDT/C in potential accumulation. I'm waiting to see confirmations/ invalidations.
Do you think I'm joking ???Chart is speaking itself...AB=CD.
previous analysis
Give me some energy !!
✨We spend hours finding potential opportunities and writing useful ideas, we would be happy if you support us.
Best regards CobraVanguard.💚

Bitcoin has dropped for profitable purchasesBitcoin is within the range. Quite a bit of time has passed since the last retest, and the liquidity pool that has formed below 106345 may not allow the price to fall on the first attempt.
Global and local trends are bullish. Enter a buy position after a false breakout of support and the formation of a local reversal pattern on TF m5-m15
Scenario: if, after a false breakout, price consolidation forms above 106500, then the entry point could be a breakout of local highs (breakout of the structure - ‘bos’).

Bitcoin - An Epic Move Awaits!Bitcoin gained 13% in H1 2025, outperforming Ethereum and Solana, which dropped ~25% and ~17% respectively—highlighting BTC's strength in turbulent market conditions.
Institutional wedge: spot-BTC ETFs saw huge inflows—BlackRock’s took in $336M, and total crypto product inflows approached $45B+ this year.
AI models foresee BTC holding $105K+ by end-June, with ChatGPT pointing to $118K and Grok forecasting $108K, based on momentum and ETF flows.
We see BTC holding the 20 MA and spiking to new all time highs.

BTC/USDT – 4H Chart Technical AnalysisBTC/USDT – 4H Chart Technical Analysis
Market Structure & Trend
Overall Trend : Bearish (clearly defined by a consistent downtrend channel).
Current Structure : Price is in a corrective downtrend within a descending channel, after multiple rejections from the supply zone.
Key Technical Zones
1. Supply Zone
Strong rejection zone where the price previously reversed sharply.
Still acting as resistance, located around the upper range.
2. Demand Zone
Currently being retested for the fifth time, weakening its strength.
Recent price action shows liquidity sweep and swing low break inside this zone, potentially trapping early longs.
Fair Value Gaps (FVG) & Fibonacci Levels
1D FVG sits below the current demand, aligning with:
Golden Pocket (0.618–0.65 Fib).
Acts as a high-probability bounce zone for long entries if demand fails.
A break below this FVG could open up deeper downside toward the 0.786 Fib or beyond.
Psychological Levels
105,000 – Major resistance & potential take-profit area for long positions.
100,000 – Key support and liquidity magnet if the demand zone fails.
Volume Profile
High Volume Node: 102,000 – 106,800 — price tends to gravitate here, indicating potential consolidation or resistance.
Low Volume Area: Below 100,500 — suggests thin liquidity, which may cause sharp moves if price drops into this range.
Scenarios & Trade Ideas
Bullish Scenario
If price holds above the demand zone (after multiple retests) and confirms on LTF:
Potential Long to local resistance.
On breakout, target the 105,000 psychological level.
Confluence: High volume area offers both support and a magnet.
Bearish Scenario
If price fails to hold the demand zone:
Enter short position targeting the 1D FVG and 100,000 psychological level.
If that breaks, expect sharp continuation due to low volume below.
Conclusion
Price is at a pivotal point — currently balancing on weakened demand after multiple retests. Watch for LTF confirmation:
Above demand = bullish recovery setup.
Below demand = bearish continuation toward 100,000 and the FVG.
Manage risk tightly due to the proximity of both key zones.

PSYCHOLOGY OF A CRYPTO CYCLEWe expected a pullback, and now thats behind us!😅
The market is back on track, and we are firmly in the #Belief phase of the bull cycle.
With heavy short liquidity stacked around $110K, a push into that zone could trigger a short squeeze, launching us into the #Thrill phase.
And if momentum holds, all signs point to #Euphoria by late 2025.
Favorites so far this cycle:
🥑 POLONIEX:GUACUSDT 🔗 POLONIEX:LLUSDT 🎮 KUCOIN:MYRIAUSDT
🌐 HTX:SYNTUSDT 🧪 MEXC:DEAIUSDT 🏠 OKX:PRCLUSDT
🧱 MEXC:YBRUSDT ⛏️ MEXC:KLSUSDT 🧩 $RUJIUSDT
Comment below your favorite coins!

NEXT LEVELSnext move ahead for Bitcoin
Bitcoin Could Reach $140,000 in the Coming Months
Market analysts and crypto enthusiasts are increasingly confident that Bitcoin is on track to reach new highs. After strong institutional adoption, growing interest from retail investors, and the impact of recent halving events, many experts believe Bitcoin could surge to $140,000 in the coming months.
Macroeconomic factors like inflation concerns, limited BTC supply, and a weakening dollar are all contributing to the bullish momentum. If current trends continue, a breakout toward the $140K level is not just possible—it’s becoming more likely.
Stay informed, stay strategic, and get ready for what could be a historic move in the world of crypto.

Bitcoin Short Setup at Key Daily ResistanceIn this analysis, you will find a clear scenario for a potential short setup with precise conditions for confirmation and invalidation. No fluff or guesswork—only institutional analysis of capital footprints and pure price action. I will provide updates for every stage of price interaction with the POI in near real-time, so you can make timely trading decisions, not just observe events after the fact.
Context: What Happened Before?
Bitcoin has perfectly played out Scenario 2 from my previous long analysis. After the liquidity sweep below, which confirmed that the instrument is locked in a large global range, it began an aggressive, correction-less rally. This is often the case after absorbing a large amount of liquidity, which essentially became the fuel for this rise.
The Short Setup
To break out of the range to the upside (or at least make a deviation above it), Bitcoin must overcome the first serious resistance zone. This zone consists of:
The 78.6% Fibonacci level from the daily structure.
Liquidity from the Previous Week's High (PWH).
My plan is to look for a short position if we see a reversal reaction from this zone after the liquidity is taken. The minimum target for this move would be the lower boundary of the range and the daily order block located there. This local move inside the range can be seen as a shorting opportunity.
Invalidation of the Short Scenario:
A break of the 78.6% level with the price closing firmly above it would cancel the short scenario. In that case, Bitcoin would likely continue its move towards the next resistance level.

110k soon , best time to buy altcoins Btc still didnt complete main wave 5 , btc for last time touch 98k but this time price will attack 110k and then we will have NATH.

Bitcoin (BTC): Buyers Are Back in Control | New ATH Incoming?Buyers have taken full control once again where we had a good bounce near our buy zone. As we approach the local resistance zone, we are expecting to see a proper breakout from here, which would then lead us to a new ATH (around $120,000).
Swallow Academy

BTC - Bullish SOON!Hello TradingView Family / Fellow Traders. This is Richard, also known as theSignalyst.
BTC has been in a correction phase, and it feels like it's taking forever! ⏳
As long as the blue trendline holds, the overall bias remains bullish. 📈
As BTC approaches the blue trendline—perfectly aligning with a demand zone and support—we'll be watching for trend-following longs to catch the next big impulse move upward. 🚀
For now, we wait! ⏳
📚 Always follow your trading plan regarding entry, risk management, and trade management.
Good luck!
All Strategies Are Good; If Managed Properly!
~Rich

Bitcoin short position After my win streak from previous trades on btcusd I happy to give me to the people who followed me
Here's another great trade for you
Short Bitcoin with a limit order at 108,500
Take profit at 101k , stop loss at 109,500
A 7.5 to 1 risk reward ratio 🔥😉
You can never find anybody trade Bitcoin like me

BTC Preparing for Final Sweep Before Breakout?I’m currently waiting for a long opportunity on BTCUSDT. Price is consolidating in a range, and I believe we’re approaching the final support zone within this structure. The key area I’m watching is the 4H imbalance zone between ~102,968 and ~104,535, which also aligns with a strong structural support level.
I expect price to sweep this area, potentially triggering stop-losses below recent lows and then show a bullish reaction If confirmed, I’ll look to enter long targeting the liquidity resting around 108,762.
I’ll be watching closely for a reaction and confirmation

Bitcoin sell short 83000After breaking the long-term trend line and pullback, ready for a sharp move and correction to 83,000
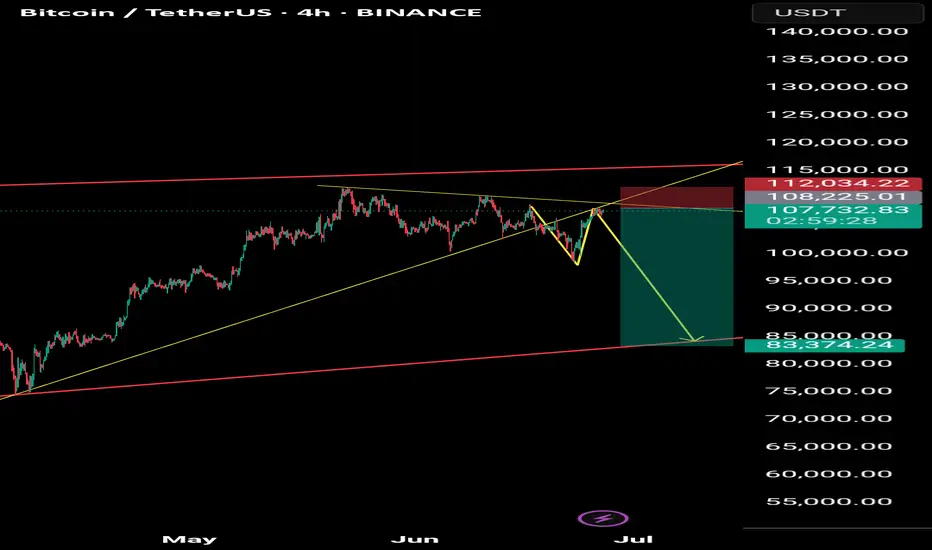
Two Possible #BTC Scenarios: July ATH or September Bull Run?#BTC
#1First Scenario: A pullback to $98K first, followed by a breakout from the Bull Flag pattern targeting $120K and a new ATH by the end of July.
#2Second Scenario: Another pullback, some consolidation to build strength, then a move to a new ATH and a full-fledged bull run into September. In this case, we might rally straight up to $130K without major corrections.

BTC/USD Fake out before Pump | Bullish Flag formationBTC/USDT (1D) Market Outlook – July 1, 2025
Introduction
BTC is currently consolidating within a bullish flag pattern after printing a swing high at 108.9K and a recent swing low at 98K. The price sits just below a major supply zone.
Context 1: Key Zones
Supply: 104.6K – 112.1K
Demand: 74.4K – 82.5K
Fair Value Gaps (FVG): 3 zones below price, with one near 88–90K
Context 2: Technical Confluence
Liquidation Zone: 106.2K
Golden Pocket (Fib 0.618): 102.1K
Psychological Levels: 105K and 110K
Context 3: Market Structure
Pattern: Bullish flag
Trend (LTF): Sideways/consolidation
Volume Profile: Heavy activity near 105K–110K
Bullish Scenario
Breaks above 106.2K (liq zone)
Pulls back to 102.1K (golden pocket), forms higher low
Retests resistance for continuation
Alt scenario: clean breakout above resistance → ATH retest
Bearish Scenario
Breaks below 106.2K and flag support
Fills FVG, breaks prior low at 98K
Triggers macro downtrend toward 88–90K zone
Summary
BTC is at a decision point inside a bullish flag, facing supply. A break above 106.2K favors upside continuation, while rejection and a lower low could trigger a deeper retracement. Watch key levels closely.

#BTCUSDT.p Bearish📉 Short Trade Alert! We're eyeing a potential downside move with a clear entry, stop loss, and multiple profit targets. Keeping a close watch on this one. #Trading #MarketAnalysis #ShortTrade #RiskReward

Bitcoin Short-Term Outlook – Coming Week📈 Bitcoin Short-Term Outlook – Coming Week
Currently, Bitcoin is expected to gather liquidity around the $106,000 zone, potentially initiating a move toward the $110,000 resistance level.
This area will be crucial in determining the next directional move.
🔍 The market's reaction around $110,000 will be closely monitored, and the analysis will be updated once that level is reached.
📌 Note: This outlook is based on current market conditions and may require adjustments if sentiment or price structure changes.
