BTC ENDED WITH ITS BULL RUN AND NOW IS THE STARTING LINE OF BEARMark my words down as BITCOIN started with its bear RUN!!!
From the view, we can know that bitcoin is unable to break HH recently, and fall sharply align with Nasdaq100, which break through the bull trend from the 4hr view and also daily view. 4% SL and TP 27% pullback bear run is very beneficiary.
When more and more big whale players come in to this game, you have to know who is the banker for now. Binance? Coinbase? Nope. The boss is CME.
BTCUSDT.5S trade ideas

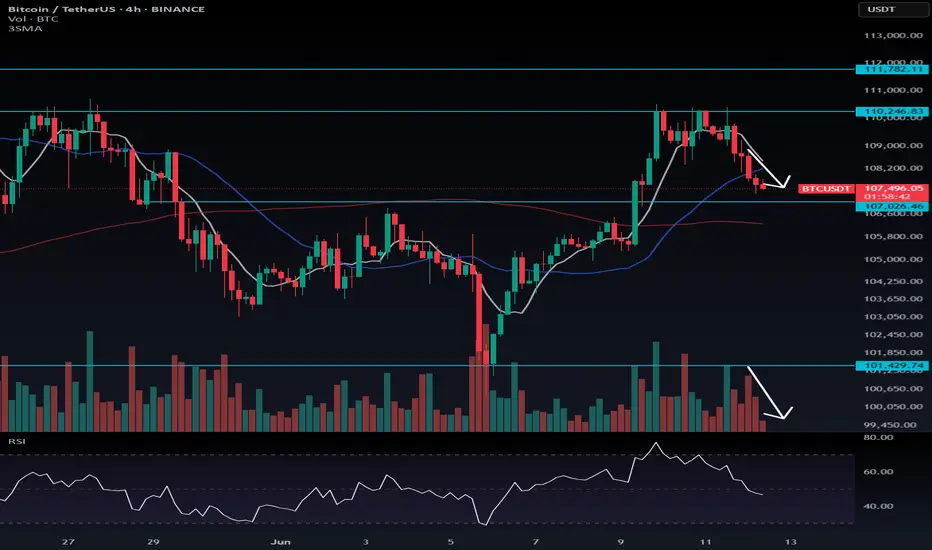
[DYOR] BTCUSDT – Rejected from Supply, Watch 200 EMA BreakdownBTCUSDT failed to continue upward and broke below the ascending structure. Now testing key support at 106.9K–107K and the 200 EMA.
📉 Sell on pullback around 108.2K–108.6K
📉 Alternative: Sell stop at 106.3K if breakdown continues
📈 Aggressive bounce possible at 106.9K, but high risk
SL & TP based on key S/R zones
Always apply solid risk management 🚨

BTCUSDT – Ready for the Next Leg Up?Bitcoin is currently consolidating around $107,000 after a strong rally from the ~$73,000 region. I'm using Fibonacci extensions and key support/resistance levels to anticipate potential continuation targets and pullback zones.
Technical Analysis:
Fibonacci retracement levels from previous move:
0.786 – ~$102,359 → strong local support
0.618 – ~$96,382
0.5 – ~$92,185
Current price: ~$106,990
Key resistance: ~$109,971 (Fib 1.0 level)
Potential bullish targets:
1.618 extension → ~$131,956 (medium-term target)
2.618 extension → ~$167,530 (long-term projection)
Bullish Scenario:
If BTC holds above the $102K–$104K area, we could see continuation towards $110K, followed by a breakout toward $132K (1.618 Fib). The structure remains bullish as long as higher lows are maintained.
Bearish Scenario:
A break below $102K opens the door for a deeper retracement toward $96K or even $92K, which aligns with 0.618 and 0.5 Fib levels, respectively.
Conclusion:
Bitcoin is sitting at a critical point. A short-term dip might offer a strong buy-the-dip opportunity. The market structure still favors the bulls unless key support levels are broken.

$BTC - Possible CME Gap FillBINANCE:BTCUSDT | 4h
Watching 106.2k-106k for a potential bounce taking those singleprints/imbalances.
However, if 108.3k rejects, CME gap below likely gets filled around 104k to 102k zone (pink squiggly)

BTC/USD: More Bullish MOVE Ahead? (READ THE CAPTION)By analyzing the #Bitcoin chart on the weekly timeframe, we can see that the price has finally reached our expected level of $111,880, setting a new all-time high.
Currently, Bitcoin is trading around $110,800, and if it manages to hold above this key level, we could expect further bullish movement.
The next potential targets are $130,000 and $163,000, respectively.
Please support me with your likes and comments to motivate me to share more analysis with you and share your opinion about the possible trend of this chart with me !
Best Regards , Arman Shaban

BTC 12.06.25After BTC avoided the last supply there is on the chart since monday, i would expect a reaction as soon it comes in there. There is also a big area of range demand below where i am looking for a bullish reaction. My main focus is at the range high since i still have this HTF distribution scenario in mind and we are right in the first deviation of it.

Bitcoin H1 BreakdownPrice swept 110K with weak volume → no follow-through → sharp rejection.
Now testing 200 EMA near 107K.
Lose it → 105.2K / 103.7K next.
Hold it → bounce to 110.6K likely.
Classic liquidity trap + momentum unwind.


Bitcoin Probabilistic Analysis in the 4-Hour TimeframeIf Jerome Powell lowers interest rates today, we will likely see this trend.
Based on MAKER buy/sell signals and the High/Low of the EMA 200 indicator.

When will #BTC hit a new high?📊When will #BTC hit a new high?
🧠From a structural point of view, we have come to the weekly resistance zone, so it is very reasonable to consolidate sideways here. Only if we successfully break through the resistance here and stabilize above the resistance zone, can we remain optimistic.
➡️The short-term support is around 108800. If we can hold here, then we have the opportunity to build an ascending triangle, which means that we will continue to hit new highs soon, otherwise we need to be alert to the occurrence of a pullback.
➡️106500-107000 is the conversion area of resistance and support, and it is also the psychological defense line of long transactions. If we can't hold here, then we need to be alert to the occurrence of in-depth adjustments.
⚠️Currently in a complex consolidation stage, we need more patience!☕️
🤜If you like my analysis, please like💖 and share💬 BITGET:BTCUSDT.P

Bitcoin (BTC): Sellers Taking Over | Re-Test of Important ZoneWe are dropping hard, where after a clean breakout price is heading now back to the retest area, which will determine the next major movement from here on.
What we are seeking is a successful re-test (which then would trigger our buyside scenario), but if we see that sellers will keep the pressure and take over the control near current region, then we might be looking for slight dip towards the 200EMA line ($104,500)
Swallow Academy

Bitcoin Showing Bullish Intentions as Selling Pressure Weakens📈 Bitcoin Showing Bullish Intentions as Selling Pressure Weakens
In the last three 4H candles, we’ve seen a decline in volume alongside smaller candle bodies, even as the price has moved slightly lower. This typically signals weakening selling pressure and increasing bullish interest.
As long as price doesn't print a lower low below $105,500 and fails to break above $110,246, Bitcoin is likely building structure for a potential bullish breakout. If the current level holds and BTC begins to rally from here, the new higher low would likely be around $107,000 — reinforcing the bullish trend structure.
🧠 Key Insight: Wait for a clear long trigger before entering; the market is currently in a cool-off phase, not a reversal.
Btcusd sellBtcusd sell
Use proper risk management
Trump and Elon musk
#btcusd #trump #Elon
Falling low from initiate head and shoulder.

4H Timeframe BTCUSDT Bullish Rally Setup (Buy Limit Order)This analysis provides a deeper breakdown of the previous setup, now viewed on the 4-hour timeframe. It offers a closer look at price action using 4-hour candlesticks to refine entry points and confirm the buy limit strategy for the upcoming bullish rally.

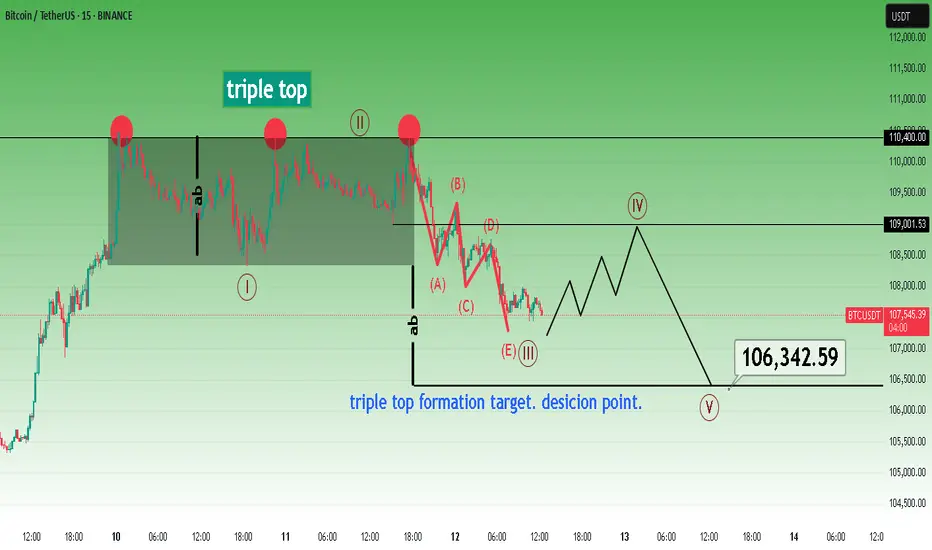
Bitcoin short term triple top pattern target.The most likely scenario in my opinion.
* The purpose of my graphic drawings is purely educational.
* What i write here is not an investment advice. Please do your own research before investing in any asset.
* Never take my personal opinions as investment advice, you may lose your money.
The Next BTCUSDT Bullish Rally Setup (Buy Limit Order)BTCUSDT has been in a long-term bullish trend and continues to maintain its upward momentum. Currently, the price is undergoing a minor pullback as it retests a key resistance level. Once it reaches the previous minor support zone, I expect the bullish trend to resume.
To take advantage of the next bullish move early, consider placing a buy limit order at that earlier minor support level. For proper risk management, set a stop loss slightly below the support area.
Everything is clearly illustrated on the chart provided.

$BTC/USDT MAJOR PUMP? or MAJOR DUMP?BTC, the worlds biggest and fastest growing coin. With a market cap in the Trillions, we are facing a major moment.
Will price dump? or will it pump and go above and beyond.
Lets find out in this analysis!
1. Trend Overview
HTF Bullish:
Price remains above the long-term bullish trendline, showing strong macro support.
Recent price action is consolidating within a major supply zone and liquidity cluster — signaling indecision before a breakout or breakdown.
📈 2. OBV (On-Balance Volume) Analysis
OBV is coiling in a symmetrical triangle, indicating a volume squeeze.
This tightening range typically precedes a major breakout or breakdown, matching the price consolidation near resistance.
🔄 Market Structure
Price has formed a potential top just under the supply/liquidity zone (~$110,000–$112,000).
Swing High is defined just below $112K.
Key structure zones are:
Resistance zone at current levels.
Support zones:
1D FVG ($97K) and Weekly FVG ($87K–$93K)
🟪 Supply & Demand Zones
Supply Zone: $100k - $112k — multiple rejections here indicate this is a key short-term ceiling.
Demand Zone: Deep support between $50-$57K, aligns with trendline and historical value area.
🔵 Fair Value Gaps (FVGs)
1D FVG: $97K area — may act as magnet if price breaks below resistance.
1W FVG: $87K–$93K — stronger structural level to watch.
If both are filled, price may meet the bullish trendline around $90K.
🧠 Liquidity Zones
Above current price: ~$112K is marked as a liquidity grab area — stop hunts may occur before major reversal.
Below: FVG zones could trigger a liquidity sweep downwards before reversal.
🔴 Volume Profile
Strong high-volume node (HVN) around $80K–$97K: acceptance zone, likely to act as magnetic support.
Above $110K is a low-volume node (LVN): if broken cleanly, price may accelerate quickly toward $120K+.
✅ Bullish Scenario
Break above $112K → sweep liquidity → continuation toward $120K–$125K. (Price Discovery)
OBV breakout upwards would confirm.
Hold above FVG 1D if retested = healthy bullish continuation structure.
❌ Bearish Scenario
Rejection at supply → drop to FVG 1D ($97K), then potentially Weekly FVG (~$93K).
If OBV breaks downward, it confirms bearish volume divergence.
Breakdown below trendline could target deeper into demand zone (~$70K+).
📌 Summary
Bias: Neutral-bullish short term, bullish macro (above trendline).
Key Breakout Level: $112K.
Critical Support: $91K–$97K (FVG cluster).
Confirmation: OBV breakout + clean structure break.
Invalidation: Weekly close below long-term trendline and FVG zones.

BTC weak wicks 🔎 Breakdown of Market Structure:
Triple Top Region (Resistance Zone):
Approximate level: $110,500–$111,000
Price failed to break this zone three times, forming rounded tops.
Sellers are heavily active here.
Neckline / Support Area:
The horizontal level price was bouncing from before breaking down: around $108,800
This area has now been broken, confirming the Triple Top breakdown.
Current Price Action:
Trading at $108,819, just below the neckline — indicating potential continuation to the downside unless a reclaim happens.

BTC USDT LONG TRADE SETUPBTC/USDT is currently holding at a strong support zone, with a high probability of an upward price move. Also 100 EMA is acting as support.

BTC Bias Update tug-of-war between key liquidity zones
• Liquidity Magnets:
• Upside: Identified Draw on Liquidity (DOL) at higher levels (e.g., 111,968.0 (4H), 111,340.3 (30m)) and an "Ongoing" BSL 4H at 110,0996.3 present resistance and potential targets for bullish moves.
• Downside: Prominent DOLs (e.g., 105,252.6 (2H), 103,463.9 (30m)) and a critical SSL zone between 100,500.0 - 100,000.0 (4H, 2H, 1H) act as significant downside targets.
Bias Assessment:
• Bearish Bias: 65%
• The immediate price action suggests a likely "Draw on Liquidity" towards the substantial Sellside Liquidity (SSL) zone around $100,000, consistent with recent minor bearish momentum.
• Bullish Bias: 35%
• The bullish case hinges on a potential strong reversal from the confluence of the $100,000 SSL and the powerful Bullish Order Block, which could then target the overhead Buyside Liquidity.

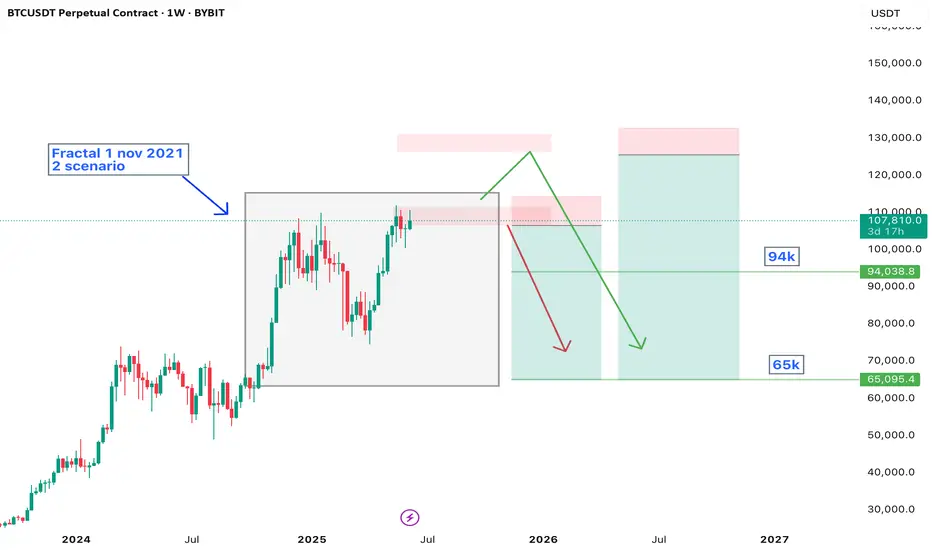
BTC game plan. 65k soon?This is my gameplan to trade Bitcoin.
Technically, there's 2 key zones to short with a nice Risk-Reward.
It's minimum profit reward on 94k, and possible to see 65k breakeven free trade.
Subscribe to earn more
Last week Bitcoin created massive liquidity at a key resistance!🚨 Bitcoin Update – A Bullish Storm Is Brewing? 💥
Last week, Bitcoin created massive liquidity at a key resistance zone, and guess what? That liquidity is still untouched. The market hasn’t fully tapped into it yet — and that’s a big deal.
Recently, BTC smashed through resistance and even left behind a Bullish Fair Value Gap (FVG), signaling strength. But hold on—after this breakout, the market is showing signs of a minor pullback, likely to retest its marked IRL (Important Reaction Level).
📉 It’s cooling off temporarily... but don’t blink. This zone could act as a springboard for the next big leg up.
💡 Here’s the kicker: there’s still a ton of liquidity waiting above. If the market wants it—and it usually does—there’s a high probability (80%+) of another bullish push.
👀 Watch this area closely. It’s a make-or-break zone.
📊 Do Your Own Research (DYOR) – this is not financial advice, just a friendly nudge from the charts.

$BTC end of cycleFirstly, as you can see by the red paint, Bitcoin loves to establish trendlines, by turning resisting into supporting trendlines.
Given this, market is still in a bull market & Market will continue to be so till this flips.
Green forecasting follows the above , the EW pattern and previous years correlation after entering euphoric areas (above mid blue trend).
Anywhere in those areas is good to sell & buy the white triangle next year.
