BTCUSDT: Bounce Incoming?BTCUSDT Technical analysis update
-March 2024 resistance is now expected to act as a strong support level.
-The price has touched the 0.618 Fibonacci retracement level, suggesting a potential reversal from this zone.
-The 200 EMA on the 2-day chart is positioned as a strong dynamic support, reinforcing the bullish case.
We can expect a bounce from the $72-75k level.
BTCUSDT.P trade ideas

BTC Flips Bullish Above $104k — 1D 50EMA & OB Cluster HoldCRYPTOCAP:BTC | #4h
Price reclaimed 1D 50EMA & $104k after a clean bounce from 1D FVG ($98k).
As long as $104k and the 4h OB cluster hold, lower targets are off the table.
Maintaining bullish bias toward $106k+.
Lose $104k? Bull plan is invalid, reassess for lower.

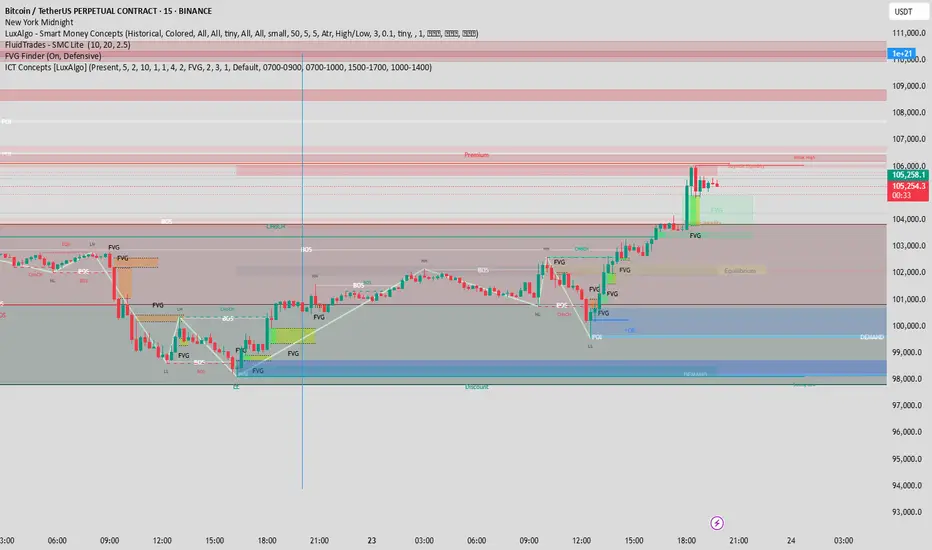
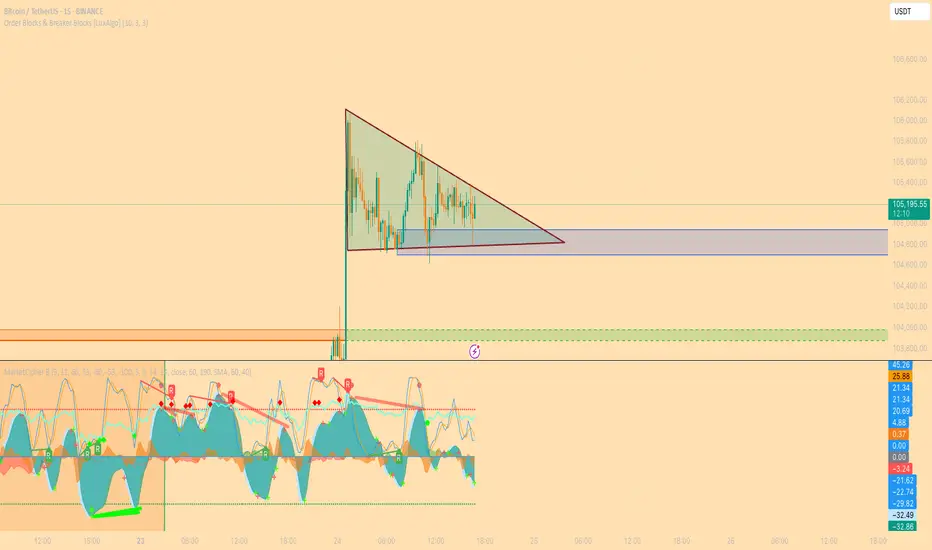
Breakdown: BTC/USDT 15m – Riding the Trend
🔹 Smart Money Confluences:
CHoCH at the bottom with a clear liquidity sweep (LL formed, then reversal)
Multiple FVGs aligned with structure—price keep respecting mitigation blocks
POI + OB near $99,800 gave the final long confirmation
BOS and strong HHs show clean bullish order flow
🟩 Premium/Discount Zones:
You entered at da discount, targeting premium—textbook ICT
Midline equilibrium held nicely before bullish continuation.
💡 Final Push:
Price is consolidating under weak high and buy-side imbalance.
Possible continuation if new FVG near $105k holds
🔔 Watch for:
Higher timeframe liquidity grab above $106k
Rejection near inefficiency = potential partial TP zone
Major Support Confluence, Tactical Rebound or Looming Flush?__________________________________________________________________________________
Technical Overview – Summary Points
__________________________________________________________________________________
Momentum: BTC is working a major daily support zone (102.6–103k USDT) with strong confluence across 1D, 12H, and 2H pivots. Technical rebound in play, but still no strong behavioral catalyst.
Supports / Resistances: Key support clusters at 102.3–103.3k (2H, 720min, daily pivots). Main resistances: 106.4k–110k.
Volume: Very high on 2H/1H near supports, hinting at possible washout/profit-taking. No buy climax identified.
Risk On / Risk Off Indicator: Strong bullish signal from 1D to 30min (neutral on 15min), while lower TFs remain under selling pressure.
Multi-TF Behavior (ISPD DIV): No excess or euphoria: market is waiting/compressed, caution is necessary in the short term.
__________________________________________________________________________________
Strategic Summary
__________________________________________________________________________________
Global Bias: Tactical bullish but cautious — confirmation on clean rebound needed to strengthen conviction.
Opportunities: Technical entries in the 102.6–103.3k zone with stops below 102k (aggressive) or 97.5k (defensive). Profit-taking zones at 106.4k/109.9k/110k.
Risk Areas: Invalidated below 97.5k (swing), potential flush down to 94k/88–89k. Heightened vigilance around macro releases.
Macro Catalysts: PMI prints (June 23), Fed on pause, increased geopolitical risks (latent volatility and cross-asset caution).
Action Plan: Prioritize active management: reduced position sizing, mechanical stops, and real-time bias adjustment based on volume and behavioral response.
__________________________________________________________________________________
Multi-Timeframe Analysis
__________________________________________________________________________________
1D–12H: Major supports (D Pivot Low 102626.8), structural uptrend, strong Risk On signal, but no behavioral/volume extremes.
6H–4H: Ongoing technical rebound, moderately high volume, support confluence, BUT short-term TF pressure remains.
2H–1H: Very high volume at support, possible local flush, but still no bullish behavioral confirmation—monitor for rapid volatility.
30min–15min: Tentative stabilization post-support absorption, no clear psychological excess, risk of further downside if rebound not confirmed; Risk On / Risk Off Indicator is neutral at 15min.
Summary: Bullish structural setup, but fragile micro dynamics—discipline and speed are key.
__________________________________________________________________________________
Fundamental & On-chain Overview
__________________________________________________________________________________
External factors: Fed on hold, US inflation slightly higher, robust economy, increased geopolitical risks (hot spots Israel–Iran, Ukraine–Russia). Latent risk-off sentiment but not yet materialized.
Calendar to watch: June 23, 09:45–10:00 UTC (US PMI & home sales).
On-chain: Low user activity, high institutional volumes, off-chain flow dominance, leverage high (mostly in stablecoins, limiting crypto-margined liquidation spirals), no euphoria or panic detected.
Risk/reward synthesis: Key technical buy zone 102.6–103.3k (stop < 102k/97.5k), targets 106.4k/109.9–110k. Below 97.5k: bearish bias, defensive risk management needed.
__________________________________________________________________________________
Final strategic synthesis
__________________________________________________________________________________
BTC remains "structurally strong but tactically fragile": major support confluence and bullish sectoral signal, but persistent micro selling pressure and macro/cross-asset uncertainty. Only entries on clear technical signals, mechanical stops and active risk management offer rational short-term setups in this volatile and compressed environment.
__________________________________________________________________________________

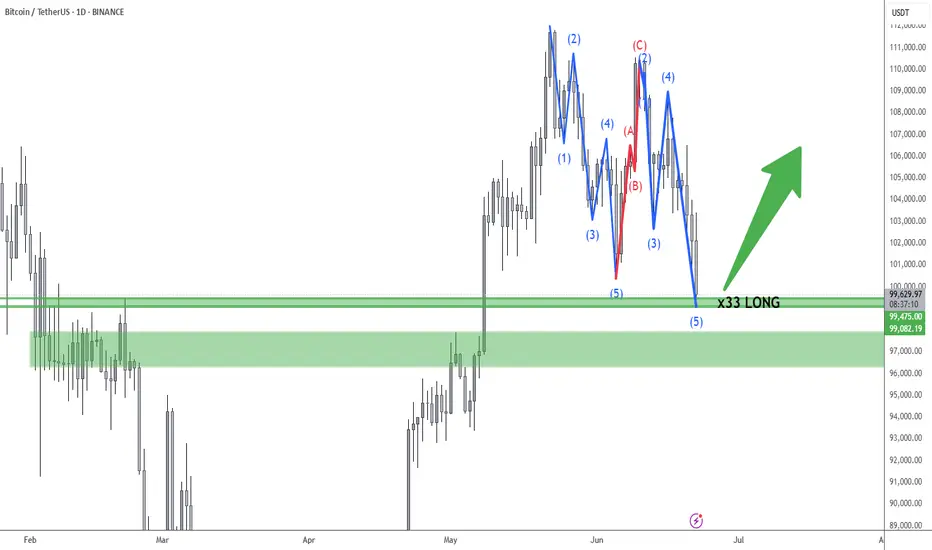
Long on Bitcoin. Bullmarket ahead!🚀 Entering a Degen LONG Position
I'm taking a calculated long here, with the 99.5k level acting as a key support zone.
✅ We’ve just swept the previous wick lows, grabbing a significant amount of liquidity that was resting below.
✅ The market has likely completed a clean ABC correction, with a nicely proportioned A = C structure — textbook move.
🧠 From a macro perspective:
The Iran war narrative appears to be fully priced in. At this point, only an extreme escalation (e.g. nuclear) could trigger a deeper selloff.
However, current geopolitical tensions may actually fuel bullish sentiment, as they give the FED more justification to pause or cut rates — a catalyst that could ignite the next impulsive leg of this bull market.
🤞 Fingers crossed — let’s see this rocket lift off.
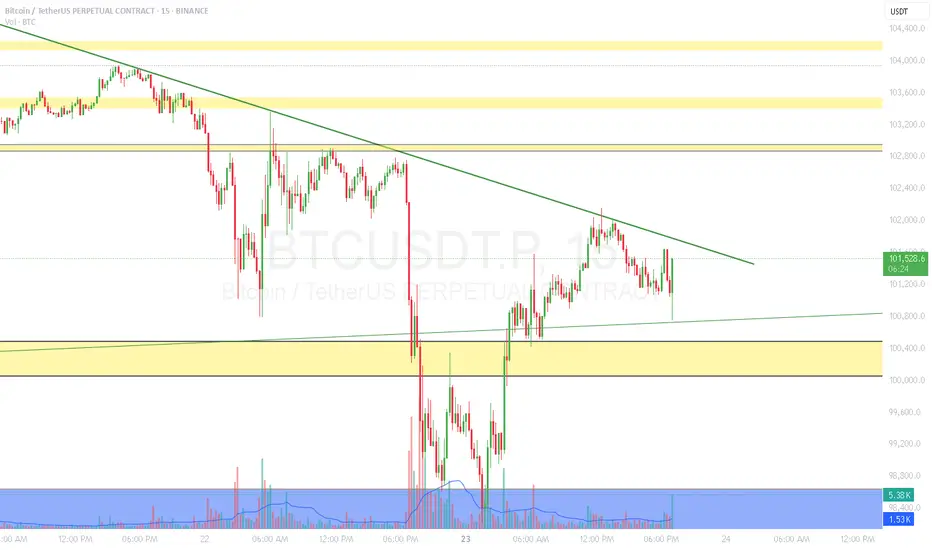
Where is the local bottom? BTC has decided to dip further, retraced to daily support and is probably going for liquidity at 100.3k.

BTCUSDTBULLISH TREND
Major Zone = Yellow area
Can take entry on break of HH/
instant buy/
or any fib level 0.5 or 0.618
Sl is mentioned on the chart, you can adjust your tp's according to ur sl and entry.

Bitcoin Key $103K Supports Tested, Swing-Bullish Opportunity?__________________________________________________________________________________
Technical Overview – Summary Points
__________________________________________________________________________________
Strong bullish momentum on daily, fueled by the Risk On / Risk Off Indicator and MTFTI structure.
Major supports identified at $102,600 – $103,300, high confluence (4H, 12H, 1D).
Resistances clustered between $106,000 and $110,000 (240 & D Pivot High, W Pivot High).
Volumes generally neutral; no buyer/seller climax.
Directional trends diverge: overall swing remains bullish, short-term intraday still corrective.
__________________________________________________________________________________
Strategic Summary
__________________________________________________________________________________
Global Bias: Structured bullish as long as supports >$102,600 are preserved.
Opportunities: Longs on retest of major supports, favoring daily/4H trend-following. Reactive shorts only on rejection at $104,500–$106,000.
Risk zones: Below $102,600 = structure break. Prioritize cash/hedging.
Macro catalysts: Waiting for September FOMC. Monitor geopolitical risks (MENA).
Action plan: Gradual entries on pullbacks, disciplined stops below pivots, prudent sizing outside confirmed breakouts.
__________________________________________________________________________________
Multi-Timeframe Analysis
__________________________________________________________________________________
1D & 12H : Bullish trend confirmed by the Risk On / Risk Off Indicator and MTFTI. Major supports intact ($102,600–$103,300). Volumes neutral, market in wait mode. Swing long favored.
6H & 4H : Upward momentum, no significant bearish signals. “Buy the dip” valid above support; healthy structure as long as key levels hold.
2H, 1H : Early micro-divergence signals (MTFTI Down short term), increased caution. Favor entries on confirmed correction or breakout only.
30min, 15min : Intraday correction, neutral/bearish volumes, aggressive long setups discouraged. Scalping only on exhaustion spikes, strict stops.
ISPD DIV summary : No excess/panic, mature consolidation/range context.
Risk On / Risk Off Indicator summary : Bullish across all TF except very short-term (>15min neutral).
__________________________________________________________________________________
Fundamental & On-chain Synthesis
__________________________________________________________________________________
Fed: status quo, US macro softening, market waiting.
Geopolitical tensions: potential for increased volatility.
On-chain: institutional predominance, low network pressure, no panic selling or retail euphoria.
Off-chain: high derivatives volume, OI > $96B. Squeeze risk if catalyst emerges.
__________________________________________________________________________________
Decision Matrix – Execution Plan
__________________________________________________________________________________
Swing Long: Entry $103,200 – $103,800, stop <$102,400, target $107,000+ (RR>2:1)
Scalping Short: On confirmed rejection $104,500 – $106,000, stop >$106,400, target $103,400 (RR>1.5:1)
Strict risk management below major supports, position proactively on volatility/news.
Cash/out below $102,400 or with major geopolitical headlines.
Stay flexible; alternate range-buy/take profit until breakout volume or FOMC news.
__________________________________________________________________________________

BTC AT DEEP CORRECTION Price failed to break and hold above 111,000, forming a double top or potential lower high structure. Strong bearish drop from 111,000 to 103,500, showing momentum shift to the downside. Likely stop-hunt or liquidity grab below prior lows , Next move will depend on whether it breaks above 107k (bullish) or drops below 103k (bearish).
Why BTC hasn’t moved up recentlyBTC has been bobbing above and below this bearish triple crossover the past few months. What we see as consolidation is rather price getting stuck around these resistance levels.
The only reason why this would be occurring in my view, is due to the market makers having intention to allow this drop to play out.
The resistance is located at around 107,000 to 107,400 - watch this zone closely for a hold below / rejection and fast drop.
Scenario 1 marked with solid red line.
Scenario 2 marked with dotted red line.
Little update for y’all. Happy weekend trading.

Forecast for BTC. New ATH on July ? In my opinion , BTC have 2 scenario .
1. Price will retest area 104-106k and retest previous ATH and then go up
2. Price will retest area 98-104k and retest previous ATH and then go up
3. In my opinion , BTC will not go down below 100k .
Now BTC can make a bullish flag pattern , but not valid yet
But anything can happen , so DYOR

bearish engulfing candleA bearish engulfing candle is a two-candlestick pattern in technical analysis that suggests a potential reversal of an uptrend to a downtrend. It consists of a small bullish (white or green) candlestick followed by a larger bearish (black or red) candlestick that completely engulfs the body of the first candle. This pattern indicates a shift in market sentiment, with selling pressure overpowering buying pressure and potentially leading to lower prices.

BTCUSDT: Bullish Outlook Following Liquidity Sweepnavigating around pivotal areas defined by Breaker Blocks (BB) and Fair Value Gaps (FVG) on both the 1-hour and 2-hour charts. These zones represent high-probability areas for market reactions, whether as support for continuation or as points for potential short-term retracement before a larger rally.
strongly favors a bullish continuation for BTC. monitor interactions with the identified BB/FVG zones for optimal entry points, anticipating a potential dip to sweep short-term BSL or mitigate imbalances before the next significant leg up.

Title: BTC at the Upper Trendline – Breakout or Breakdown IncomiTechnical Analysis (4‑Hour Timeframe)
🔺 Upper Trendline Resistance: BTC is touching the upper line of a descending channel—firm resistance around 107.5k–108k.
📉 Bearish Pressure: Failing to break out here could trigger a downward move.
🔻 Key Support: A decisive break below 99.5k–100k opens the path to 98k–95k, and potentially down to 92k if trend weakness persists
🔺 Bullish Scenario: If BTC closes above 108k on 4h, it could rally toward 110k–112k
binance.com investopedia.com binance.com
.
Geopolitical volatility (U.S.–Iran/Israel tensions) drove BTC briefly below 99k, low of 98.2k, before bouncing back near 101.2k
Volume & momentum: RSI dropped with the dip; watching volume near critical levels like 107k–108k is key


BTC midterm plan possibility
The current Bitcoin chart shows a P.O.3 pattern formation. Looking at the price targets, we can see a clear path to $100,000, which stands as a major psychological price level. The ongoing A-B-C pattern structure supports this price movement. If Bitcoin successfully breaks through the $100k level, we could potentially see an extension to around $120,000. After January, there's a strong possibility of a bullish trend that could help reach these targets, though this remains speculative and uncertain. Market movements depend on various factors, so always do your own research before making any investment decisions.This is one of the scenarios.Other way is going beyond 85k strongly and make pull back or continuation pattern (sideways)after that reach 100k.

15 Min Bullish BTC pennant 15 minutes before POWELL testimonySelf-Explainatory. let's see if this LTF pennant works!
Bitcoin Holding Above $100K – Bullish Bias IntactIn my previous analysis, I mentioned that a daily close below $100K would trigger a short bias. However, price closed above the $100K level, sweeping liquidity and rejecting the downside.
This move invalidates the bearish setup and confirms a bullish continuation. Market structure remains intact, and we're now looking for potential long setups on retests or pullbacks.
Key Points:
Liquidity sweep below $100K
Daily close above key support
Bullish structure remains valid
Watching for continuation targets and retests
📍 Stay patient and follow price action. Structure never lies.
#BTCUSD #Bitcoin #CryptoAnalysis #LiquiditySweep #BullishContinuation #PriceAction #TechnicalAnalysis #TradingView #CryptoTA

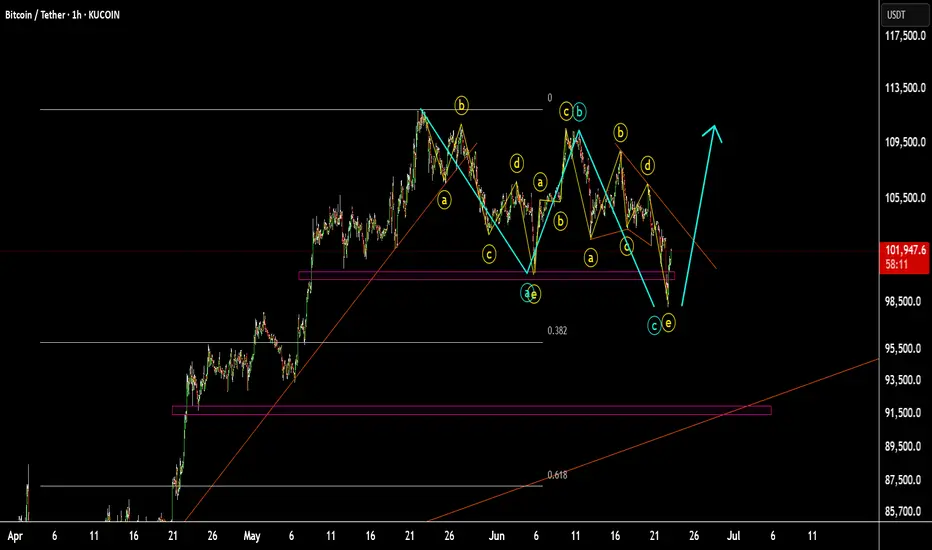
BTCUSD scenario 2#BTCUSD scenario 2 is waiting for 3 (TOP) High and then start to move down again.
scenario 1 is ZIGZAG pattern.
I dont buy at this time.
23/06/25 Weekly OutlookLast weeks high: $108,948.76
Last weeks low: $103,569.91
Midpoint: $98,191.05
Last weeks chart is a clear reflection of what happens when there is a constant stream of bad news... Geo-political escalations, America becoming more involved in the Middle-east and the FED refusing to cut interest rates.
It's well known markets do not like uncertainty, and throughout the week more and more questions have been asked with very few answers. Risk-on assets have taken a hit generally and BTC is no different, especially over the weekend. This price action should be taken with a pinch of salt as the volume is never as high as it is during the week and often it paints a false picture of how the market really feels. The market makers ultimately are just, over the weekend they often aren't involved and so I think we will know more accurately how much of this geo-political escalation is priced in by the end of the trading day. How the SPX reacts will be important too.
The FED once again refused to cut interest rates, it's clear president Trump is not happy with this. The market could have done with a cut but that will have to wait.
So for Bitcoin it's been a tough week and I can't see this getting better immediately. Bearish price targets for me would be $97,000, the short term trend is clearly biased short until some solid support comes in or something drastic happens in the political world for good. This week is about survival and caution while looking for opportunities to present themselves without knife catching.
Good luck this week everybody!


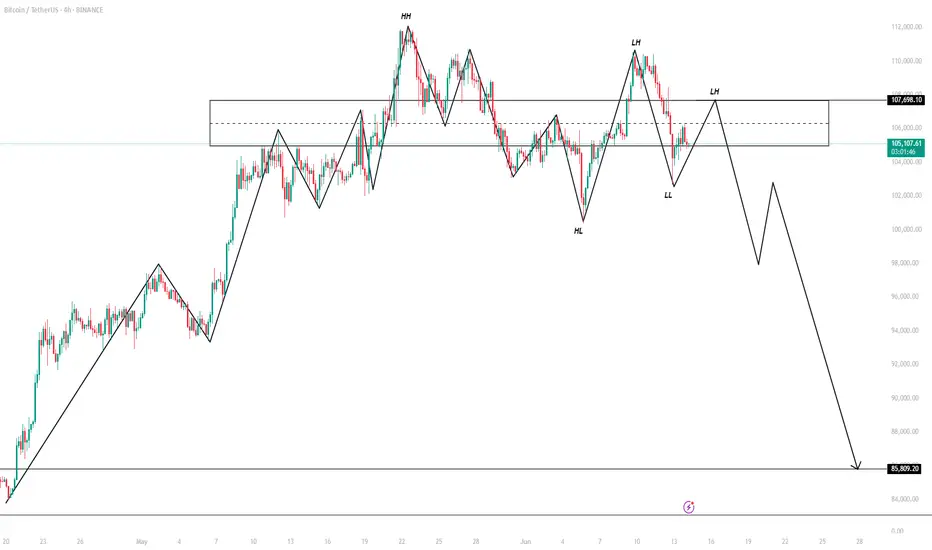
Lower highs / lower lows BTC....what will happen next?History doesn't repeat itself, but it certainly rhymes. Let's look at the BTC chart: lower highs, lower lows from double top. What have we seen in the past -> significant drops. Personally, I'm all for innovation and technology, but make no mistake that institutions are not blindly buying at the top and BTC is veering away from it's core principles after the financial crisis (there's still a middle man!). With this level of volatility and automated trading, there is bound to be a major pull back and it's starting to crack. Economic numbers are not horrible, but they are "lagging." Unemployment is not great with more layoffs being announced every day, interest rates are still high, unsecured debt is ultra high, and affordability is at 30-40 year low. Don't let the champagne effect of S&P fool you, things are NOT rosy!
Always do your own due diligence and all the best!

bitcoin update btc struggling to hold the 100k position market is choppy in lower tf but on higher tf its clearly shows sign of tapping below. with a double top on 3d tf, and breaking down of it will push long term holder book profits and with increasing tension in iran and usa 90k looks good support and as i mentioned previously about the cme gap in that area which works asa magnet for btc.
thanks