BTCUSDT LONG POSITIONENTRY: 106206.92
TAKE PROFİT : 109798.83
STOP LOSS : 1/3
Do not use high leverage!
Remember cash management (planning)!
Please follow the stop-loss rule!
BTCUSDT.P trade ideas

btc 150/160 kSeveral key factors contributed to Bitcoin’s dramatic rise to $150,000:
Institutional Adoption: Major financial institutions, hedge funds, and even governments have started to invest in Bitcoin, seeing it as a hedge against inflation and economic instability.
Limited Supply: With only 21 million bitcoins that will ever exist, scarcity plays a major role in driving up demand and price.
Geopolitical Instability: As traditional currencies face pressure from inflation and political uncertainty, investors turn to decentralized alternatives like Bitcoin.
Public Trust and Awareness: Widespread education and acceptance of cryptocurrencies have led to more retail investors entering the market.

bitcoin bullish and bearish BINANCE:BTCUSDT.P
bullish
🔹 Technical analysis according to Elliott waves (time: 1 hour)
📌 The pattern shown on the chart shows a complex structure that includes a complex correction within the larger wave (B), and the following is clear:
🔸 Main waves:
Wave (1) up from the bottom has been confirmed.
It was followed by a corrective wave (2) that ended near the 0.786 Fibonacci level = 102,575.
Then the upward wave (3) started, and it seems that it has been completed or is about to be completed.
🔸 Current status:
The price is currently moving within a small corrective wave, likely wave (4).
Current major support is located at: 🔸 102,275.7 (very important level) 🔸 100,317.6 (in case the correction extends)
🔸 Critical resistance areas:
For the bullish scenario to be valid, the resistance must be broken:
106,759 (0.618 Fibonacci ratio)
108,948 (0.786 – peak of wave C)
---
🔹 Important technical points:
🔸 The last correction (A)-(B)-(C) shows a clear triple structure, indicating that wave (2) has been completed.
🔸 The price is currently bouncing off the 0.5 - 0.618 Fibonacci levels (104,402 - 104,923), which reinforces the possibility that wave (2) has actually ended, and that we are currently starting an upward wave (3).
---
✅ Conclusion:
✅ As long as the price is above 102,275, the upward scenario through wave (3) remains valid.
⚠️ Breaking 100,317 indicates the failure of the bullish scenario and a structural shift in the waves.
🔻 Alternative (Bearish) Scenario – Short-Term:
If the price fails to maintain the current support at 102,275, we may not be in wave (4) but rather at the beginning of a new downward wave within a broader corrective scenario, as follows:
---
🔸 Wave Interpretation:
🔹 Wave (B), which completed at the peak near 108,948, likely marked the end of an upward correction.
🔹 The current downward wave from that peak could be:
Either wave 1 of C within a larger correction,
or the beginning of wave (C) within a bearish (A)-(B)-(C) pattern.
---
🔻 Potential Downside Targets in This Scenario:
1. Breaking 102,275 = Confirmation of the beginning of a new downward wave.
2. First Target:
🔸 101,484 (1.618 Fibonacci Extension – Wave 1 Expected)
3. Second and Stronger Target:
🔸 100,317 = Previous Major Support, Representing an Important Structural Test Area.
4. Third and Most Extreme Target in This Scenario:
🔸 98,800 – 99,260 = Possible Wave C Extension (Corresponds to a Larger Downside Scenario).
---
⚠️ Failure Signal:
Remaining below 105,926 (Previous Sub-Wave Resistance) maintains selling pressure.
Any weak bounce and lack of a clear wave 5 upwards = an additional sign of bearish dominance.
---
🔻 Conclusion:
✳️ The bearish scenario assumes that the peak at 108,948 was the end of corrective wave (B), and that we are now in a downward wave C targeting areas between 101,400 and 99,200, and possibly lower.
✳️ A break of 102,275 would be key to activating this scenario.

btc short setupSL 10500
tp 102500
with ongoing world events and liquidations available at that range, its very much possible that bitcoin will and must tap 102 or lower for a creating fear and wiping retailers out. But short with caution might give fake outs to trap longs.
thanks
BTC has made the perfect market conditions for a trade. BTC setup is very clear. Why? Because the structure is clear. The current price is an inflection point; both bears and bulls are watching to make their next move. May the strongest of the two prevail. 95k or 110k?
Full TA: Link in the BIO
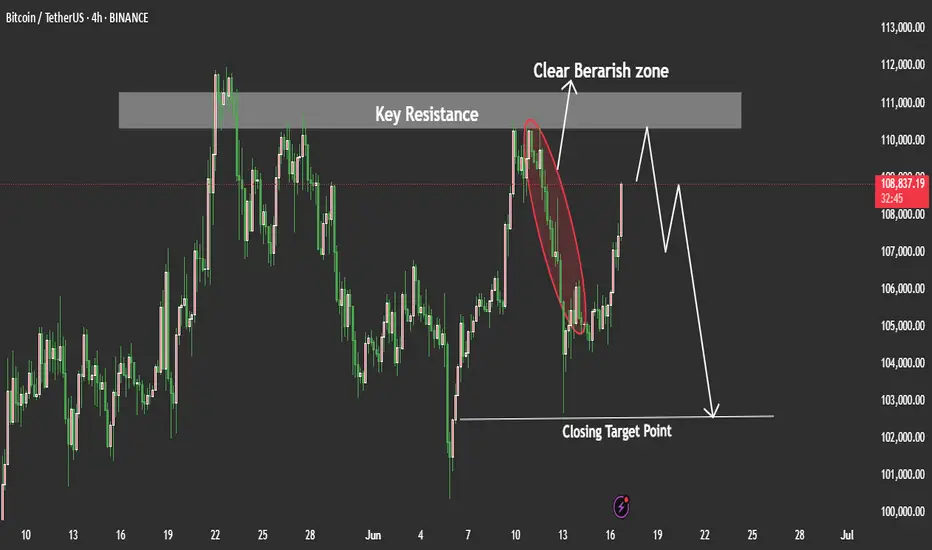
BTC ANALYSIS (4H)Last week, Bitcoin made a sharp bullish move upward, aiming for retail liquidity, which made the forecast path more difficult.
The green zone is a support area where Bitcoin might react.
To collect the ATH liquidity, Bitcoin needs to break through the red zone.
Let’s see what happens | when the market direction isn’t clear, there’s no need to take unnecessary risks.
For risk management, please don't forget stop loss and capital management
Comment if you have any questions
Thank You

Technical Analaysis Setup – #BTC/USDTTechnical Analaysis Setup – #BTC/USDT
#Bitcoin is currently forming a bearish harmonic pattern indicating a potential correction toward key support zones.
📉 The price action suggests the development of a Gartley pattern with projected downside targets around $103,679, $101,931, and possibly extending to $97,419.
A critical resistance zone between $105,000 and $106,000 will be pivotal for either confirming bullish momentum or triggering a bearish reversal.
If BTC fails to break through this resistance and confirms the bearish reversal signal, a deeper decline toward the aforementioned support levels becomes highly probable.
🎯 Target 1: $103,679
🎯 Target 2: $101,931
🎯 Target 3: $97,419

Iran-Israel Political Tension & End of Crypto marketDo geopolitical tensions truly cause markets to crash or pump?
In a world where financial safety is more fragile than ever, how do traders react?
This analysis dives deep into how pro traders think and act during critical moments.
Hello✌
Spend 3 minutes ⏰ reading this educational material.
🎯 Analytical Insight on Bitcoin:
Bitcoin is experiencing a fear-driven shock amid escalating geopolitical tensions, triggering potential downside volatility toward the $98K level 📉. Despite this risk-off sentiment, the broader market structure remains intact, and I maintain a bullish bias. A recovery from key support zones could pave the way for a renewed breakout above $100K in the mid-term .
Now , let's dive into the educational section,
🧠 Fear, Safety or Opportunity? Trading Psychology in Crisis 🧨
Markets don’t move based on headlines—they move based on how the crowd feels about those headlines. Political tension triggers emotional responses, especially panic selling.
However, experienced traders spot opportunities while others flee.
In such moments, two emotional extremes dominate:
🔸 Fear of losing capital (FUD)
🔸 Greed to seize a rare opportunity (FOMO)
Both are dangerous if uncontrolled. Tools like RSI and Fear & Greed Index (via external APIs) can provide rough estimates of market sentiment and potential turning points.
📊 Practical TradingView Tools for Analyzing Crisis-Driven Markets 🔍
When global tension spikes, the markets reflect collective emotion like a mirror. During uncertain times, smart traders rely on tools that turn raw data into sharp insights. TradingView provides several features that become extremely useful in times of high uncertainty:
1. Crypto Volatility Index Proxy (using ATR + Bollinger Bands)
These indicators help detect when the market is driven more by fear than logic. They show increasing volatility levels as tensions rise.
2. Sentiment Indicators – Funding Rate & Long/Short Ratios
These metrics, pulled from major exchanges, show whether traders are overly bullish or bearish. A sudden imbalance usually hints at insider expectations or fast-breaking news.
3. DXY and Gold (XAUUSD) Side-by-Side with BTC
Analyzing Bitcoin’s performance alongside USD and gold gives insight into whether investors are going risk-off or seeking crypto as a hedge.
4. Volume-Based Indicators – OBV & Volume Profile
While headlines can lie, volume doesn’t. These tools highlight areas of serious buying/selling interest and help identify where smart money enters or exits.
5. Multi-Chart Layout Feature
TradingView allows you to analyze multiple assets together—BTC, gold, oil, and stock indices like S&P 500—on one screen. Perfect for understanding macro capital flow during geopolitical events.
💣 Interconnected Markets During Regional Conflict 🌍
Crypto often acts like a risk-on asset during global crises. If traditional markets fall, Bitcoin may follow—unless it’s being viewed as a safe haven.
That’s why watching DXY, gold, and oil charts alongside BTC is crucial.
Understanding these correlations using TradingView’s comparison features gives you a better sense of where capital is flowing during uncertain times.
⏳ What Traders Should Focus on in Crisis Mode 💼
1. Focus on chart confirmations, not news hype.
2. Use multi-dimensional analysis with TradingView.
3. Prioritize risk management more than ever.
4. Cash is a position. Sometimes the best move is no move.
5. Always have a backup scenario—no analysis is guaranteed.
📌 Final advice:
When headlines play with your nerves, data becomes your best ally.
With the right tools and a disciplined mindset, traders can navigate even the stormiest markets with confidence.
The market rewards the calm, not the reckless.
✨ Need a little love!
We put so much love and time into bringing you useful content & your support truly keeps us going. don’t be shy—drop a comment below. We’d love to hear from you! 💛
Big thanks,
Mad Whale 🐋
📜Please remember to do your own research before making any investment decisions. Also, don’t forget to check the disclaimer at the bottom of each post for more details.

#Bitcoin Roadmap for 2025–2026 A Deep Corrective Scenario UnfoldI believe the major top for Bitcoin was already printed on May 21st, at $111,000.
From here, I expect a three-wave corrective structure to unfold:
• 🔻 First drop to $69,000
• 🔼 Then a relief bounce to $85,000
• 🔻 Followed by a deeper decline to $46,000
If Bitcoin breaks the historical ascending trendline after reaching $46,000, I anticipate a five-wave bearish structure to continue:
• Further drop to $33,000
• Temporary correction up to $45,000
• And finally, a capitulation wave towards $19,000
I know this may sound early or even extreme to some, but if you review my previous Bitcoin outlooks going back to 2014, you’ll notice that many of these scenarios—however bold—have eventually played out with precision.
📌 Invalidation Level:
This scenario would be invalidated if Bitcoin closes a weekly candle above $115,000.
Good luck, fellow traders—stay sharp and prepared. 🧠📉
⸻

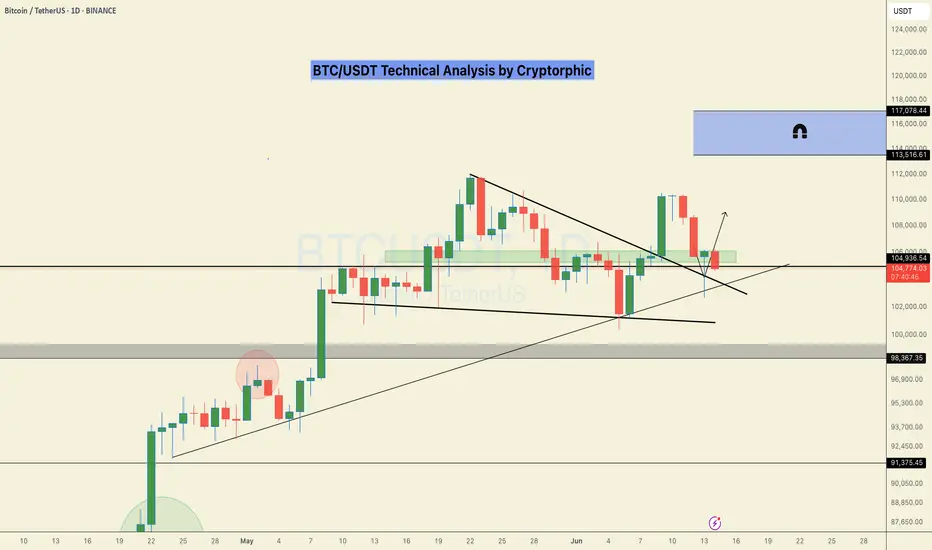
BTCUSDT Price may Test as Short TermBTC/USDT Price Analysis (Interpretation):
BTC/USDT recently tapped into a well-defined rejection zone on the 4H and Daily timeframes. This zone has previously acted as strong resistance.
Given this, we could expect a potential move to the downside unless the price breaks above that rejection zone with strong momentum. However, before the downside move fully plays out, there is a chance the price may retest the 102,500 level again — possibly as a liquidity grab or a false breakout — before resuming a bearish push. My Goal is 102,500 lets we see how how the price will plays out.
if you like tis idea and if you find good thing in this analysis share in comments we need support from you Guys.
#BTC Update Urgent. CRYPTOCAP:BTC Update:
Bitcoin is making another attempt to test the $102K support level.
Expecting a bounce around the 100k area if we reach there.
This level is holding strong, backed by two key EMAs and high liquidity concentration.
Just be careful with longs.
Monday’s pump faded quickly, a clear sign of weakness.
This is exactly why staying on the sidelines was the right call.
If you're holding stables, you're not losing in this volatility.
I’ll continue monitoring the price action closely.
It’s better to enter higher with solid confirmations than to gamble on local dips.
Altcoins are still struggling; stay cautious.
More updates soon.
Stay tuned.
Do hit the like button if you like it.
Thank you
#PEACE
I had a nightmare this morning.Recently, I published my analysis about BTC and found that BTC is following a rising channel and is being supported by fib retracement.
But unfortunately, BTC hasn't shown any remarkable movement so far, and came back again the the support area.
I feel this is not a good sign for BTC.
ON a weekly view, It May repeat its previous movement.
I am publishing my reservation about BTC, be careful about BTC.

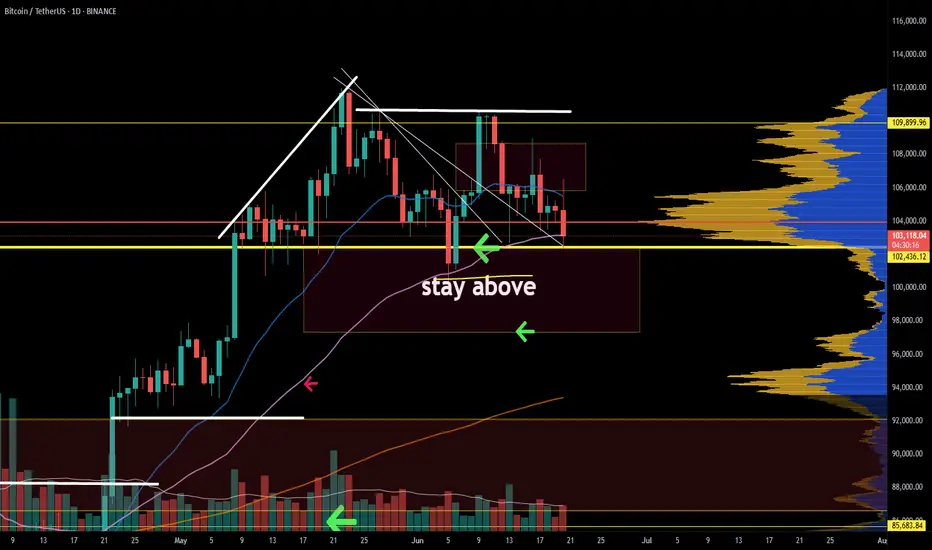
BTC Dips After ATH – $100K Support in Focus Amid TensionsBy analyzing the #Bitcoin chart on the weekly timeframe, we can see that after rallying to $111,980 and printing a new all-time high, price faced a correction down to $100,000.
Currently, Bitcoin is trading around $105,700, and with geopolitical tensions escalating, particularly the risk of war, we could see further downside — potentially taking price as low as $90,000.
However, if BTC manages to hold above the $100,000 level, there’s a strong chance we’ll see a short-term rally toward $120,000.
This analysis will be updated as the situation evolves. Stay tuned!
Please support me with your likes and comments to motivate me to share more analysis with you and share your opinion about the possible trend of this chart with me !
Best Regards , Arman Shaban

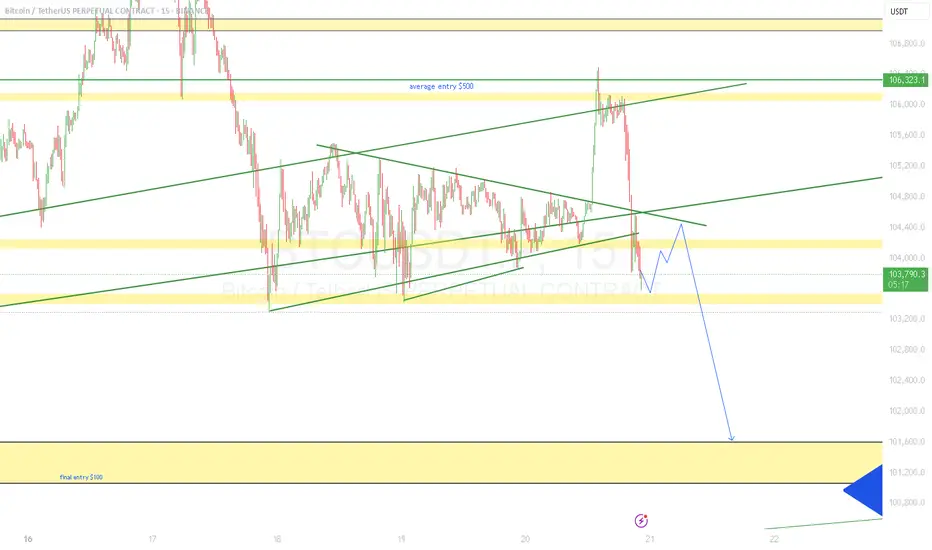
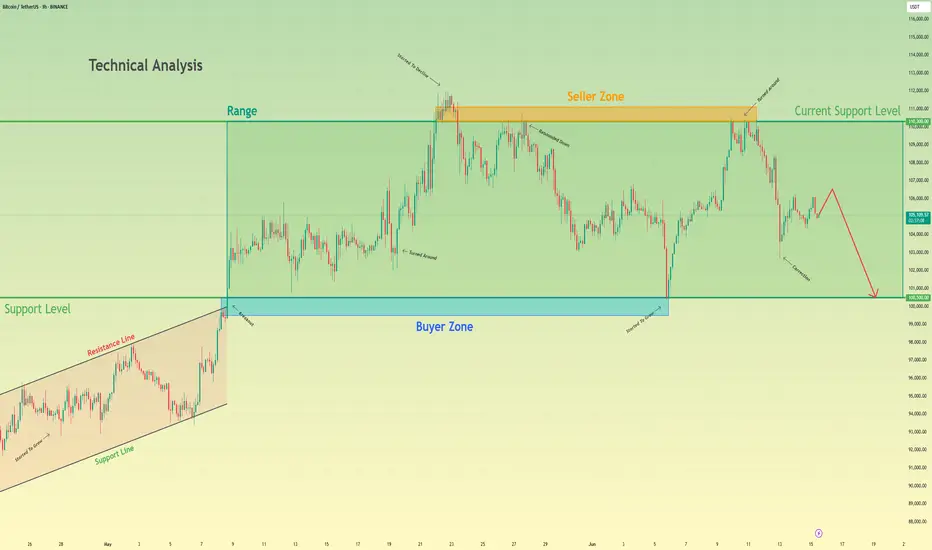
Bitcoin will make a small upward move and then continue to fallHello traders, I want share with you my opinion about Bitcoin. Earlier, the price was confidently growing inside an Upward Wedge, showing a series of higher highs and higher lows. This rising structure was supported by consistent momentum until BTC reached the seller zone between 110300 and 111100, where the growth slowed down and started to fade. From there, the price rejected this resistance and shifted into a Range, bounded by 100500 and 110300. BTC has been fluctuating inside this horizontal structure for some time, unable to break above the seller zone or below the buyer support. Now BTC is showing signs of weakness, forming a minor correction and struggling to reclaim previous highs. Given this structure and rejection from the seller zone, I expect BTC to make a small upward move and then start a decline toward the support level at 100500, which also coincides with the bottom of the range and acts as a strong psychological level. For this reason, I set my TP at 100500 points. Please share this idea with your friends and click Boost 🚀
$BTCUSD Predictions support line
Bitcoin traders, get ready for an epic ride! This chart shows BTC still has to hit the price target from the Cup & Handle breakout, pushing it toward a major channel resistance! Once it peaks, a bear market could kick in, driving prices down to the support line. Buckle up for the volatility ahead!

Bitcoin - Bears vs Bulls: $100k next?Price recently tapped into a well-defined 4H and daily resistance zone and was met with an immediate rejection. That rejection wasn’t just a reaction, it led to a confirmed market structure shift as price broke the previous low. This transition from higher highs to a lower low signals the first sign of bearish control, flipping the short-term bias and setting the tone for a move lower.
Retest of MSS and Inversion Fair Value Gap
After the break in structure, price retraced directly into the origin of the move, retesting the same zone where the shift occurred. A previously bullish 4H gap has now flipped into resistance, rejecting price perfectly. This inversion, where a bullish imbalance turns into a bearish reaction zone, confirms the change in direction and strengthens the downside narrative.
New FVG as Entry Opportunity
The latest bearish impulse created a clean new fair value gap just above current price. A retest of this gap would offer a high-probability continuation setup, as it aligns with both recent structure and order flow. This zone becomes the critical level for bears to defend, and unless price reclaims it, the expectation remains for continuation toward lower liquidity.
Liquidity Outlook and Bearish Target
Below current price, a large pool of liquidity is sitting just above a major psychological round number. That level hasn’t been swept yet and is a likely downside magnet. With no meaningful support between the current FVG and that draw on liquidity, price is likely to reach for it next. This fits the typical sequence following a market structure shift: rejection, shift, retest, continuation, and liquidity sweep.
Momentum and Contextual Confluence
Zooming out slightly, the current move fits within broader bearish momentum that has been developing across timeframes. There’s no sign of strong bullish absorption, and each push higher has been met with efficient selling. This isn’t a chaotic breakdown, but a controlled sequence of lower highs and lower lows, supported by clean structural shifts and consistent rejection zones.
Conclusion
The chart tells a clear story. A clean rejection from a key resistance zone led to a confirmed bearish structure shift, followed by a textbook retest and fresh fair value gap. As long as price remains below that gap, the setup favors continuation lower, with the nearest liquidity pool being the most likely draw. This remains a high-probability bearish scenario until proven otherwise by a shift back above invalidation levels.
___________________________________
Thanks for your support!
If you found this idea helpful or learned something new, drop a like 👍 and leave a comment, I’d love to hear your thoughts! 🚀

Bitcoin Will Continue Rising —Long-Term Chart —$200,000+ New ATHIn November 2021, the week after the all-time high was a crash. The weeks that followed were a continuation and the market went full red and didn't stop dropping until November 2022, a year later.
In May 2025, the week after the all-time high is neutral, sideways. Four weeks later and Bitcoin continues sideways consolidating near resistance, ready to break to new highs and continue rising.
Market conditions now are very, very different compared to 2021. Right now, we are only halfway through the current bull market, for Bitcoin, and we have room left available for plenty of growth.
In a matter of days, maybe 5-6 days, we get a new all-time high and this means not the end of the bull market but the start of the next and final bullish wave.
These targets on the chart are the most accurate of all numbers because they are based on almost 5 years of data.
Next target and minimum price for Bitcoin in the coming months is $155,601 but we know there is likely to be more, much more. With the institutional wave now in full force, banks opening to crypto because they have no other choice and the world evolving faster than anything we thought possible, we are aiming for $200,000 or more.
The next relevant level after $155,600 is $209,125. Which one is your target for this new 2025 all-time high?
Do you think Bitcoin will peak in late 2025 or early 2026?
Do you think you will manage to be successful in this round or are you bound to make the same mistakes? Over-trading, over-leverage, no being patient enough; not waiting for the right time to enter and not selling when the market is trading very high, greed; What will it be?
Do you think you have what it takes to succeed? You do!
Even if you made mistakes in the past or even if you are already doing good, you have what it takes.
If you are doing bad, this experience can be used to improve your game. If you are doing great, great, let's do better. There is never enough growth; we are happy, we are grateful but we accept abundance because we receive abundance thanks to hard work.
It is still very early but the market is starting to heat up. Once the bullish action starts, there is nothing that can stop us. The world will change for us. We will adapt to all market and geopolitical conditions, we will continue to improve and evolve.
The best one is not the one that makes no mistakes but the one that can extract learning from all experiences. Success is not being right all the time, success is never giving up.
Will you give up? Or, will you continue to trade long-term?
» Bitcoin is going up!
Namaste.

Bitcoin Strategic Interval, CME Dislocation and Macro Friction.⊢
𝟙⟠ - BTC/USDT - Binance - (CHART: 1W) - (June 17, 2025).
⟐ Analysis Price: $106,851.31.
⊢
I. ⨀ Temporal Axis – Strategic Interval - (1W):
▦ EMA21 – ($96,818.00):
∴ The current candle closes +10.3% above the EMA21, maintaining bullish dominance over the mid-term dynamic average;
∴ This is the 17th consecutive weekly candle closing above the EMA21 since its reclaim in February 2025, forming a structurally intact uptrend;
∴ No violation or wick-close below the EMA21 has occurred since April, and the distance from price to EMA21 remains within a standard deviation of mid-trend movement.
✴ Conclusion: The trend is active and preserved. EMA21 acts as dynamic support and bullish pressure zone. A reversion would only be expected if weekly closes return below $98K with volume confirmation.
⊢
▦ SMA200 – ($48,969.73):
∴ The 200-week simple moving average remains untouched since early 2023, never tested during the current cycle;
∴ The slope of the SMA200 is positive and gradually increasing, indicating a long-term structural trend recovery;
∴ Price stands +118% above the SMA200, a level historically associated with mid-cycle rallies or overheated continuation phases.
✴ Conclusion: The SMA200 confirms long-term bullish structure. Its current distance from price makes it irrelevant for immediate action but critical as the absolute invalidation level of the macro trend.
⊢
▦ Ichimoku – Kumo | Tenkan | Kijun:
∴ Price is above the Kumo cloud, with Span A ($107,172.16) and Span B ($98,562.38) creating a bullish tunnel of support;
∴ The Kijun-sen rests at $95,903.19, slightly below EMA21, and aligns with the last strong horizontal range;
∴ Chikou Span is free from historical candles, confirming trend continuity under Ichimoku principles.
✴ Conclusion: All Ichimoku components are aligned bullish. Pullbacks to the Kijun around $96K would be healthy within a macro-uptrend, and only sub-cloud closes would question this formation.
⊢
▦ Fibonacci - (Swing Low $49,000 – High $111,980):
∴ Bitcoin remains between the (0.236 Fibo - $97,116.72) and local top at $111,980, showing respect for fib-based resistance;
∴ The (0.5 Fibo - $80,490.00) has not been retested since March, confirming the range compression toward upper quadrants;
∴ Weekly price is consolidating under fib extension with decreasing body size, suggesting strength with pause.
✴ Conclusion: The Fibonacci structure confirms bullish extension phase. If $97K breaks, retracement to (0.382 Fibo - $87,921.64) is expected. Otherwise, the breakout above $112K enters full projection territory.
⊢
▦ MACD – (Values: 1,077.98 | 5,963.81 | 4,885.82):
∴ MACD line remains above signal line for the third consecutive week, recovering from a prior bearish cross in April;
∴ The histogram has printed higher bars for four weeks, but the slope of growth is decelerating;
∴ Positive cross occurred just below the zero-line, which often results in delayed reactions or failures unless reinforced by volume.
✴ Conclusion: MACD signals a weak but persistent momentum recovery. Reaffirmation depends on histogram expansion above 1,500+ and signal spread widening.
⊢
▦ RSI – (Close: 64.37 | MA: 57.56):
∴ The RSI is in the bullish upper quadrant, but without overbought extension, suggesting active buying without euphoria;
∴ The RSI has been above its moving average since mid-May, maintaining a healthy angle;
∴ Momentum is not diverging from price yet, but is approaching the 70 zone, historically a point of hesitation.
✴ Conclusion: RSI confirms controlled strength. Further advance without consolidation may trigger premature profit-taking. Above 70, caution increases without being bearish.
⊢
▦ Volume - (16.97K BTC):
∴ Weekly volume is slightly above the 20-week average, marking a minor recovery in participation;
∴ There is no volume spike to validate a breakout, which is common in compressive ranges near resistance;
∴ Volume has been declining since mid-May, forming a local divergence with price highs.
✴ Conclusion: Volume profile supports current levels but does not confirm breakout potential. A rejection with strong volume will mark local exhaustion.
⊢
II. ∆ CME Technical Dislocation – BTC1! Futures:
▦ CME GAP – BTC1! – ($107,445.00):
∴ The CME Futures opened this week at $105,060.00 and closed the previous session at $107,445.00;
∴ A clear unfilled gap persists between $105,060.00 and $107,900.00, with price action hovering just above the top edge;
∴ Bitcoin has a consistent historical behavior of returning to close such gaps within a short- to mid-term range.
✴ Conclusion: The unfilled CME gap acts as a gravitational technical force. As long as price remains below $109K without volume expansion, the probability of revisiting the $105K area remains elevated.
⊢
III. ∫ On-Chain Intelligence – (Source: CryptoQuant):
▦ Exchange Inflow Total - (All Exchanges):
∴ Current inflow volume remains below the 1,000 Bitcoin daily threshold, indicating no panic selling or institutional exits;
∴ This inflow level corresponds to accumulation or holding phases, rather than distribution;
∴ The pattern matches a neutral-to-positive mid-cycle environment.
✴ Conclusion: There is no structural on-chain pressure. As long as inflows remain low, risk of capitulation or distribution is minimal.
⊢
▦ Spot Taker CVD - (Cumulative Volume Delta, 90-day) – (All Exchanges):
∴ The 90-day CVD shows continued dominance of taker buys over sells, reflecting ongoing demand strength in spot markets;
∴ However, the curve is flattening, suggesting buyers are meeting resistance or fading interest;
∴ No sharp reversal in the CVD curve is detected — only saturation.
✴ Conclusion: Demand remains dominant, but the pace is decelerating. Without renewed volume, this curve may revert or plateau.
⊢
▦ Exchange Inflow Mean - (MA7) – (All Exchanges):
∴ The 7-day moving average of exchange inflow continues to decline steadily;
∴ This metric often precedes calm phases or pre-breakout plateaus;
∴ Historical patterns show similar inflow behavior before prior volatility expansions.
✴ Conclusion: A period of silence is unfolding. Reduced mean inflow suggests price is awaiting external catalysts for movement.
⊢
▦ Funding Rates – (Binance):
∴ Current funding rates are neutral, with slight positive bias, suggesting balanced long-short sentiment;
∴ No extreme spikes indicate absence of excessive leverage;
∴ This equilibrium typically precedes significant directional moves.
✴ Conclusion: Market is leveled. Funding neutrality reflects hesitation and prepares ground for upcoming directional choice.
⊢
IV. ⚖️ Macro–Geopolitical Axis – (Powell, Middle East & BTC/XAU):
▦ MACRO CONTEXT:
∴ Jerome Powell is scheduled to speak on Wednesday (June 19), with markets anticipating remarks on rate stability or future hikes;
∴ Ongoing tensions in the Middle East (Israel–Iran) elevate risk-off behavior in traditional markets;
∴ Bitcoin has triggered a rare Golden Cross vs. Gold, as noted by U.Today, signaling digital strength over legacy value.
✴ Conclusion: Macro remains the primary external catalyst. Powell’s statement will determine short-term volatility. Until then, Bitcoin floats between its technical support and CME magnetism, with gold dynamics providing long-term bullish backdrop.
⊢
⚜️ 𝟙⟠ Magister Arcanvm – Vox Primordialis!
⚖️ Wisdom begins in silence. Precision unfolds in strategy.
⊢

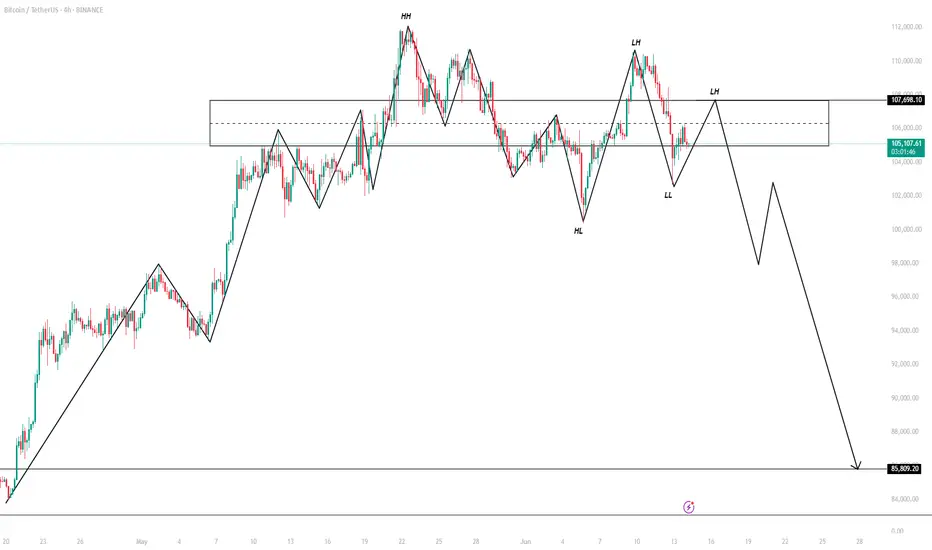
BTC AT DEEP CORRECTION Price failed to break and hold above 111,000, forming a double top or potential lower high structure. Strong bearish drop from 111,000 to 103,500, showing momentum shift to the downside. Likely stop-hunt or liquidity grab below prior lows , Next move will depend on whether it breaks above 107k (bullish) or drops below 103k (bearish).
BTC is Bullish!Hello TradingView Family / Fellow Traders. This is Richard, also known as theSignalyst.
📈BTC has been overall bullish trading within the rising channel marked in blue.
Moreover, the red zone is a strong structure!
🏹 Thus, the highlighted blue circle is a strong area to look for buy setups as it is the intersection of structure and lower blue trendline acting as a non-horizontal support.
📚 As per my trading style:
As #BTC approaches the blue circle zone, I will be looking for bullish reversal setups (like a double bottom pattern, trendline break , and so on...)
📚 Always follow your trading plan regarding entry, risk management, and trade management.
Good luck!
All Strategies Are Good; If Managed Properly!
~Rich

Bitcoin sell short go 50k Bitcoin is ready to correct towards $56,000 after the double-top pattern on the weekly time frame.

#BTC URGENT UPDATECRYPTOCAP:BTC Update:
Keeping it simple, yesterday’s daily candle printed a nice hammer, but today’s candle looks rough.
That said, things can flip fast in this market.
🔹 Close above previous day’s high: Trend remains intact
🔹 Close above $103,500K: Bullish structure holds
🔹 Break below $102,600: Bearish, could open the door to low $90Ks in the coming weeks
We’re stuck in a tight zone. It's best to stay patient until we get a breakout in either direction.
DYOR, NFA
Let me know what you think, and hit the like button if you like it.
Thank you
#PEACE
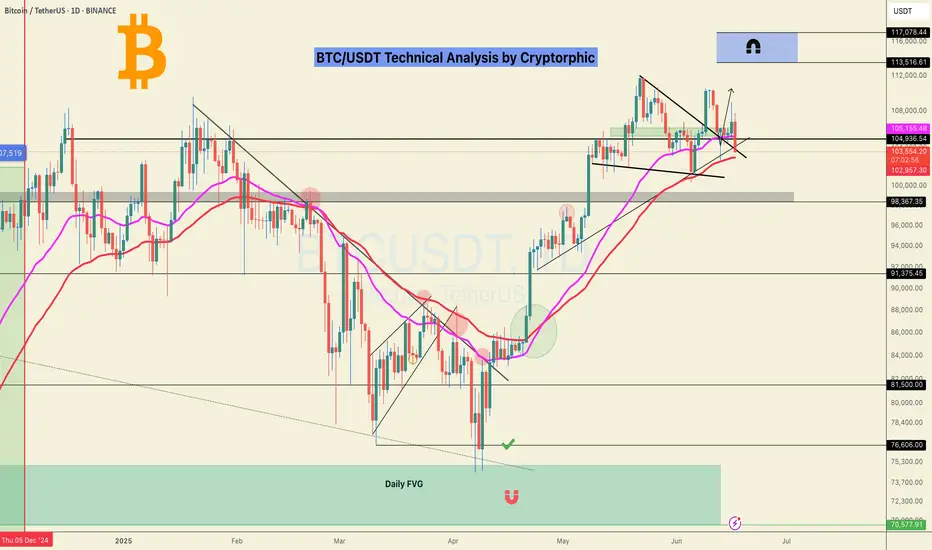
BTC/USDT Smart Money Roadmap | Daily FVG + ATH TargetSeenForex | ICT-Based Smart Money Analysis
Bitcoin is currently reacting within a Daily Weak Fair Value Gap (WFVG) after a series of liquidity sweeps ($$$). Price structure suggests two possible scenarios:
✅ Bullish Continuation Setup:
Daily WFVG acting as potential mitigation zone
Targeting ATH liquidity above $112,000
Confirmation required: bullish BOS or entry model near FVG
🔄 Bearish Liquidity Sweep Scenario:
Deeper liquidity draw possible below WFVG
Next potential demand zone around $85,000–$87,000
Clean inefficiency (FVG) below waiting to be filled
🧠 Wait for price reaction inside WFVG or deeper zone before taking action.
📊 Strategy Used:
ICT | Smart Money | Liquidity Sweep | Order Block | BOS | FVG
📅 Date: June 19, 2025
🔍 Analyst: SeenForex
#BTC #Bitcoin #BTCUSDT #SmartMoney #ICT #FVG #Liquidity #TechnicalAnalysis #CryptoTrading #SeenForex #OrderBlock #TradingViewIdeas
