BTC Accumulated Over 104K💎 BTC PLAN UPDATE (June 16)
NOTABLE BITCOIN (BTC) NEWS:
At least four publicly listed U.S. companies announced plans on Tuesday to significantly increase their cryptocurrency exposure, committing a combined $844 million in new investments. The move reflects a growing corporate appetite for Bitcoin and other digital assets as alternative stores of value and growth opportunities.
The most substantial commitment came from Hong Kong-based ready-meal provider DDC Enterprise Ltd, which disclosed three separate purchase agreements totaling $528 million. The entire sum is earmarked for expanding the company’s Bitcoin reserves.
Technical analysis angle
DAY DAY: Bitcoin is united when uncertainty takes root
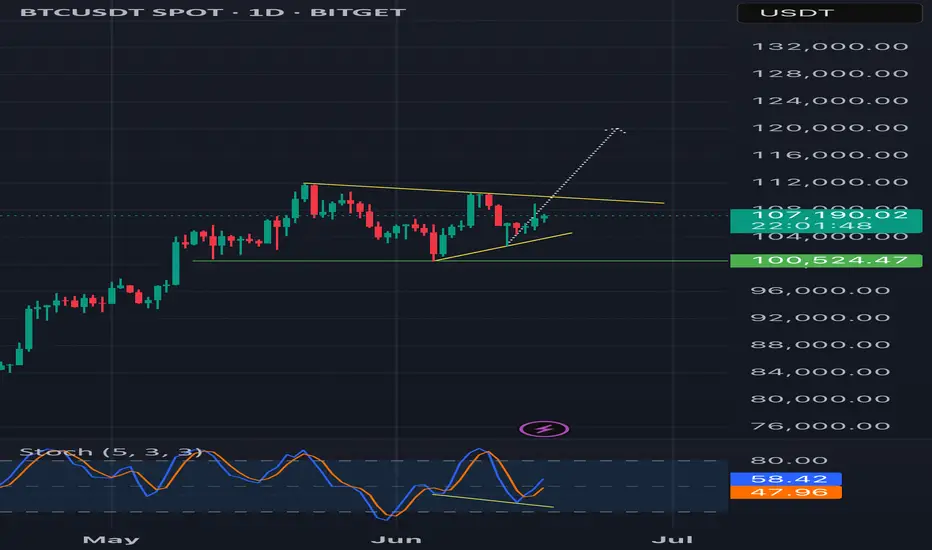
Bitcoin price moves widely at about $ 106,300 at the time of writing the article after failing to reach the $ 107,000 resistance threshold on Monday. Its technical structure, as observed from the daily chart below, shows the trend of price increases.
The dynamic convergence indicator (MACD) has maintained the signal to be confirmed on Thursday when the blue MACD line cut under the red signal line. This signal often encourages traders to consider reducing exposure to Bitcoin, thereby creating a dynamic motivation.
The relative power index (RSI) highlights the discount trend when it is sloping, approaching the middle line 50. The movement is below this important neutral level that can catalyze the downtrend, bringing the average exponent dynamic line of 50 days (EMA) at $ 103,064, the 100 -day EMA road at $ 98,783 and the 200 -day EMA road at $ 93,083 to become expected targets.
==> Comments for trend reference. Wishing investors successfully trading
BTCUSDT.P trade ideas

BTC Rally in Play — Time to Lock In Profits and Wait for FOMC?📈 Bitcoin Rally in Play — Time to Lock In Profits and Wait for FOMC?
After the expected upward move, I believe now is a good time to either close your positions or secure partial profits, whether you're in Bitcoin or altcoins. The market will offer new opportunities, so there’s no rush.
With the upcoming FOMC meeting on Wednesday, I suggest holding off on new entries until the news is out and volatility settles.
Currently, the resistance at $108,347 isn’t confirmed as valid yet — but if we see a rejection from that level, it could become a short-term barrier. On the downside, to maintain this recent bullish momentum, the support at $106,568 must hold.
---
💬 How are you managing your trades ahead of the FOMC? Took profits already or still holding? Drop a comment below — always good to hear your plan!

BTCUSDT Long-Term Roadmap: From Capitulation to a $310K BreakoutAfter a confirmed breakdown from both the ascending trendline and the horizontal support near $110,000, BTCUSDT has entered a bearish phase. However, the projected green candles in your forecast suggest a long-term recovery structure—a potential accumulation phase, followed by a breakout cycle toward a new all-time high at $310K.
📈 Long-Term Phases in the Projection:
1. Phase One: Capitulation & Accumulation (~$65K–$90K)
BTC breaks down below $100K, potentially finding support between $65K and $90K.
This becomes a classic accumulation zone, where smart money begins to position.
Volatility decreases, and price action flattens while volume builds.
2. Phase Two: Recovery & Structure Break (~$105K–$110K reclaim)
Price reclaims the broken support at $105K–$110K, now acting as resistance.
A successful flip of this level into support signals the start of a new bullish cycle.
Market sentiment starts to shift from fear to cautious optimism.
3. Phase Three: Expansion Phase ($110K → $180K)
Once past $110K, BTC enters a momentum-driven rally.
Important psychological levels like $120K, $150K, and $180K are reached.
Institutions and retail FOMO begin re-entering the market.
4. Phase Four: Mid-Cycle Reaccumulation (~$180K–$210K)
BTC consolidates in a wide range, forming a reaccumulation base.
This becomes the launchpad for the final parabolic leg upward.
Market disbelief turns into euphoria.
5. Phase Five: Parabolic Rally to $310K
Once $230K–$250K resistance is cleared, BTC enters parabolic mode.
Targeting the macro top at $310,000, aligning with a future cycle peak (likely post-halving cycle).
Could happen within 12–24 months, depending on macro and cycle momentum.
🔍 Key Technical Conditions to Watch:
Successful reclaim of $110K on high timeframe (weekly close)
Formation of a higher low above $90K
Volume confirmation during breakout of $150K and $180K
Break and hold above $230K confirms macro breakout

BTC bullish rally before the fall?I am expecting a bullish Rally to the previous high since it's a third wave of current impulse I'm expecting BUY from here to the target mentioned. Will be exciting if any reversal signs occur. (BTC should touch 140,000+ in 2 months.)
entering buy from 107400
*A fall still pending* BITSTAMP:BTCUSD

#BTCUSDTbearish side of the btc is slow, as the volume of sell is not that high...…any strategy doesn't fit the lower low, i am seeing btc to the 132k.
anyone overthere with a new different strategy regarding btc?

BTC/USDT – Rising Wedge Breakdown Looms Near $110K
Idea Summary:
Bitcoin is compressing in a rising wedge on 1D/4H timeframes, approaching resistance around $ 110K–$ 112K. We’re seeing bearish divergence on RSI and MACD, declining volume, and sentiment cooling—signaling a potential breakdown.
Key Confluences:
• Rising wedge pattern (bearish reversal during uptrend) with converging trendlines and falling volume
• RSI divergence: price rising, RSI flattening/declining
• Volume behavior: weaker rallies, distribution-style setup near highs
• Sentiment neutralizing: Fear & Greed Index slipped from ~74 to ~55–60
• Macro backdrop: U.S. inflation cooling, Fed pause in rate hikes → but upcoming FOMC brings volatility risk
Conclusion:
BTC is near a wedge apex with short-term bearish structure forming. A breakdown could test $ 90K–$ 75K, whereas a break above $ 112K invalidates the setup. 📉
Trigger zones:
• Breakdown < $ 105K → triggers short
• Breakout > $ 112K → stop out & pause
💬 Thoughts? Breakdown or breakout next?

[SeoVereign] Bitcoin Bearish Outlook – June 17, 2025We are the SeoVereign Trading Team.
With sharp insight and precise analysis, we regularly share trading ideas on Bitcoin and other major assets—always guided by structure, sentiment, and momentum.
🔔 Follow us to never miss a market update.
🚀 Boosts provide strong motivation and drive to the SeoVereign team.
--------------------------------------------------------------------------------------------------------
Hello,
This is SeoVereign, approaching technical analysis not as a result but as a prediction, with a realistic perspective.
I am presenting a bearish view on Bitcoin as of June 17, 2025.
First, based on the fact that a downtrend appeared near the 0.786 level of the overall Fibonacci retracement, I believe strong downward pressure is forming, and thus I am outlining this bearish perspective.
This 0.786 level corresponds to around the 109,000 price range. On the chart, the 109,000–110,600 range is a very strong supply zone where support and resistance have repeatedly been confirmed.
Next, from a wave counting perspective, the 1.272 trend-based Fibonacci extension lies in a similar area as the 0.786 retracement level, which further reinforces my conviction in this view.
After successfully predicting the downward movement from the 11th, I have been continuously counting the recent upward wave, and the wave structure on the chart appears to align naturally, as I see it.
In addition, from a harmonic perspective, the Alt Bat pattern is functioning effectively, and since the movement has been captured within the pre-set X–1.13 range, the confirmation of this pattern can also be considered successful.
The first target is currently set around the 105,700 level.
I will continue to monitor the market closely, and once this idea progresses to a certain point, I will share more specific evidence and the thought process behind the bearish entry through an additional update.
Thank you.

BTC/USDT Technical Analysis🔍 BTC/USDT Technical Analysis
📆 Chart Context:
Published on: June 18, 2025
Instrument: Bitcoin (BTC) vs Tether (USDT)
Timeframe: Appears to be 4H or 1H based on candle width and structure
🧠 Market Structure
🔸 Lower Highs Forming
Clear rejection from around 110,000–112,000 USDT
A sequence of lower highs suggests bearish momentum
Market is failing to break previous highs, signaling potential reversal
🔸 Strong Support Zone
Marked between $99,000 – $100,000
This level has previously caused price reversals (see June 6 and 13 wicks)
Currently being tested again — buyers have defended this area twice
🔁 Price Action & Candlestick Behavior
Recent candles show indecision and weakness after a mild bounce
Wick rejections near $106,000–$107,000 point to supply zone
Projected path (gray curve) implies a small pullback, then a breakdown into the support zone
📉 Prediction: Price Outlook
✴️ Short-Term (1–3 Days):
A likely pullback to $106,000, then a drop toward $100,000–$99,000
If support fails to hold, next target is $96,000–$94,500
✴️ Bearish Breakdown Confirmation:
Candle close below $99,000 with high volume = clear sell signal
In this case, bears may aim for $92,000–$90,000 next
✴️ Bullish Scenario (Less Likely):
If price holds above $104,000 and breaks $108,000, next resistance: $110,500–$112,000
📊 Key Technical Zones
Zone Type Price Level (USDT) Note
Resistance $110,000–$112,000 Previous top, major supply zone
Short-Term Resistance $106,000–$107,000 Weak bounce, possible entry area for shorts
Current Price ~$104,376 Weak consolidation
Support Zone $99,000–$100,000 Key demand area
Breakdown Target $96,000–$94,000 If support fails
✅ Professional Outlook Summary
Market Bias: 📉 Bearish
Action Zone: 🔍 Watching $106K as potential short entry
Support Critical: $99K must hold, or deeper drop
Risk Level: ⚠️ High volatility likely

BTC long now ! Bullish divergence confirm !Bullish divergence in daily timeframe is confirm. It might be good for take long position
#isharewhatitrade
#dyor
BTC is squeezing between descending resistance.📊 BTC/USDT – 1H Chart Analysis: The Calm Before the Storm?
Bitcoin is currently coiling within a symmetrical triangle on the 1-hour chart – a technical pattern that often signals a strong breakout is just around the corner. The market is compressing, and momentum is building.
🔍 Key Levels to Watch:
🔹 Symmetrical Triangle:
BTC is squeezing between descending resistance and ascending support. This equilibrium usually doesn’t last long – expect a sharp move soon.
🔹 Demand Zone ($$$ / BPR):
A solid floor is forming near the BPR (Bullish Price Range), signaling potential buyer interest and liquidity resting just below.
🔹 Fair Value Gap (FVG):
To the upside, BTC is facing a liquidity pocket (FVG) that could act as a magnet if bulls take control.
⚡ Potential Scenarios:
📈 Bullish Breakout: A break and close above the triangle could trigger a rally towards the $105K–$106K zone. Watch for volume to confirm!
📉 Bearish Breakdown: Losing the lower trendline support might send BTC into a deeper correction toward previous demand zones.
🧠 Final Thoughts:
We're approaching a critical inflection point. The triangle is narrowing, and Wednesday, June 25 could be the date the market decides. Both bulls and bears should prepare for volatility.
🚨 As always: This is not financial advice.
🧠 DYOR – Do Your Own Research.
Manage risk. Trade smart. Stay sharp. 💹

Future market trend predictionIn the short term, the price trend of Bitcoin is full of uncertainties. On the one hand, if the global macroeconomic environment continues to deteriorate, with slower economic growth and increased inflationary pressures, it may prompt more investors to seek safe-haven assets. As an asset with certain safe-haven properties, Bitcoin may attract some capital inflows, providing support for its price. However, if regulatory policies are further tightened in the short term, especially if more stringent restrictive measures are introduced in countries and regions where Bitcoin trading is active, then the price of Bitcoin may face significant downward pressure.
you are currently struggling with losses,or are unsure which of the numerous trading strategies to follow,You have the option to join our VIP program. I will assist you and provide you with accurate trading signals, enabling you to navigate the financial markets with greater confidence and potentially achieve optimal trading results.


BTC/USD – Price Rejected at ATH | Key Support in PlaY Bitcoin recently reached a new all-time high at $111,942, but the daily candle closed lower around $109,550, signaling a potential rejection.
On the 1D timeframe, we are now watching the $100,725 level closely. A confirmed break below this support would be a strong signal to consider short positions.
Until then, BTC may consolidate or attempt another push higher. Patience is key here — wait for confirmation.
📌 Key levels:
• Resistance: $111,942 (ATH)
• Support: $100,725 (critical break level)
🧠 Trade safe, manage risk, and follow for more analysis.

BTC-----Buy around 104900, target 106000 areaTechnical analysis of BTC contract on June 19:
Today, the large-cycle daily level closed with a small positive line yesterday, the K-line pattern was a single positive line with continuous negative lines, the price was below the moving average, and the attached indicator was dead cross. The general trend of the decline was still relatively obvious, but in trading, we should pay more attention to the rhythm of the price range in the shock, so the operation should be decisive, not greedy, and do a good job of risk control; the short-cycle hourly chart yesterday's intraday support was corrected upward, the European session fell but did not continue to break down, the price support rebounded in the early morning, the current K-line pattern was a single positive line with continuous positive lines, and the attached indicator was golden cross, so it is highly likely to break through yesterday's high of 105500 area within the day.
Today's BTC short-term contract trading strategy:
Buy at the current price of 104900 area, stop loss at 104000 area, and target 106000 area;

HolderStat┆BTCUSD forms a triangleBYBIT:BTCUSDT trades inside a narrowing flag between 104 k and 108 k. A push past 108 k activates the pole projection toward 112–114 k and possibly the ATH rail; rejection sends price to retest 102 k support before the next offensive.

Btcusd buy ideaBTCUSD experienced a sell-off, filling the gap, but buyers stepped in, mitigating the decline. If buyers hold and consolidate above $105,500, it could pave the way for a potential rally towards $108,000-$110,000. What's your outlook, traders

BTC - 106k now, whats next?106k is a rotational move, means the top liquidity get inside at first hence and then it goes down, watch it for

Trade #12: $BTC - Bullish Alignment Confirmed! Long Setup WatchRecap & Lesson Learned:
In Trade #11, I noted the daily structure was strongly bullish, but the 1HR chart was bearish. My expectation was for price to dip toward the 98,000 daily demand zone. However, the 1HR structure reversed structure before reaching that level — a reminder that markets don’t always follow our ideal path.
The Shift: Timeframe Synced = Conviction Amplified!
Now, BOTH daily AND 1HR structures are BULLISH and aligned. This synchronization signals robust momentum, and I’m positioned fully bullish — awaiting the right technical trigger to enter a long trade.
The Opportunity: Precision Entry at Demand
I’m eyeing the green demand zone near 106,500 for a potential long entry. This is where buyers previously stepped in aggressively, making it a high-probability reaction area.
Key Refinement: Patience & Confirmation
(Learning from Trade #11):
I will NOT enter blindly at 106,500. Instead, I’ll:
1️⃣ Watch price behavior for signs of strength
2️⃣ Confirm my entry criteria are met
3️⃣ Execute ONLY if evidence validates the setup.
Why This Discipline?
"It’s better to enter slightly higher WITH confirmation than chase a ‘sniper entry’ without confirmation."
No confirmation = No trade. Period.
My Plan:
WAIT for price to test ~106,500.
CONFIRM buyer strength and alignment with my rules.
EXECUTE a long position only if all boxes are checked.
Stay Alert, Stay Patient.
The trend is our friend — but only if we respect its rhythm. Updates to follow!
✅ Key Takeaways:
Daily + 1HR = Bullish Synergy.
Watch 106,500 for a confirmed long entry.
No confirmation = No trade. Discipline over FOMO.

This isn’t a breakout. It’s a return to senderPrice didn’t rally from randomness — it tapped directly into a daily OB, respected it, and is now marching toward unfulfilled inefficiency above. What looks like recovery is really just Smart Money closing the loop.
The logic:
Price swept sell-side liquidity into a deep daily OB and rebounded sharply — not passively. The response wasn’t a bounce. It was intention.
Above? Two clean destinations:
TP1: 110,950 — inefficiency fill and EQ of prior supply
TP2: 112,033 — full delivery into unmitigated structure
No overlapping zones, no chaos — just precise levels that haven’t yet been claimed.
Execution:
Entry: 104,200–105,000 range
SL: Below 103,800
TP1: 110,950
TP2: 112,033
The risk is defined. The reward is prewritten.
Final thought:
“This move wasn’t built to excite you. It was built to deliver.”

$BTC Breakout Targets $125KCRYPTOCAP:BTC has broken out of a falling wedge and is holding strong above the $103K support zone.
Price is pushing upward toward the key resistance at $110K– $112K.
A breakout above this zone could trigger a move toward $125K.
DYRO, NFA

Monday trades of the day🔥 These are the scalps I’ve got my eye on today. 🔥
Mostly looking at continuation longs — unless structure tells a different story.
💡 Key Plan:
For each long setup, I’ll wait for an internal market structure (MS) flip before pulling the trigger. No confirmation, no entry. Precision is the priority.
📅 Class Schedule:
Monddaday | After 6 PM

US entering the war,~25% drop will happen if it's gonna escalateUS about to enter the war with Iran, as long the war finish quickly with US destory Fordow nuclear site and other facilities, we can stop around 94k$ zone,
war escalating more, will engage a bigger drop in markets.
Likely they will announce it after markets close on Friday. stay updated.

BTC Short | FVG Setup + RSI Filter | 18.06
Smart Money Concept | Intraday Trade | 1:2 RR
🔍 The setup:
Today I was watching for a short opportunity.
Price reached a key level and formed a bearish FVG — looked clean at first.
But I held off entering because I noticed RSI divergence — a red flag I always consider when expecting a potential level break.
💡 Why it matters:
RSI divergence often signals weakness in momentum.
For me, it's a key filter that helps avoid fake breaks — this was a good example of how I apply it.
📈 What happened next:
Price moved up to test the 1H FVG (zone #2) and formed another FVG slightly lower.
That second one was my entry point for the short.
🎯 Target:
I exited at a 1:2 risk-reward, which is my minimum.
The day was ending, and I didn’t want to hold the position longer — I’m not convinced the down move would continue cleanly (possible wicks or traps).
🤔 Question to the community:
How do you filter FVG entries?
Do you also use RSI or wait for structure shifts?
And what’s your outlook on BTC from here?
