Skeptic | Bitcoin Deep Dive: Rate Hikes, War Tensions & TriggersInterest Rates: The Big Picture
Let’s start with the Federal Reserve’s move—interest rates jumped from 4.25% to 4.5% . What’s the deal? Higher rates mean costlier borrowing , so businesses and folks pull back on loans. This drains liquidity from risk assets like Bitcoin and SPX 500, slowing their uptrend momentum or pushing them into ranges or dips. Now, mix in the Israel-Iran conflict escalating ? Straight talk: risks are sky-high , so don’t bank on wild rallies anytime soon. My take? BTC’s likely to range between 97,000 and 111,000 for a few months until geopolitical risks cool (like Russia-Ukraine became “normal” for markets) and the Fed starts cutting rates. Those two could ignite new highs and a robust uptrend. Let’s hit the charts for the technicals! 📊
Technical Analysis
Daily Timeframe: Setting the Stage
You might ask, “If 100,000 support breaks, does that mean we’ve formed a lower high and lower low, flipping the trend bearish per Dow Theory?” Absolutely not! Here’s why: our primary uptrend lives on the weekly timeframe, not daily. The daily is just a secondary trend. If 100K cracks, it only turns the secondary trend bearish, leading to a deeper correction, but the major weekly uptrend stays intact.
Spot Strategy: No spot buys for now. Economic and geopolitical risks are too intense. I’ll jump in once things stabilize. 😎
Key Insight: A 100K break isn’t a death sentence for the bull run—it’s just a shakeout. Stay calm!
4-Hour Timeframe: Long & Short Triggers
Zooming into the 4-hour chart, here’s where we hunt for long and short triggers:
Long Trigger: Break above 110,513.92. We need a strong reaction at this level—price could hit it early or late, so stay patient for confirmation.
Short Trigger: Break below 101,421.65. Same vibe—watch for a clean reaction to tweak the trigger for optimal entry.
Pro Tip: These levels are based on past key zones, but time outweighs price. Wait for a reaction to nail the best entry. Patience is your edge! 🙌
Bitcoin Dominance (BTC.D): Altcoin Watch
As BTC dips, BTC.D (Bitcoin’s market share) is climbing, meaning altcoins are taking a bigger beating. Don’t touch altcoin buys until the BTC.D upward trendline breaks. They haven’t moved yet—you might miss the first 10-100%, but with confirmation, we’ll catch the 1,000-5,000% waves together. 😏
Shorting? If you’re shorting, altcoins are juicier than BTC—sharper, cleaner drops with more confidence. Patience, patience, patience—it’s the name of the game.
Final Thoughts
My quieter updates lately? Blame the geopolitical chaos, not me slacking . I’m hustling to keep you in the loop with clear, actionable insights. here, we live by No FOMO, no hype, just reason. Protect your capital—max 1% risk per trade, no exceptions. Want a risk management guide to level up? Drop a comment! If this analysis lit a spark, hit that boost—it keeps me going! 😊 Got a pair or setup you want next? Let me know in the comments. Stay sharp, fam! ✌️
BTCUSDT.P trade ideas

BTC 4H SCALPBTC/USDT Scalp Setup – 4H Chart
Entered a scalp position with TP1 aligned at the Fibonacci extension near 105,652. The first take-profit has been secured, and the remainder of the position is being left to ride — no emotional attachment. If invalidated, the trade will be abandoned without hesitation.
Technical Overview:
Price broke out of the local downtrend channel
Watching for a potential green dot on the volume oscillator to confirm upward continuation
VMC Cipher B shows early signs of a shift; confirmation is still pending
That said, short-term caution is warranted.
Bearish Considerations:
On the higher timeframes, there’s a visible bearish divergence between price and volume — price continues to push higher, while volume fades, indicating a potential trend exhaustion.
Thanks for your support.
If you found this idea helpful or insightful, feel free to leave a like or comment, open to your thoughts and perspectives.

Trade Plan Update #12: Navigating BTC’s Critical Levels
*Conflicting timeframes (bullish 1H/Daily vs. bearish 4H/Weekly) are causing choppy price action. Here’s my 2-step game plan: *
📈 Scenario 1: Bullish 1H Play
Key Support Zone: $100,314 - $102,000 (last line of defense for 1H bullish structure).
Trigger: A strong rejection + bullish reversal signal in this zone.
Action: INSTANT LONG ENTRY. No waiting—aggressively capitalize on momentum.
📉 Scenario 2: Daily Structure Fallback
If $100,314 fails:
1- First Demand Zone: $93,300 - $98,000
Watch for a strong bounce → Go long if momentum confirms.
Weak reaction? Hold and monitor lower.
Second Demand Zone: $84,000 - $88,000
Ideal reversal zone for resuming the bull run.
LONG on confirmed strength.
Bull Run Lifeline: $74,600
Non-negotiable: A daily close below this invalidates the bull trend.
✅ Key Reminders:
Patience is strategy: Only act when price confirms your thesis (no guessing!).
Risk first: Define stops for every entry.
Watch price action—NOT hopes.
👇 What’s your take?
Which scenario seems more likely?
Are you adding any key levels?
Let’s discuss below! 👀

BTCUSD 1D | big consolidation
🧠 1. Pattern and Market Structure Identification
✅ Trend and Pattern: Bullish Flag
• Structure: Price forms a descending consolidation pattern (descending channel) after a sharp upward impulse — this is a classic characteristic of a bullish flag.
• Breakout volume occurred from the consolidation zone near the green support area → an early signal that bulls are active.
• However, the price is currently retesting the breakout area and is testing the demand zone again.
📊 2. Volume Analysis
• Volume spikes (purple arrows) occurred at several key points:
• Initial breakout
• Support retest
• High volume during the breakout = valid breakout confirmation.
• Currently, volume is slightly declining = a signal of consolidation and possible accumulation.
📉 3. Support & Resistance Levels
• Strong Support: 96,961 USDT (marked by the blue line and breakout volume).
• Major Resistance: 111,980 USDT (all-time high and projected target from the flag breakout).
• Current Price: 103,272 USDT → sitting between these two key levels.
🎯 4. Potential Price Direction
Bullish Scenario:
• If the 96,961 USDT support holds, price could continue upward → the bullish flag target = projected height of the flagpole.
• Conservative Target: 111,980 USDT (ATH)
• Aggressive Target (if ATH breakout occurs): 115,000+ USDT
Bearish Scenario:
• If price breaks below 96,961 USDT with strong volume, it could invalidate the bullish pattern and drop further to the 92,000 – 90,000 USDT range.

bitcoin bullish and bearish BINANCE:BTCUSDT.P
bullish
🔹 Technical analysis according to Elliott waves (time: 1 hour)
📌 The pattern shown on the chart shows a complex structure that includes a complex correction within the larger wave (B), and the following is clear:
🔸 Main waves:
Wave (1) up from the bottom has been confirmed.
It was followed by a corrective wave (2) that ended near the 0.786 Fibonacci level = 102,575.
Then the upward wave (3) started, and it seems that it has been completed or is about to be completed.
🔸 Current status:
The price is currently moving within a small corrective wave, likely wave (4).
Current major support is located at: 🔸 102,275.7 (very important level) 🔸 100,317.6 (in case the correction extends)
🔸 Critical resistance areas:
For the bullish scenario to be valid, the resistance must be broken:
106,759 (0.618 Fibonacci ratio)
108,948 (0.786 – peak of wave C)
---
🔹 Important technical points:
🔸 The last correction (A)-(B)-(C) shows a clear triple structure, indicating that wave (2) has been completed.
🔸 The price is currently bouncing off the 0.5 - 0.618 Fibonacci levels (104,402 - 104,923), which reinforces the possibility that wave (2) has actually ended, and that we are currently starting an upward wave (3).
---
✅ Conclusion:
✅ As long as the price is above 102,275, the upward scenario through wave (3) remains valid.
⚠️ Breaking 100,317 indicates the failure of the bullish scenario and a structural shift in the waves.
🔻 Alternative (Bearish) Scenario – Short-Term:
If the price fails to maintain the current support at 102,275, we may not be in wave (4) but rather at the beginning of a new downward wave within a broader corrective scenario, as follows:
---
🔸 Wave Interpretation:
🔹 Wave (B), which completed at the peak near 108,948, likely marked the end of an upward correction.
🔹 The current downward wave from that peak could be:
Either wave 1 of C within a larger correction,
or the beginning of wave (C) within a bearish (A)-(B)-(C) pattern.
---
🔻 Potential Downside Targets in This Scenario:
1. Breaking 102,275 = Confirmation of the beginning of a new downward wave.
2. First Target:
🔸 101,484 (1.618 Fibonacci Extension – Wave 1 Expected)
3. Second and Stronger Target:
🔸 100,317 = Previous Major Support, Representing an Important Structural Test Area.
4. Third and Most Extreme Target in This Scenario:
🔸 98,800 – 99,260 = Possible Wave C Extension (Corresponds to a Larger Downside Scenario).
---
⚠️ Failure Signal:
Remaining below 105,926 (Previous Sub-Wave Resistance) maintains selling pressure.
Any weak bounce and lack of a clear wave 5 upwards = an additional sign of bearish dominance.
---
🔻 Conclusion:
✳️ The bearish scenario assumes that the peak at 108,948 was the end of corrective wave (B), and that we are now in a downward wave C targeting areas between 101,400 and 99,200, and possibly lower.
✳️ A break of 102,275 would be key to activating this scenario.

BTC dump time , fake breakout, watch US news todayAny US strike on Iran will lead to a big dump in price

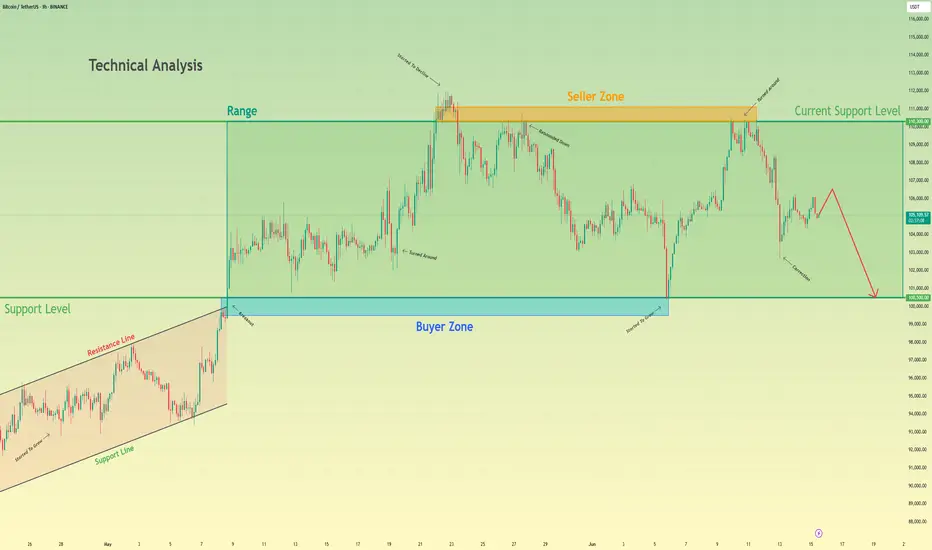
Bitcoin will make a small upward move and then continue to fallHello traders, I want share with you my opinion about Bitcoin. Earlier, the price was confidently growing inside an Upward Wedge, showing a series of higher highs and higher lows. This rising structure was supported by consistent momentum until BTC reached the seller zone between 110300 and 111100, where the growth slowed down and started to fade. From there, the price rejected this resistance and shifted into a Range, bounded by 100500 and 110300. BTC has been fluctuating inside this horizontal structure for some time, unable to break above the seller zone or below the buyer support. Now BTC is showing signs of weakness, forming a minor correction and struggling to reclaim previous highs. Given this structure and rejection from the seller zone, I expect BTC to make a small upward move and then start a decline toward the support level at 100500, which also coincides with the bottom of the range and acts as a strong psychological level. For this reason, I set my TP at 100500 points. Please share this idea with your friends and click Boost 🚀
Evening BTC Market Analysis and Trading RecommendationsToday, U.S. markets are closed, leading to light trading activity and relatively limited overall market volatility. From a technical analysis perspective, the 4-hour K-line chart currently shows prices trading below the middle band of the Bollinger Bands, exhibiting a classic range-bound consolidation pattern. Bulls and bears are locked in a tug-of-war between key support and resistance levels, with K-line formations alternating between bullish and bearish patterns.
In terms of chart structure, the lower support zone has demonstrated strong buying conviction, while the upper resistance level has exerted clear restrictive force. Multiple failed upward breakouts have formed a short-term top. This box consolidation—characterized by resistance above and support below—is expected to sustain sideways trading through Friday.
Against the backdrop of no major positive catalysts, bearish momentum may gradually dominate if no substantial bullish triggers emerge. Maintain a trading strategy of selling into strength.
BTCUSDT
105000-105500
tp:104000-103000
Investment itself is not the source of risk; it is only when investment behavior escapes rational control that risks lie in wait. In the trading process, always bear in mind that restraining impulsiveness is the primary criterion for success. I share trading signals daily, and all signals have been accurate without error for a full month. Regardless of your past profits or losses, with my assistance, you have the hope to achieve a breakthrough in your investment.

CHECKL BTCUSDT SIGNAL READ CAPTAINEntry: around(102893.55)102653.66 ✅
Take Profit 101732.58✅
Take Profit 2: 101231.00✅
Last Target:100412.00 ✅
Stop Loss: 103304.27❌

btc short setupSL 10500
tp 102500
with ongoing world events and liquidations available at that range, its very much possible that bitcoin will and must tap 102 or lower for a creating fear and wiping retailers out. But short with caution might give fake outs to trap longs.
thanks
Bitcoin: Strong Support Holds Amid Market UncertaintyBitcoin: Strong Support Holds Amid Market Uncertainty
Bitcoin recently tested a key support zone near 102,670, bouncing back in alignment with the broader bullish trend.
The ongoing Middle East conflict continues to reinforce BTC’s strength, establishing another solid support level at 102,650, which signals that the price remains well-supported by buyers around this zone.
For Bitcoin to dip below this area, it would likely require significant market manipulation or unexpected developments.
At present, BTC suggests an upward trajectory, potentially reaching 107,850, 109,100, and even a retest of the previous highs near 111,500.
You may find more details in the chart!
Thank you and Good Luck!
❤️PS: Please support with a like or comment if you find this analysis useful for your trading day❤️

$BTCUSDT Eyes $120K After Key Support BounceBTCUSDT is holding strong above the ascending trendline and key support near $104K.
A fresh bounce suggests bullish momentum, with potential to break the $110K resistance.
If that happens, the next target could be around $120K. Trend remains bullish above support.
DYRO, NFA

continue to move accumulation: below 109,000💎 Update Plan BTC (June 20)
Notable news about BTC:
Semler Scientific (SMLR) unveiled an ambitious three-year strategy on Thursday aimed at significantly expanding its Bitcoin holdings to 105,000 BTC by the end of 2027. The announcement coincided with the appointment of a new executive to lead the firm’s digital asset initiative.
The Nasdaq-listed healthcare firm has named Joe Burnett as its Director of Bitcoin Strategy, a move it believes will strengthen its long-term treasury vision and enhance shareholder value. As part of this strategic shift, Semler Scientific plans to accumulate Bitcoin through a mix of equity and debt financing, alongside reinvested cash flows from its core business operations.
Technical analysis angle
BTC as well as XauUSD are trapped in the channel price 104k to 110k these are also two important milestones of BTC. Also congratulations to investors when detecting the bottom of 104k. The next expectation within the price channel is still maintained at 110k landmark
But with the recent moves of investors, the community is afraid that BTC will continue to adjust in the future.
==> Comments for trend reference. Wishing investors successfully trading

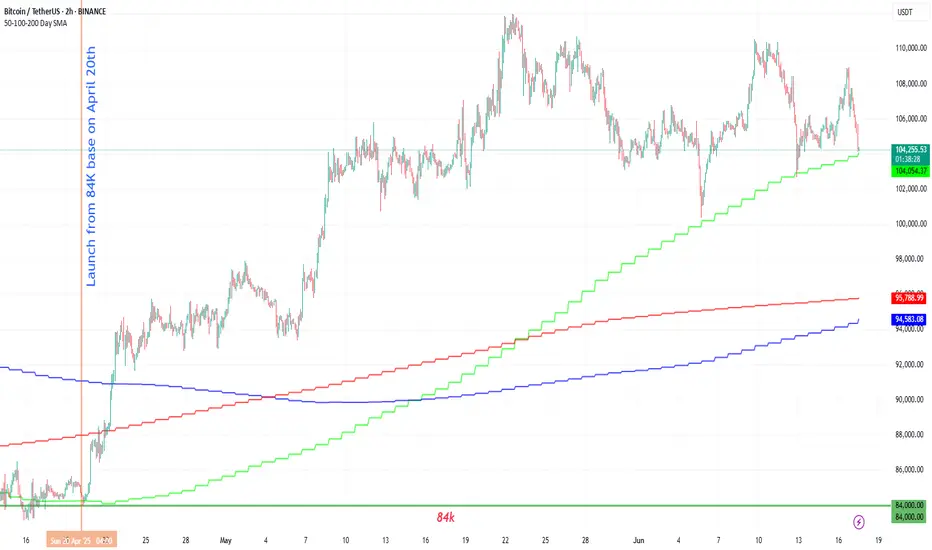
Bitcoin running the tables since launching from 84k base on 4/20After forming a base of $84K, Bitcoin departed this level on April 20th and has held the 50 Day SMA ever since.
BTC: Scalp Long 18/06/25Trade Direction:
Long BTC Scalp BINANCE:BTCUSDT.P
Risk Management:
- Risk 0.1% (very low risk due to market conditions)
- Target approx 0.5% gain
Reason for Entry:
- 0.618 retracement
- Sweep of recent low
- M30 Fair Value Gap tapped (partially mitigated earlier)
- Multi time frame Oversold
- Market structure holding key support level
Additional Notes:
- Confidence level low low likely hood this succeeds but trading my plan
- Very cautious trade in a volatile unpredictable market environment


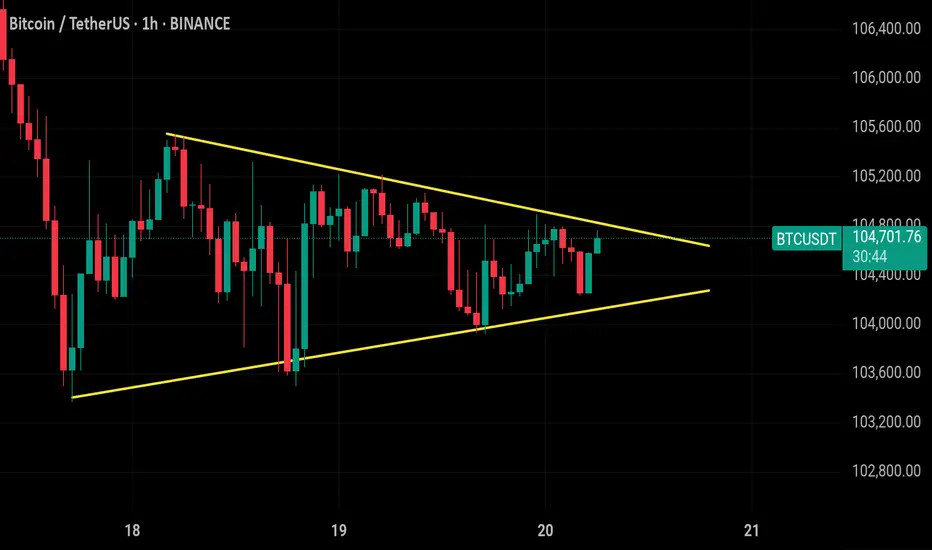
#Bitcoin ( $BTC/USDT ) is forming a symmetrical triangle on the #Bitcoin ( $BTC/USDT ) is forming a symmetrical triangle on the 1H chart, with strong support near 103,800 and resistance around 105,100. Price is consolidating tightly, indicating a breakout is near. A bullish breakout above 105,500 could target 110,000, while a breakdown below 103,500 may lead to a drop toward 102,000. Key invalidation lies at 103,500. Wait for volume confirmation before entering —
Today's BTC trading strategy, I hope it will be helpful to youBitcoin prices have fluctuated frequently in recent days, presenting a complex landscape. Looking at price data from the past week, Bitcoin has seen significant volatility. On June 13, triggered by Israel's airstrikes on Iran that escalated tensions in the Middle East, Bitcoin hit a low of $102,614 per coin—edging close to the $100,000 threshold. As of June 20, Bitcoin hovered around $104,500. While this represents a rebound from the recent low, prices remain relatively unstable, reflecting intense battles between bulls and bears with no clear trend established.
Reviewing this year's price trajectory, Bitcoin fell below $40,000 per coin at the start of 2025 before launching a robust rally. In less than a year, prices more than doubled, briefly hitting $99,000 per coin to set a new all-time high. Recent volatility can be seen as a correction after the prior surge—a common occurrence in crypto markets, typically a process where the market digests earlier gains and seeks a new price equilibrium.
Global macroeconomic conditions and shifts in crypto regulatory policies significantly impact Bitcoin prices. Continuously monitor the Federal Reserve's monetary policy stance: if the Fed signals rate cuts or implements easing, increased market liquidity may fuel Bitcoin's rally, warranting appropriate long position additions. Conversely, if the Fed hikes rates or maintains a hawkish stance, exercise caution and consider reducing positions. Meanwhile, track global crypto regulatory dynamics: positive policies from more countries can strengthen long positions, while signals of regulatory tightening require prompt strategy adjustments and position reductions to mitigate risks. Additionally, stay attuned to market sentiment and investor psychology to avoid herd behavior.
In Bitcoin's complex and volatile environment, long strategies must be flexibly adjusted. Investors should align with their risk tolerance and investment objectives, strictly implement strategies, and strive to maximize returns while minimizing risks.
Today's BTC trading strategy, I hope it will be helpful to you
BTCUSDT BUY@103000~104000
SL:102000
TP:105000~106000

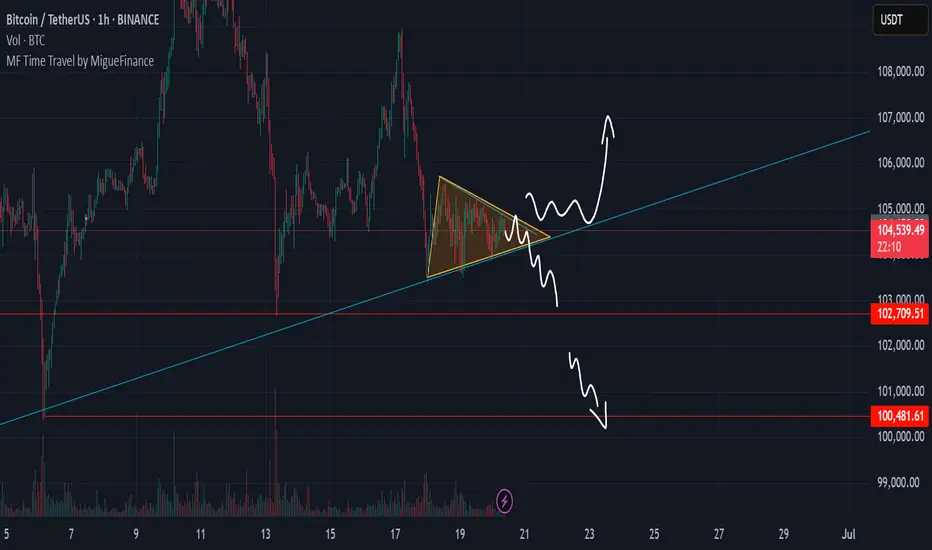
Bitcoin Triangle Pattern, Bullish or Bearish ?We can see LTF bitcoin create mini triangle pattern after downtrend, basically its called bearish triangle continuation. but lets see what is the side will be break
100k vs 107k
Geopolitical Tensions & Technical Pattern Point to BTC Decline!Bitcoin ( BINANCE:BTCUSDT ) fell about -5% after tensions between Israel and Iran escalated. Unfortunately , these tensions are still escalating, but Bitcoin has managed to recover about +3% so far.
Bitcoin is moving near the Resistance zone($107,120-$105,330) and Cumulative Short Liquidation Leverage .
In terms of Elliott Wave theory , it seems that Bitcoin is completing a corrective wave . The corrective wave structure could be Contracting Triangle . In case of a sharp decline in Bitcoin again, we can consider these waves as five descending waves (if Bitcoin does NOT touch $106,600 ).
I expect Bitcoin to start declining again and at least drop to the Support zone($107,120-$105,330 ). The second Target could be the Support line and Cumulative Long Liquidation Leverage .
Note: If Bitcoin can break the Resistance zone($107,120-$105,330), we can expect further increases in Bitcoin.
Please respect each other's ideas and express them politely if you agree or disagree.
Bitcoin Analyze (BTCUSDT), 1-hour time frame.
Be sure to follow the updated ideas.
Do not forget to put a Stop loss for your positions (For every position you want to open).
Please follow your strategy and updates; this is just my Idea, and I will gladly see your ideas in this post.
Please do not forget the ✅' like '✅ button 🙏😊 & Share it with your friends; thanks, and Trade safe.

BTC Accumulated Over 104K💎 BTC PLAN UPDATE (June 16)
NOTABLE BITCOIN (BTC) NEWS:
At least four publicly listed U.S. companies announced plans on Tuesday to significantly increase their cryptocurrency exposure, committing a combined $844 million in new investments. The move reflects a growing corporate appetite for Bitcoin and other digital assets as alternative stores of value and growth opportunities.
The most substantial commitment came from Hong Kong-based ready-meal provider DDC Enterprise Ltd, which disclosed three separate purchase agreements totaling $528 million. The entire sum is earmarked for expanding the company’s Bitcoin reserves.
Technical analysis angle
DAY DAY: Bitcoin is united when uncertainty takes root
Bitcoin price moves widely at about $ 106,300 at the time of writing the article after failing to reach the $ 107,000 resistance threshold on Monday. Its technical structure, as observed from the daily chart below, shows the trend of price increases.
The dynamic convergence indicator (MACD) has maintained the signal to be confirmed on Thursday when the blue MACD line cut under the red signal line. This signal often encourages traders to consider reducing exposure to Bitcoin, thereby creating a dynamic motivation.
The relative power index (RSI) highlights the discount trend when it is sloping, approaching the middle line 50. The movement is below this important neutral level that can catalyze the downtrend, bringing the average exponent dynamic line of 50 days (EMA) at $ 103,064, the 100 -day EMA road at $ 98,783 and the 200 -day EMA road at $ 93,083 to become expected targets.
==> Comments for trend reference. Wishing investors successfully trading

BTC to 102.5k game plan. here you can see that bitcoin is trading within a zone that will likely lead to a breakout to the downside, unless geopolitical tensions somehow get freed up. I believe that we will see 102.5k by the end of the month, if not sooner.

BTC – 15min Reversal Structure & Fibonacci ReclaimWe’re currently witnessing a potential short-term reversal on BTC’s lower timeframe after a volume-supported breakdown and sweep of local lows.
🔍 Key Observations:
Price swept liquidity at local lows (~103,929.27)
Entered into a clear reaccumulation box with responsive buyers
Volume profile shows prior POC just above – room for fill
Fibonacci retracement aligns with key structure:
0.5 = 104,372.94
0.618 = 104,268.23
1.0 = 104,816.60 (final high target for this impulse)
📈 Potential Play:
Entry Zone: Just above the sweep candle (104,100–104,200)
Target 1: 0.382 at 104,477
Target 2: 104,816.60
Invalidation: Close below 103,926
🧠 Mindset:
This is a classic liquidity sweep → reaction → reclaim pattern. If BTC flips the 0.5 level with strong momentum, a short squeeze toward the 104.8K area becomes likely.
Great opportunity for scalpers or day traders.
Let me know if you want this turned into a long-form breakdown or sent in another format.
