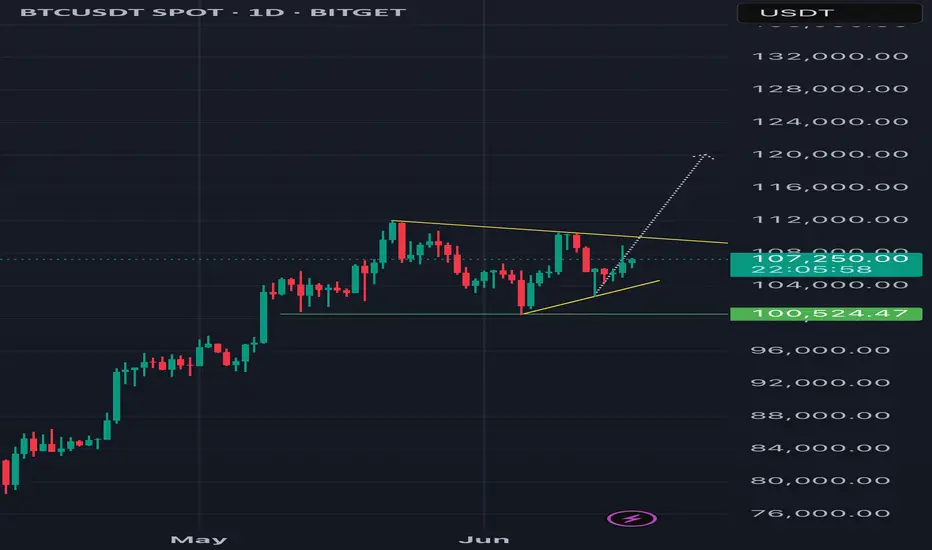
Bitcoin Retests Broken Channel | Bounce to $110k?Bitcoin is currently retesting the broken downward channel. This selloff was a market shock reaction due to Israel's airstrikes on Iran. Price found support around $103k, at the daily timeframe 50SMA. The daily 50SMA also served as support in the previous drop to $100k last week.
In the chart's red circle is likely where many long leveraged positions had their stop losses or liquidation levels. We can safely assume this event was a liquidity hunt as Bitcoin remains strong above $100k. A healthy pullback to retest.
Historically, we have seen similar market shock selloffs like this. One example is the 1st of October 2024 Iran strikes on Israel. Bitcoin crashed 5% from $63k to $60k. What followed after was a recovery to over $100k, never seeing $60k again.
Will Bitcoin recover?
We still have multiple bullish developments. Institutions are becoming increasingly interested in Bitcoin, the US Bitcoin reserve, SEC x Ripple case settlement, SOL ETF approval, Fed rate cuts, among others.
Provided that the conflict does not escalate, once the market panic reaction is over, we can expect a healthy bullish continuation, as long as Bitcoin remains above $100k.
We also have a massive pool of short liquidity above $111k. Once we break above this level it will be a short-squeeze to $120k.
BTCUSDT.P trade ideas

Excellent Trade yesterday! Today's PlayHere are the scalp plays I am watching today. A few continuation plays in to demand and a reaction off supply. Lets see what the NY brings.

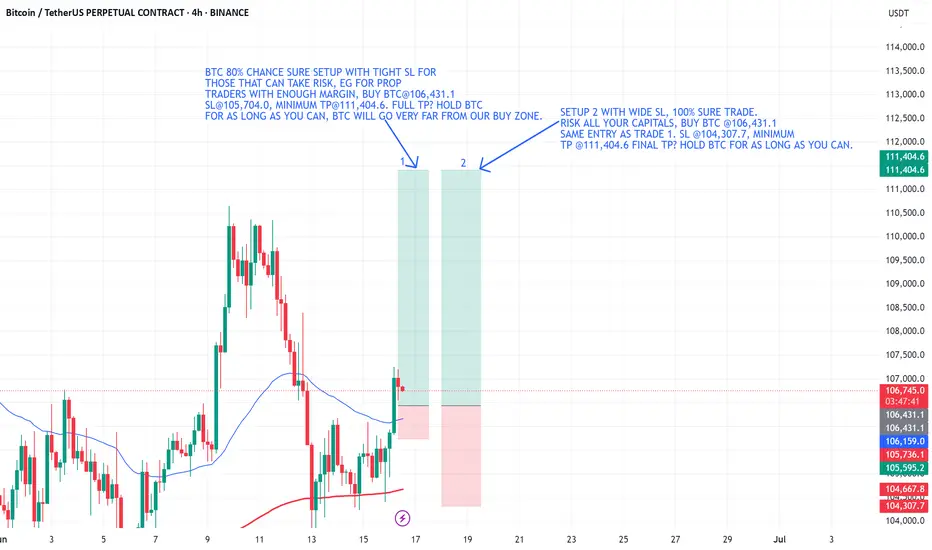
BTC/USDTHello friends, I hope you are doing well. This analysis came to my mind for Bitcoin. On the 4-hour time frame, if Bitcoin crosses the areas I specified, it will move towards its targets. It could be bullish because gold and oil were bearish yesterday. What do you think, friend?

BTC Weekly BOX breakout or possible false breakoutWe have BTC setting up a nice weekly consolidation box, with candle closes consistently holding above the previous weekly ATH resistance. Multiple Doji closes indicate consolidation and compression. At the bottom of the box, we’ve seen strong reversals with high volume. The 4H chart is consistently defending the 200 EMA, supporting the idea that the daily trend remains strong — although direction is currently unclear.
Is distribution happening? It’s not easy to short just yet. We might still see a false breakout, position filling, and then a return to the box range. I’d be interested in a swing short if that happens — especially if the weekly candle closes with high volume and signals a reversal, indicating a potential bearish shift on the daily chart. Let’s keep in mind that June is historically weak, especially during the last two weeks.
On the long side, I’ll only be looking for entries after a daily break of structure (BOS).
Does not need to goes to the highs, we could drop below 100K if we lose box range low with a MSB.
Interesting days ahead — patience is key, as we currently don’t have many high-probability setups.

What is what I think BTC is bearish short to full the FVGs if you look very closely to the chart. Full the gaps and back up for a long

BTCUSD – Range Scalping Zones IdentifiedPrice tapped into a previous short zone near 108.6 and showed rejection. We’re watching for downside follow-through toward the 104.2 to 104.5 range where a potential long opportunity may form.
This chart outlines clean range-based levels for scalping. These zones line up with prior liquidity sweeps and local structure shifts. Scalpers can look to react at these levels depending on how price behaves when we get there.
Ideal for traders on lower timeframes like the 15m, but the concept applies across intraday setups. Always wait for confirmation before entering.

BTC long now ! Bullish divergence confirm ! Bullish divergence in daily timeframe. It might be good for take long position on btc .
#DYOR
sellsell
Iron dome is hacked & Iran is hacking nuc sil.Tela vvv is going to be de stroiiiiied this night
That wasn’t a breakout. That was the stop runBTC swept the high into 107,991 — precision tap of the premium fib. Now the delivery shifts. Price has already done its job: take liquidity, trigger late longs, and set up the real move.
Here’s the execution breakdown:
Price tagged the 0 level of the fib extension — 107,991 — and rejected
A clean 4H FVG sits just below around 106,195.9 (0.5), aligned with 0.382 and 0.618 fib levels (106,619.8 to 105,772.1)
This is the re-entry zone for Smart Money — not the top chasers
Expectations from here:
→ Rebalance into the 106.6–105.7k region
→ If that zone holds and price shifts structure bullish again, we retest 107.1 → 107.9 → break higher
→ If we lose 105.7 cleanly, I’m watching 104,399.9 — the deeper inefficiency magnet
This isn’t about confirmation. It’s about preparation.
More trades like this — clean, controlled, conviction-based — live in the profile description.

Bitcoin Market Analysis and Future Trend ForecastThe Bitcoin market has once again become the focus of investors. The price of Bitcoin has shown a significant upward trend, successfully breaking through the key resistance level of $106,000 per coin with an intraday increase of over 2%, demonstrating the strong vitality of the market. This price movement not only reflects the warming of positive sentiment in the cryptocurrency market but also indicates the gradual recovery of investor confidence, which has become the core driving force behind Bitcoin's current rally.
Currently, the Bitcoin price is at a critical juncture. From a daily chart perspective, after reaching an intraday high of $107,265, Bitcoin failed to effectively break through the key resistance level of $108,000 and has since retracted to fluctuate around $106,940. On the 4-hour timeframe, the MACD indicator shows that the histogram remains in positive territory, but the rate of increase has slowed, suggesting a short-term weakening of bullish momentum. Meanwhile, the RSI indicator stands at around 65, approaching the overbought zone, indicating that the market faces short-term correction pressure.
you are currently struggling with losses,or are unsure which of the numerous trading strategies to follow,You have the option to join our VIP program. I will assist you and provide you with accurate trading signals, enabling you to navigate the financial markets with greater confidence and potentially achieve optimal trading results.
Trading Strategy:
sell@107500-108000
TP:106000-106500

BTCUSD | Short Bias | Liquidity Grab | (June 16, 2025)BTCUSD | Short Bias | Liquidity Grab Setup | (June 16, 2025)
1️⃣ Short Insight Summary: Bitcoin hit a solid take-profit earlier, but now I’m watching for a potential liquidity grab near the highs to set up a short opportunity. The next key zone to watch is around 1:11 PM if price quickly spikes and reverses.
2️⃣ Trade Parameters:
Bias: Short
Entry: Around 113 (after a confirmed liquidity grab at the top)
Stop Loss: Just above the liquidity grab zone
TP1: Around 103900 (Point of Control zone)
TP2: Final target at 97900
Partial Exits: Possible scaling out at POC zone
3️⃣ Key Notes: Spot selling is active, but there's also a lot of buying interest—especially from those trying to long this dip. That mix can lead to a fast liquidity grab, flushing out early shorts before a reversal. Open interest suggests there's still a lot of activity, so I’m being patient and only acting on confirmation.
4️⃣ Optional Follow-up: I’ll keep an eye on this setup and update if the reversal confirms after the grab.
Please LIKE 👍, FOLLOW ✅, SHARE 🙌 and COMMENT ✍ if you enjoy this idea! Also share your ideas and charts in the comments section below! This is best way to keep it relevant, support us, keep the content here free and allow the idea to reach as many people as possible.
Disclaimer: This is not financial advice. Always conduct your own research. This content may include enhancements made using AI.

DeGRAM | BTCUSD formed the rising bottom📊 Technical Analysis
● BTC rebounded exactly at the purple long-term trend-line and green 102.5-104 k demand, reclaiming the 105-106 k support band; the old wedge cap is now acting as a floor.
● Price is coiling in a 16-h bull flag beneath 108 k; its 1.618 projection intersects the channel roof/ red supply at 111.6-115 k, while rising lows keep momentum pointed up.
💡 Fundamental Analysis
● U.S. spot-BTC ETFs attracted about $240 m of net subscriptions on 14 Jun, ending the outflow streak and signalling renewed institutional demand as exchange reserves slide to multi-year lows.
● Benchmark 10-yr Treasury yields are back under 4.45 %, easing dollar pressure and helping risk assets rebuild after the FOMC spike.
✨ Summary
Buy 105-106 k; flag breakout above 108 k targets 111.6 k → 115 k. Invalidate on a close below 101.8 k.
-------------------
Share your opinion in the comments and support the idea with a like. Thanks for your support!

Accumulate, BTC back above 110K💎 BTC PLAN UPDATE (June 16)
NOTABLE BITCOIN (BTC) NEWS:
Bitcoin (BTC), Ethereum (ETH), and Ripple (XRP) are showing signs of stabilization around key support levels following last week’s correction. BTC is attempting to regain momentum after closing below a critical support zone, while ETH and XRP are hovering near technical thresholds that could determine their next directional move.
TECHNICAL ANALYSIS OUTLOOK:
Bitcoin could decline further if it closes below the 50-day EMA
Bitcoin closed below its daily support at $106,406 on Thursday, then bounced back after retesting the 50-day Exponential Moving Average (EMA) at $102,893 on Friday. BTC has since stabilized around the $105,000 level over the weekend. As of Monday, it continues to consolidate, trading near $105,788.
If BTC fails to close above the $106,406 resistance level and heads lower, it may extend its decline toward the psychologically significant $100,000 level.
The Relative Strength Index (RSI) on the daily chart is hovering around the neutral 50 mark, signaling indecision among traders. Meanwhile, the Moving Average Convergence Divergence (MACD) indicator shows a bearish crossover on the daily chart, indicating selling pressure and a possible downtrend continuation.
At this stage, whether you're new or experienced, it's wise to spend more time practicing, deepening your technical analysis knowledge, and exploring educational content shared on the channel. Strengthening your foundation will help you protect your capital in this volatile environment.
==> This analysis is for trend reference only. Wishing all investors successful trades!

Monday trades of the day🔥 These are the scalps I’ve got my eye on today. 🔥
Mostly looking at continuation longs — unless structure tells a different story.
💡 Key Plan:
For each long setup, I’ll wait for an internal market structure (MS) flip before pulling the trigger. No confirmation, no entry. Precision is the priority.
📅 Class Schedule:
Monddaday | After 6 PM

BTC BITCOIN ,we are watching every step and price action,the next clear directional bias on long will be on the break and close of daily supply roof at 111k, while the sell confirmation will be on the break and possible retest of the daily ascending trending line holding buyers for today 16th.
Israel and Iran war could be seeing liquidity into crypto especially bitcoin

16/06/25 Weekly OutlookLast weeks high: $110,507.76
Last weeks low: $102,655.69
Midpoint: $106,581.52
With all eyes on the ever escalating geo-political landscape, how did BTC react and what can we see for this week?
The initial move higher broke through the previous weeks high with strength before a triple top just under ATH, then falling back down towards the lows of $102,650 which was the previous weeks midpoint, both levels were key battlegrounds as pointed out in the last weekly outlook.
Now the midweek fall off could be blamed by the escalating conflict in the middle-east, that is an argument that has merit as risk-on assets naturally take a hit when uncertainty enters the market. From a TA standpoint BTC had three separate attempts at $110,500 and failed it, the bulls therefore have to retreat as the battle is lost and have expended their resources. So I see it as a both FA and TA are responsible for the move.
As the week starts with a positive early move the orderblock at 0.75 line looks like the next key battleground, rejection at that level would see BTC enter a more rangebound environment within the weekly range. Flipping $108,500 makes a weekly high retest probable IMO.
I do believe that the geo-political aspect will play a role this week so volatility is expected.
Good luck this week everybody!

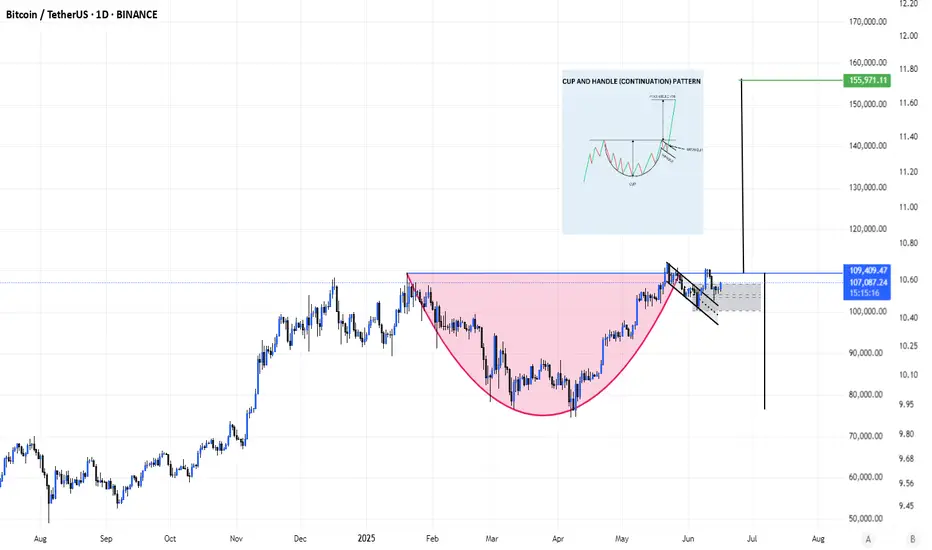
BTC/USDT.dBtc forming a beautiful Cup and Handle chart pattern. Target is $150k roughly. Price should really move hard once BTC goes above the neckline into price discovery. This is a good risk to reward setup. Enjoy!
Bitcoin (BTC): Gameplan Remains Same | Bullish Start of WeekBitcoin is showing signs of recovery, where buyers are taking over the Monday lows and pushing prices to upper zones. Now that we see the recovery, we are back in play, expecting the price to reach the ATH area once again, where we will be looking then for $120K.
Swallow Academy

BITCOIN: As simple as that!Hello Traders,
First of all, a big thank you to all the members of our community for being part of this journey. With Bitcoin reaching a new all-time high, we are about to witness even more bullish momentum unfold. 🚀
A special shoutout to @TradingView for providing an incredible platform that empowers traders like us to showcase our technical skills, build our identity, and grow from nothing to something.
Now, let’s head to the update:
Since September 2023, BTC has performed exceptionally well. We witnessed a strong rally lasting until March 2024 (around 180 days), followed by a period of consolidation. BTC then made another leg up, hitting the historic $100K mark. After another consolidation phase, we are now seeing the start of a new bullish rally. 📈
Based on current analysis, this rally is expected to reach between $130K and $150K, with the target likely being achieved by early Q3.
So, sit tight, stay focused, and enjoy the ride! 🥂
Best regards,
Dexter

Crypto Crash Is Coming! Time to sell everythingThe war is escalating every day, major hits in Tel Aviv , Haifa and big cities. US will get involved wether they want it or not, since Israel doesnt want to stop the war without fully destroying all threats and leaders, and it can't finish the war alone.
Btc have to fill the monthly gap, crash is coming.

Time to leave marketIf you are an investor, it seems the risk-to-reward ratio is too high to stay in the market. The crypto market is giving us the last chance before it goes bearish!
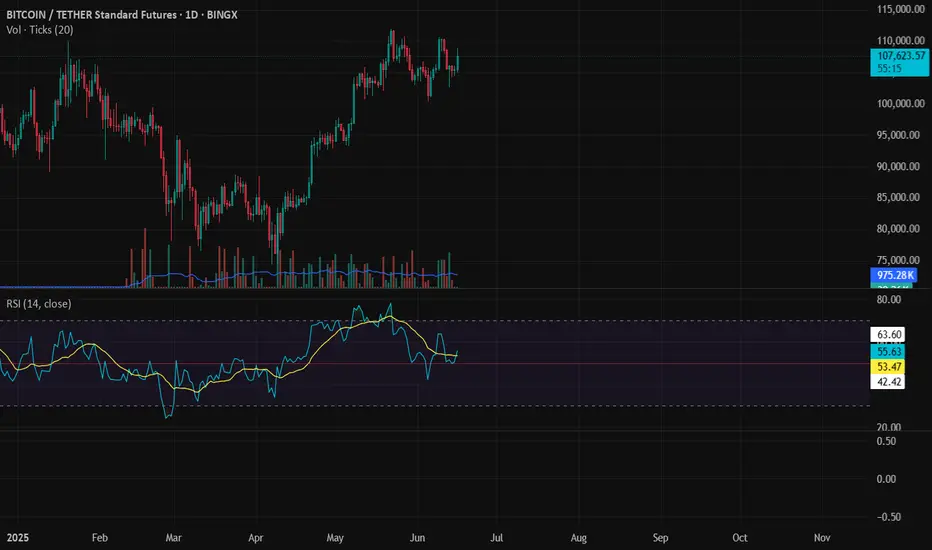
Just look at the volume on this chart to find out that the last ATH was not supported by the bulls.

BTC: Scalp Long 14/06/25Scalp Long
Risk is halved because weekend
Then additionally halved because counter HTF Trend =
0.25R Risk
Reason:
0.886 retrace
M5 EQL swept
M5 Ts
M15 Bull Div
H1 Bull Div
Still hoping we get a 106,700 retest. For HTF Higher probability shorts.
