The FVG was the invitation. The OB was the entryBTC delivered exactly where it needed to. It didn’t break down. It rebalanced. The chart isn’t noisy — it’s speaking. And it’s pointing to 108.3k.
The logic:
Price printed clean displacement, returned to mitigate a 1H FVG stacked on top of a refined Order Block, then paused. That pause is structure — not indecision. Volume compression confirms it: absorption, not rejection.
A deeper OB sits below at 102.5k. If we tap it, it’s not invalidation — it’s refinement. But the primary play is already in motion.
The path:
Reclaim 105.7k range high
Break above intraday liquidity
Deliver to 108.3k inefficiency fill
Execution:
Entry: 104.8k–105.1k (current OB zone)
SL: Below 103.9k
TP: 108.3k
Don’t react to the candles. React to what they represent — engineered displacement followed by precision mitigation.
Final thought:
“This isn’t a trade setup. It’s a delivery route — and I’m already onboard.”
BTCUSDT.P trade ideas

BTCUSDT: Sharing of the Latest Trading StrategyAll the trading signals today have resulted in profits!!! Check it!!!👉👉👉
Fundamental Analysis:
Expectations of potential regulatory easing by the U.S. Securities and Exchange Commission (SEC) on cryptocurrencies, coupled with rising interest from global institutional investors in crypto-asset allocation, have positively impacted the Bitcoin market.
Sustained net inflows into Bitcoin ETFs in recent days reflect market optimism about its long-term prospects.
Technical Analysis:
On the 4-hour chart, Bitcoin prices have found support multiple times within the $102,000–$104,000 range, forming a strong support level.
The MACD indicator remains above the zero line, with histograms contracting but still positive, indicating lingering bullish momentum. The DIF and DEA lines maintain a bullish configuration.
In the Bollinger Bands, price is trading near the middle band (currently at $104,700), which acts as support. A valid break above the middle band could unlock upward potential, with overhead resistance at $108,000.
Long Strategy:
Aggressive traders may initiate light long positions as price pulls back to the $104,700–$105,000 zone, setting a stop-loss below $104,000 and targeting $108,000.
Trading Strategy:
buy@ 104700–105000
TP:106000-108000
Share accurate trading signals daily—transform your life starting now!
👇 👇 👇 Obtain signals👉👉👉

Is BTC in a Wycoff Distribution?BTC has failed to breakout from $110k and hold. I am starting to notice a possible Wycoff distribution pattern on bigger and smaller timeframes. I am a long term bull on BTC so don't meant to sound like a bear but it is starting to show signs of weakness. Anything can happen and the market is always right. Stay safe!

$BTC - Weekend LTF OutlookBINANCE:BTCUSDT | 4H
We've got a swing point retest here on the 4-hour timeframe.
Immediate resistance at 106k, but I'm eyeing the internal liquidity — the wicks on both sides.
Most likely it’ll fill the upper wick first (107.3k–107.8k). If we reject there again, we could sweep the lower wick around 103.5k–103k.

Bitcoin in Mid-Term Uptrend, But Consolidating in Short-Term Ran📊 Bitcoin in Mid-Term Uptrend, But Consolidating in Short-Term Range
Bitcoin remains in a mid- and long-term uptrend, clearly shown by the white trendline on the chart. However, in the short-term, the price is consolidating inside a sideways range (highlighted in red).
If price bounces from current levels and starts pushing upward, it would confirm a higher low above the range support at $101,429, which increases the probability of an upside breakout. Otherwise, we could see another test of the range bottom.
The levels at $103,884 (support) and $106,258 (resistance) are not particularly strong, but can still be used for aggressive pre-breakout trades. Personally, I won’t enter trades at these levels just yet — I’d like to see more interaction and confirmation.
⚠️ Note:
Breakouts from this range are likely to be sharp and impulsive, regardless of direction.
For short setups, you could either wait for a breakdown of $103,884, or use a sell-stop below $101,429 — but I’m not taking shorts, as the overall trend remains bullish on higher timeframes.
On the long side, I won’t enter on a break of $106,258 unless we see a fakeout below $103,884, which would increase the probability of a successful long breakout.

BTC/USDTWhenever Bitcoin goes above 106k, we can enter a long position at the target I specified on the chart. What do you think? Tell me.

BITCOIN - Price can fall a little and start to move upHi guys, this is my overview for BTCUSDT, feel free to check it and write your feedback in comments👊
Price entered to rising channel, where at once bounced from support line and rose a little, and then corrected.
Next, price continued to move up and soon reached $100500 level, after which broke it and rose to resistance line.
After this movement, BTC corrected and continued to grow in rising channel and later reached $110500 level.
Bitcoin exited from rising channel, made a fake breakout of resistance level, and started to trades inside flat.
In flat, price tried to grow but failed and fell to support level and then grew back again, after which started to decline.
Now, I expect that BTC can repeat as move before, it falls a little and then grows to $110500 resistance level.
If this post is useful to you, you can support me with like/boost and advice in comments❤️

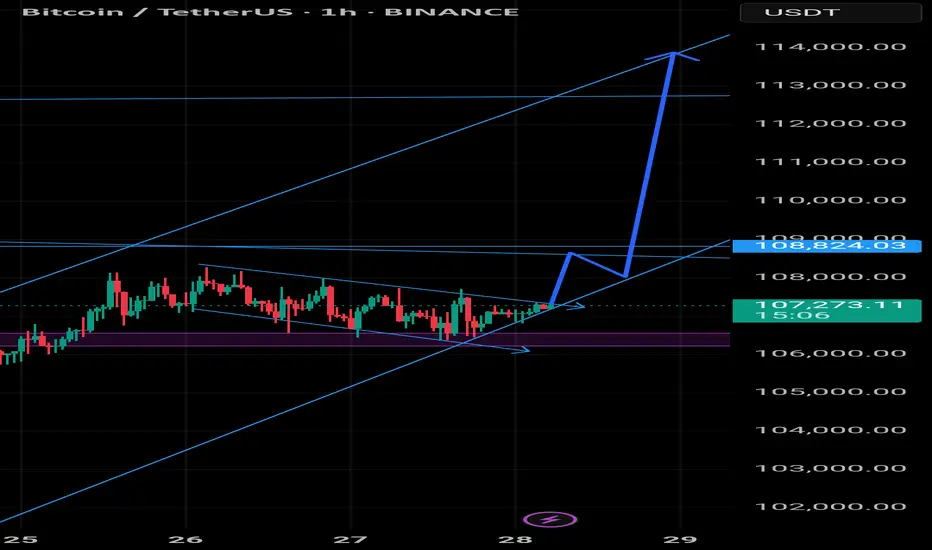
BTC/USDT Bullish Reversal Zone AnalysisSupport Zone:
The horizontal purple box (~104,000 USDT area) has acted as a strong support/resistance flip zone multiple times.
Falling Wedge Breakout:
The price action broke out of a falling wedge pattern earlier, confirming bullish momentum.
Flag Formation (Current):
A smaller bullish flag/pennant appears to be forming, and a breakout above could trigger a strong upward move.
Projected Move:
The black arrow indicates a potential bounce from this support zone, with the price targeting the 111,000–112,000 USDT zone (highlighted in the top purple box).
Volume Spike:
Notable volume spike near the bottom supports the idea of accumulation and possible reversal.
📈 Conclusion:
If the support zone holds and price breaks above the minor flag, a bullish continuation is likely toward the 111,000–112,000 resistance area. Traders should watch for confirmation of a breakout and volume increase for validation.

#BITCOIN: Accumulated Volume, Time For $150,000Bitcoin has accumulated nicely, but we don’t expect the price to distribute strongly towards $150k. We have set two targets: 125k and a swing target at 150k. Remember to have a confirmation before entering.
Good luck and trade safely,
Team Setupsfx_

BTC: Daily Timeframe 14/06/25Spot buyer again ~ $93k aka 0.5 retrace of the weekly leg
Higher timeframes swept (ATH) with confirmed deviation.
Expecting a corrective to continue healthy trend before more bullish continuation
If we set a lower high on the weekly, that’ll flip my bias and a far deeper corrective leg would be likely.
Right now long term BTC is the only crypto coin I hold as long term conviction remains unchanged its direction is up and to the right for many years to come.

BTC BITCOIN Bitcoin buy level on the green structure to watch will be on the 100k and my next buy watch zone will be 97-98k .
Growing institutional participation, including the launch and approval of Bitcoin ETFs is increasing liquidity and legitimizing BTC as an investment asset.
Macroeconomic Environment , Persistent low real interest rates by central banks and concerns about inflation support demand for Bitcoin as a store of value.
Geopolitical uncertainties and currency debasement fears boost Bitcoin’s appeal as a digital gold.
Bitcoin’s network security, hash rate, and active addresses remain robust, underpinning confidence in its decentralized infrastructure.
Continued development in scaling solutions and layer-2 technologies enhances usability.
Increasing regulatory clarity worldwide, including clearer frameworks for crypto exchanges and custodians, reduces uncertainty and encourages adoption.
However, regulatory risks remains a factor that can cause short-term volatility.
#bitcoin #btc

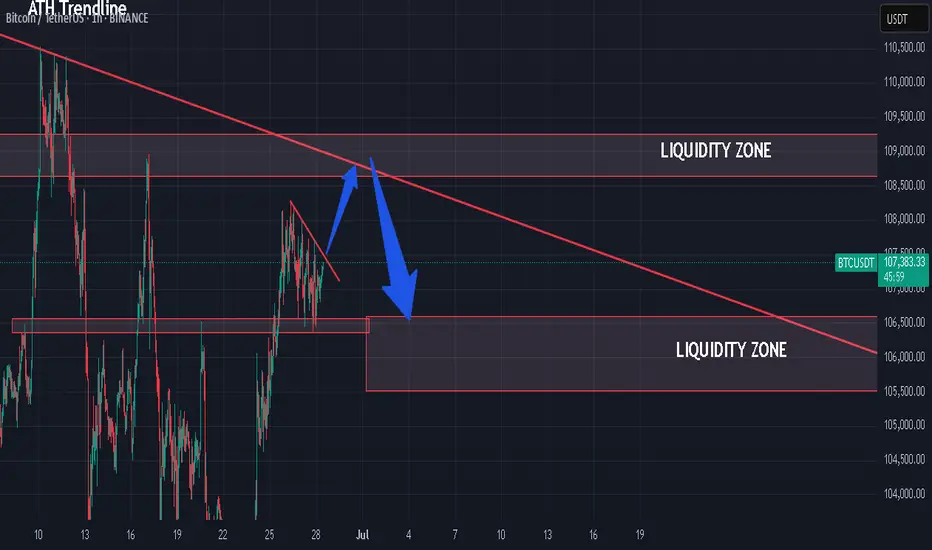
There is another Bearish BPR zone below the current price.BTC/USDT Market Update – Clear, Detailed, and Easy to Understand (Even for Beginners)
Let’s take a look at what’s happening with Bitcoin (BTC/USDT) right now explained in a way that even someone new to trading can follow along and understand.
Recently, Bitcoin hit a new high it was climbing up steadily. But then, due to negative global news related to war, the market took a hit and started dropping sharply.
Currently, BTC is trading at a (BPR) this is a technical area that often acts as a strong resistance zone, where the price tends to face rejection and reverse.
👉 Right now, Bitcoin is struggling to move higher and appears to be getting rejected from this BPR level.
But here’s where it gets more interesting:
🔻 There is another Bearish BPR zone below the current price, and the market has already touched that zone once before bouncing upward.
So what's the current situation?
📍 If Bitcoin is able to break above the current Bearish BPR (the level where it’s trading now) — it would be a bullish sign, and the market may start rising again.
📍 However, if BTC fails to break this resistance level, then we could see another strong move to the downside, possibly heading back to lower support zones.
🚨 Key Takeaway:
This level — the one BTC is currently interacting with — is very important.
📌 Traders should keep a close eye on it.
📌 Let the market reveal its direction before making any decisions.
Remember:
⚠️ This is not financial advice. Always Do Your Own Research (DYOR).

Using double PAR to perfect entriesUsing double PAR to perfect entries - This is a crash course but can be more involved for continuation trades

BTC SHORT BEFORE ATHLooking to first short BTC toward the weak low we created during Friday's Asia session. Price left it exposed clean liquidity. If we get the right confirmations.The fake BOS that will take place if we move higher just adds more conviction to my play in the case we do first push towards the daily BPR.
This move would clear the path, set the stage, and potentially give us the entry conditions we want for the higher timeframe play. Where we will be looking for longs towards ATH.
For the HFTF view and what comes after, check the other chart I posted earlier same blueprint, just higher up the ladder.

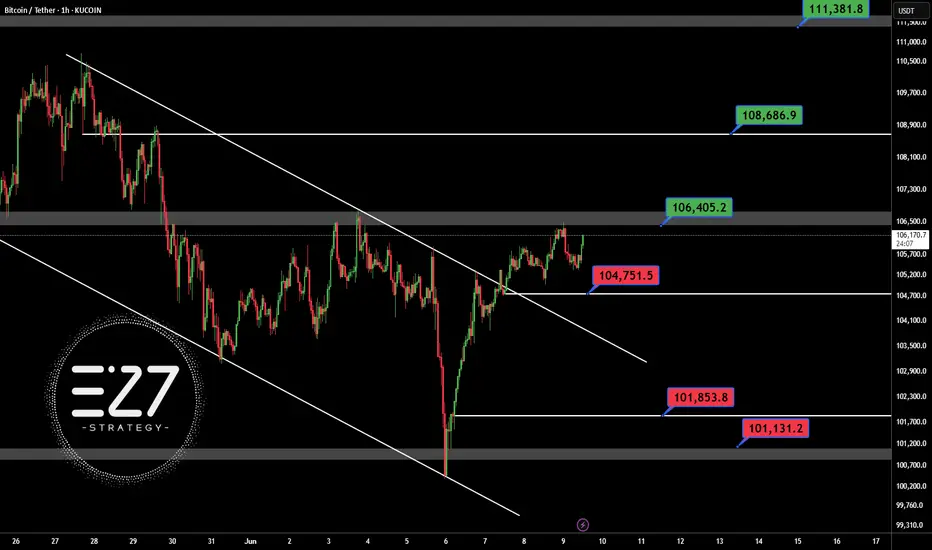
BTCUSDTSafe for open long position in BINANCE:BTCUSDT abow 106.400$ in H1 time frame.
First support: 104.750$
Best support: 101.850 - 101.131 $
First resistance: 106.400$
Best target this chart: 108.700 - 111.381$
Contol money management
Global M2 & BitcoinThe Bitcoin chart holds an open secret — and it’s still called: LIQUIDITY. 💥
Forget the media noise.
The current chart shows that global M2 liquidity (with a 12-week lead) continues to drive Bitcoin’s price almost entirely.
No magic. No coincidence.
Macro beats opinion.
If 89% of price movements can be explained by liquidity flows,
then the rest... is just background noise.

btc dirrection bitcoin collapse is coming be your tension at any time now the market is going up trend to correct or to touch the last double touch of the upper trend in order to finished structure then it come down till 95k to 90k

Sidelined Due to Geopolitical Tensions in the Middle East🛑 Sidelined Due to Geopolitical Tensions in the Middle East
Due to the rising geopolitical tensions and the ongoing conflict in the Middle East, I’ve decided to stay out of the market for now. War-related news often triggers short-term volatility, driven more by fear and uncertainty than technical or fundamental analysis. I prefer to wait until the market stabilizes and the emotional reactions fade, allowing for more reliable trade setups.

BTC - Falling Correction = Continuation?BTC has been playing by the rules lately!
Every time Bitcoin forms a falling correction, it turns out to be a bullish continuation pattern — and history might be repeating itself 👀
As shown on the chart:
Previous falling channels (flag/wedge structures) have consistently led to strong bullish impulses.
The current correction also appears to be a falling channel, hinting at another potential bullish leg soon.
As long as the structure holds and no major support is broken, the next target could be a new all-time high.
Let’s see if BTC continues to respect this textbook behavior.
📌 Remember: Falling corrections in an uptrend = healthy continuation!
📚 Always follow your trading plan regarding entry, risk management, and trade management.
Good luck!
All Strategies Are Good; If Managed Properly!
~Rich


Middle East peace/war = Bitcoin’s Explosive Price CoilDo you know why every time tensions rise in the Middle East, Bitcoin springs upward like a compressed coil?
This market reaction isn’t just a coincidence it’s the result of a mix of psychological and economic factors we’ll explore today.
Get ready to understand how these crises can create golden opportunities for the world’s favorite digital currency.
Hello✌
Spend 3 minutes ⏰ reading this educational material.
🎯 Analytical Insight on Bitcoin:
Price is approaching a significant support level that has held strong historically. A potential rebound from this zone could lead to at least a 7% upside move 📈, with the primary target set around $115,000—near a key descending trendline on the daily chart. Watching this level closely for confirmation 🔍.
Now , let's dive into the educational section,
Market Psychology: When War Plays with Fear and Greed 🧠
Middle East crises act like a spring: when released, they trigger intense fear in the market. Many traders react emotionally and start selling their holdings. The key point: this fear often flips into greed.
When Bitcoin’s price drops due to war fears, savvy traders seize the opportunity and enter the market. This cycle of fear and greed causes Bitcoin’s price to surge faster than usual just like a compressed spring suddenly releasing.
If you understand these market emotions and trade without bias, you can maximize gains from such volatility.
Key TradingView Tools for Bitcoin Analysis 📊
When the Middle East conflict heats up, market volatility spikes, affecting Bitcoin as a high-risk asset.
Using essential indicators like RSI , Fibonacci retracements , and volume on TradingView helps you pinpoint precise entry and exit points and better understand market reactions.
Practical Tips for Better Tool Usage ⚙️
To get the most out of TradingView:
Activate several indicators simultaneously and compare price movements with volume.
Draw Fibonacci retracements on previous trends to find key support and resistance levels.
Check RSI to see if Bitcoin is overbought or oversold.
Monitor trading volume to confirm momentum shifts.
This approach turns your analysis from guesswork into a logical, actionable strategy.
How Middle East War Drives Bitcoin Growth: Final Analysis 🚀
As tensions escalate, investors seek safe-haven assets, and Bitcoin, known as digital gold, attracts massive attention. Also, banking restrictions and sanctions push liquidity toward cryptocurrencies.
These condition s, combined with market psychology and the analytical tools we covered, make Bitcoin behave like a compressed spring that suddenly leaps upward, driving significant growth. Traders aware of these trends and skilled in using indicators and sentiment can find better profit opportunities.
Recommendations 📌
Geopolitical tensions in the Middle East act as a powerful trigger for Bitcoin volatility. Understanding market psychology, smart use of TradingView tools, and having a solid risk management strategy are key to success in such times. I recommend keeping an eye not just on technical analysis but also on market sentiment and political news to make the best timely decisions.
✨ Need a little love!
We put so much love and time into bringing you useful content & your support truly keeps us going. don’t be shy—drop a comment below. We’d love to hear from you! 💛
Big thanks,
Mad Whale 🐋
📜 Please remember to do your own research before making any investment decisions. Also, don’t forget to check the disclaimer at the bottom of each post for more details.

BTC Trade Setup 28.06.2025 BTC Possible Trade Setup.
Entry 108.600 - 109.000
TP.1 106.500
TP.2 105.500
SL 110.000
its my own analysis, i am not liable of any loss.
Btcusdt A break above the trend line could lead to a potential run up in BTC price but a break below the purple support could lead to a drastic drop in price