BitSupport and resistance levels are identified on the one-hour timeframe, and the momentum increases in either direction when broken.
BTCUSDT.P trade ideas

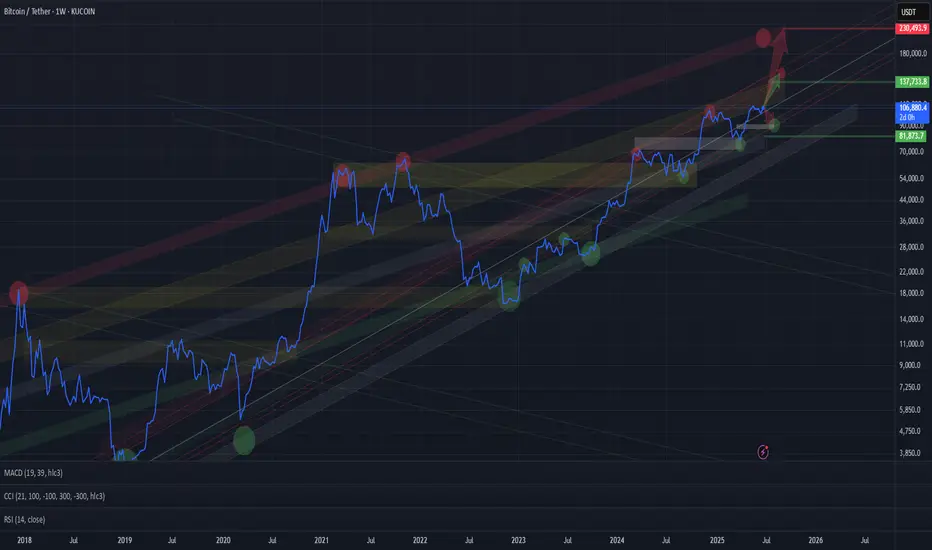
Bitcoin Weekly & $120,000This weekly Bitcoin chart says it all... Please, allow me to reveal to you what the future holds!
Good evening my fellow Cryptocurrency trader, what a wonderful day.
Only one week ever produced a higher close than the current price. Only once, 19-May, Bitcoin managed to close above $107,000... What happens if Bitcoin closes above $107,000? New all-time high confirmed.
Two days remain for the week to close and we—the bulls—only need to maintain a price of $107,000 or higher to send such a strong bullish signal that everybody will come out and start buying.
The next target on this timeframe is $120,000.
Bitcoin is using EMA13 as support. This level was tested and holds, the same for EMA8. When Bitcoin moved above these levels in April, it produced an advance from $83,000 to $112,000, more than 33%. The price now is $107,000 but instead of recovering from below EMA8/13, BTCUSDT is trading above; this means that the bullish bias is fully confirmed.
The weekly timeframe looks great. We can expect higher prices soon, with growth happening for an extended period of time. Bitcoin is very strong now and this is only the start.
I will continue to share proof that shows the entire Cryptocurrency market going up.
Thank you for reading.
Leave a comment with your questions.
Thanks a lot for your support.
Namaste.

BTC UP OR NO📈 Bitcoin to Reach $113K, With a Breakout Path to $120K – A Professional Outlook
After analyzing the macro trend, technical structure, market sentiment, and on-chain behavior, I strongly believe that Bitcoin is on a clear trajectory toward $113,000, with a potential extension to $120,000 if key resistance is broken.
---
🔍 1. Technical Analysis Perspective
Macro Bullish Structure: Since the 2022 bear market bottom, Bitcoin has maintained a consistent higher highs and higher lows pattern, confirming a long-term uptrend.
Fibonacci Extension: The 1.618 Fibonacci extension from the $15.5K bottom to the $69K peak gives a projected target of around $113K.
Historical Fractal Patterns: In previous cycles, Bitcoin has always broken past previous all-time highs by 1.5x to 1.75x, placing this cycle's peak in the $110K–$120K range.
Ascending Triangle Breakout: On the weekly chart, BTC is forming a bullish ascending triangle with the top resistance at ~$73K. A confirmed breakout targets $113K as the next major supply zone.
---
🧠 2. Market Psychology & Cycle Timing
Halving Effect: Historically, Bitcoin peaks occur 9–12 months post-halving. The most recent halving was in April 2024, aligning a potential peak by Q1 or Q2 of 2025.
Psychological Resistance Zones: The $100K–$113K range is not only a Fibonacci target but also a powerful psychological barrier. Once breached, FOMO and institutional momentum could push BTC rapidly to $120K.
Retail vs Institutional Flows: Data shows increased ETF inflows and long-term holder accumulation — a classic pre-peak indicator.
---
🔗 3. On-Chain and Whale Behavior
Realized Price vs Market Price: BTC market price is well above long-term holder realized price, signaling bull market phase 2 (the steep climb).
Dormant Supply: Over 70% of BTC has not moved in 6+ months, showing strong holder conviction. This reduces sell pressure as price increases.
Whale Accumulation Zones: Whales are heavily positioned around $60K–$65K, and there is minimal sell volume above $100K on major exchanges, opening the path to $113K with low resistance.
---
🚀 Conclusion:
> Based on comprehensive technical patterns, market structure, psychological phases, and on-chain behavior, Bitcoin is highly likely to reach $113,000.
If momentum continues and $113K is breached with volume confirmation, a sharp move toward $120,000 becomes not only possible — but likely.

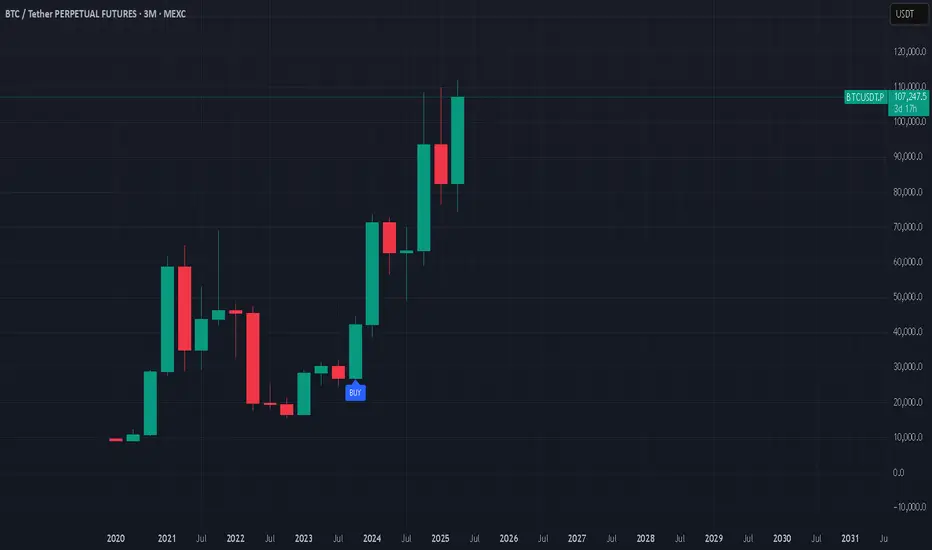
BTC BTC/USDT LONG_TERMChannels are drawn, long-term targets are clear. The upper extreme visible so far is around $200K for Bitcoin — possible within this cycle.
More realistic targets for this cycle are around $135K.
In the short term, a correction to the lower red channel zone ($88K–94K) is possible.
Watching closely.
BTC - A New Oregon Trail or Fool's Gold?The ranch hand (chart) reckons Bitcoin hit a big wave‑3 peak, then swung into a corrective wave‑4 saddle.
Now it's circling the watering hole, teetering around a key resistance near $110k—the cowboy‑critical line in the sand.
If that line holds strong, expect another surge—an “inverse wave‑4, strong 5” push higher toward $115–120k.
But if it buckles, a darker scenario’s afoot: a red‑inked, five‑wave drop galloping down toward $85k.
Bottom line: keep your hat on—$110k is the frontier. Break above that, and the herd’s heading north; if not, saddle up for a ride downhill.
BYBIT:BTCUSDT.P
BITSTAMP:BTCUSD

Sharing the advanced Bollinger Bands strategyHere are the Bollinger Band trading tips: *
📌 If you break above the upper band and then drop back down through it, confirm a short signal!
📌 If you drop below the lower band and then move back up through it, confirm a long signal!
📌 If you continue to drop below the middle band, add to your short position; if you break above the middle band, add to your long position!
Pretty straightforward, right? This means you won’t be waiting for the middle band to signal before acting; you’ll be ahead of the game, capturing market turning points!
Let’s break it down with some examples:
1. When Bitcoin breaks above the upper Bollinger Band, it looks strong, but quickly drops back below:
➡️ That’s a “bull trap”—time to go short!
2. If Bitcoin crashes below the lower band and then pops back up:
➡️ Bears are running out of steam—time to go long and grab that rebound!
3. If the price keeps moving above the middle band:
➡️ Add to your long or short positions to ride the trend without being greedy or hesitant.
Why is this method powerful?
It combines “edge recognition + trend confirmation” for double protection:
1. Edge Recognition—spot the turning point and act early.
2. Trend Confirmation—wait for the middle band breakout and then confidently add positions!
You won’t be reacting after the fact; you’ll be ahead of the curve, increasing your positions in the trend’s middle and locking in profits at the end. This is the rhythm of professional traders and the core logic of systematic profits!
Who is this method for?
- You want precise entry and exit points.
- You’re tired of “chasing highs and cutting losses.”
- You want a clear, executable trading system.
- You want to go from “I see the chart but don’t act” to “I see the signal and take action.”
Follow for more. Make sure to like this if you found it useful.

Are we out of the woods? BTC has been trading above the golden pocket for three consecutive days. This should give us a technical target of at least 110k, where the next major resistance lies.

BTC next boom beginning I'm going to see boom in btc
Here’s the analysis of Bitcoin’s (BTC) next expected move in English, based on current market conditions and technical indicators:
---
### **1. Short-Term Outlook (Next 24-48 Hours)**
- Bitcoin is currently trading around **$107,400**, with **$108,000-$109,000** acting as a strong resistance zone.
- If BTC breaks above **$109,870** and closes above it, the next target could be **$114,950**.
- If the price fails to break resistance, a pullback to **$105,300** or **$103,900** (support levels) is possible.
- The **30-minute RSI is at 52.22** (neutral-bullish), and the MACD histogram is in positive territory.
---
### **2. Medium-Term Outlook (1 Week to 1 Month)**
- **Coincodex predicts**:
- **$116,914** (+8.98%) by July 2025.
- **$136,858** in the next 3 months.
- **DigitalCoinPrice forecasts**:
- Average price of **$221,961** by late 2025, with a potential high of **$235,354**.
---
### **3. Key Technical Indicators**
- **4-Hour Chart**:
- BTC is testing the **upper Bollinger Band ($108,672)**. A breakout could target **$114,956**.
- **Support Levels**:
- Immediate support: **$105,358** (EMA 100).
- Strong support: **$103,996**.
---
### **4. Market Sentiment**
- The **Fear & Greed Index** is currently at **74 (Greed)**, indicating bullish sentiment but also potential overbought conditions.
- **Volume**: Stable buying volume suggests sustained interest, but a drop could signal consolidation.
---
### **5. Potential Scenarios**
- **Bullish Case**: Break above **$109,870** → Rally toward **$114,950-$116,000**.
- **Bearish Case**: Rejection at resistance → Drop to **$105,300-$103,900**.

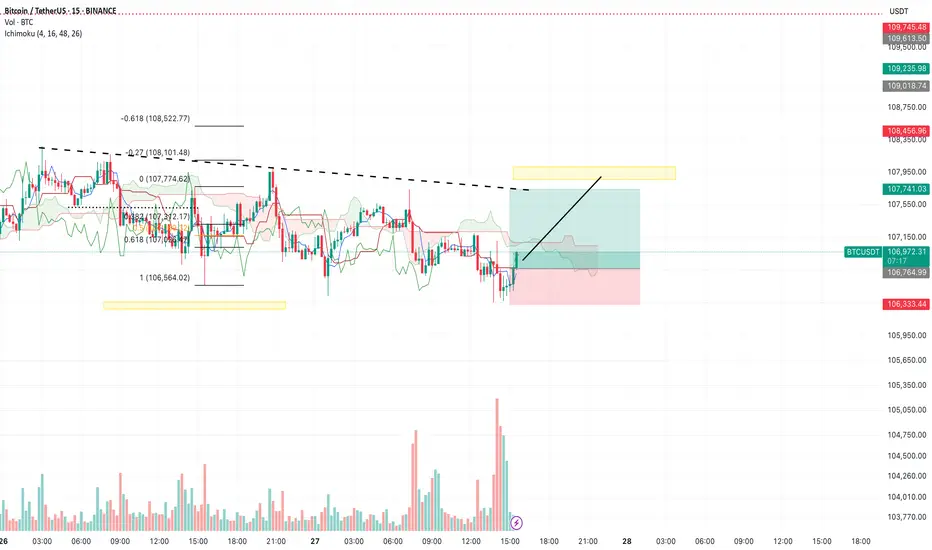
BTC/USDT – Intraday Plan (15m, Ichimoku) by RiscoraToday’s idea:
We’ve seen strong volume at the current support zone. My expectation is for a move upward towards the yellow block at 107,900, targeting liquidity that has accumulated above the dotted trendline.
This is my main scenario for today: a range-bound session with a liquidity sweep to the upside. Watching for reaction as price approaches the yellow zone.
#BTC #Crypto #Trading #Ichimoku #Riscora
BITCOIN - SHORT OPPORTUNITY AND LACK OF MOMENTUMBINANCE:BTCUSDT has been lacking momentum in the last few days. It looks to me that "Good News" is almost "No News" in regards to the Iran war or any crypto legislation. Summer is looking a lot like sideways movement, and due to the previous explosion in momentum and volume, I think the lack of it will bring the price down in the following days or weeks.

BTC 1W ideaLooks like Bitcoin is in the middle of the distribution which targets at $160k. Flag pattern.

Bitcoin Controlled consolidation above 106,480 Technical Overview – Summary Points
➤ BTC trades in the 1st quartile of its yearly range (100k – 111k).
➤ Stacked resistance zone: 108,239 to 110,603 USDT → potential seller exhaustion.
➤ Key support at 106,480; defensive cluster 102,626–99,581.
➤ Risk On / Risk Off Indicator = Strong Buy; ISPD Divergence = Neutral.
➤ Normal volume, but lack of fresh capital → sustainability of rally questionable.
__________________________________________________________________________________
Strategic Summary
➤ HTF trend bullish above 106,480; breakout > 108,239 targets 109,950 / 110,600.
➤ Buy swing pullbacks on 106,480 or 104,600. Invalidation < 102,626 = drop to 99k.
➤ Tactical short scalps around 108,250–109,000.
➤ Core PCE = major catalyst (June 27).
➤ Watch spot volumes, funding, and Risk On / Risk Off signals.
__________________________________________________________________________________
Multi-Timeframe Analysis
➤ 1D : bullish bias > 106,480; danger < 102,626.
➤ 12H : bullish consolidation; confirmed breakout > 108,239.
➤ 6H : compression; buy dips 106,480 / 104,600.
➤ 4H : lateral-bullish; key support = 104,600.
➤ 2H : neutral-bullish; triggers = 107,800 / 106,000.
➤ 1H : bull flag; micro-divergence, prefer long > 106,950.
➤ 30 min : tight triangle; breakout at 107,200 / 106,650 = signal.
➤ 15 min : bearish < 106,950, expected bounce on 106,480.
__________________________________________________________________________________
Macro, News & On-Chain Analysis
➤ Macro backdrop: “Higher for longer” stance continues, no FOMC imminent.
➤ Core PCE June 27: upside surprise (2.7% YoY vs 2.6% expected) – USD supported, potential headwind for risk assets.
➤ Pacific Region: ongoing tensions in Taiwan Strait and South China Sea:
- Increased military activity: air incursions, naval maneuvers.
- High risk of escalation flagged by defense analysts & social feeds.
- Risk sentiment: volatile – sudden events could trigger risk-off.
➤ On-chain: Range 100–110k; weak spot volume; cautious leverage; no major sell-side imbalance.
__________________________________________________________________________________
Conclusion
➤ BTC maintains a controlled bullish bias > 106,480.
➤ Swing buy zones = 106,480 & 104,600; targets 109,950 / 110,600.
➤ Main risk: break < 102,626 = sell-off toward 99k.
➤ Monitor Core PCE and geopolitical risk in the Pacific region.
__________________________________________________________________________________

BTC 120K READY ???BTC 4H Chart Update 📉📈
Bitcoin is still trading inside a descending channel, but bulls are now testing the upper trendline for a potential breakout.
Price is consolidating just below $107K, showing strength after the recent bounce from the bottom of the channel.
🔹 Structure: Descending Channel
🔹 Current Resistance: $107K–$110K zone
🔹 Break & close above = bullish breakout confirmation
🔹 If breakout and close above 110k than this target possible
🔹 Target after breakout: $112K-120K+
⚠️ Rejection = pullback likely toward $103K–$104K support
📊 Breakout or breakdown — decision time is near!
#BTC #Bitcoin #Crypto #TechnicalAnalysis #BreakoutSetup

Called The Bottom GuysThem: "How did you call the start of the Rally?"
Me: ...
#crypto #bitcoin #trading #portfolio
Using the 6Hr CPR to take tradesUsing the 6Hr CPR to take trades on the 15 min TF. Combining with my PAR momentum indicator.

Cup and handle reversalA cup and handle is a technical chart pattern that resembles a cup and handle where the cup is in the shape of a "u" and the handle has a slight downward drift.
A cup and handle is considered a bullish signal extending an uptrend, and it is used to spot opportunities to go long.
Technical traders using this indicator should place a stop buy order slightly above the upper trendline of the handle part of the pattern.
The pattern was first described by William J. O'Neil in his 1988 classic book on technical analysis, How to Make Money in Stocks.

Head and sholdersHead and shoulders on BTC.
A head and shoulders pattern is a technical indicator with a chart pattern of three peaks, where the outer two are close in height, and the middle is the highest.
A head and shoulders pattern—considered one of the most reliable trend reversal patterns—is a chart formation that predicts a bullish-to-bearish trend reversal.
An inverse head and shoulders pattern predicts a bearish-to-bullish trend.
The neckline rests at the support or resistance lines, depending on the pattern direction.

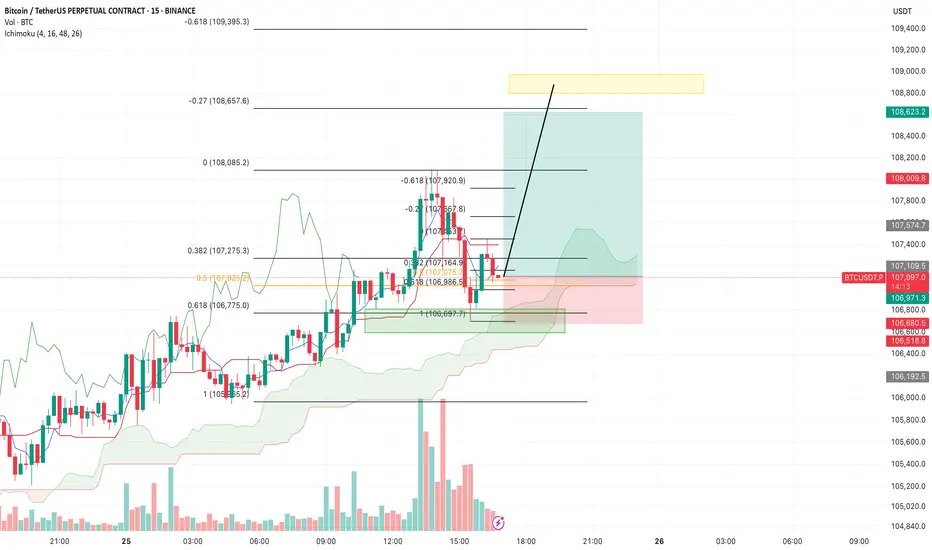
BTC/USDT – Daily Plan (15m, Ichimoku) by RiscoraYesterday’s idea worked out perfectly: price reached the target block and continued its upward move. Today, bulls remain firmly in control, and I expect the bullish trend to continue towards the 108,620 area.
The recent pullback is viewed as a correction within the ongoing impulse. Buyers are clearly dominating the market, so my main scenario is further growth to the yellow block, where significant liquidity from short liquidations is clustered. I expect price to reach this range today, and I’m considering long setups on any corrective moves.
Key levels:
Main target: 108,620 (yellow liquidity zone)
Critical support: 106,676
If price closes below 106,676, or we see no bullish reaction for an extended period, I’ll consider that bulls may be losing control and a deeper reversal could follow. For now, the bias remains bullish.
Watching price action closely and will update if conditions change.
BTC/USDT – Intraday View (15m, Ichimoku) by RiscoraYesterday’s plan worked out partially. For now, I believe the bullish move has run its course and today we should see a corrective phase. My main target for the correction is the yellow block at 106,300.
Ideally, I’d like to see a pullback towards the entry area before the move continues.
The scenario is invalidated if we break above the previous high — in that case, I’ll reconsider the outlook.
Key levels:
Correction target: 106,300 (yellow block)
Entry retest preferred
Invalidation: new local high above yesterday’s peak
Monitoring price action and will update if the setup changes.

What's Next For Bitcoin?Bitcoin Eyes A New ATH In the Upcoming Days...
But Do Not Be Surprised If BTC Drops Back To 90K.
Studying Previous Cycles, Showed Massive Drop Before the Bull Run.
#bitcoin #crypto #btc #trading #trader #portfolio #technicalanalysis

BTC Short from H1 FVG + H4 OB Confluence — Risky Setup✅ Price in strong supply confluence (H1 FVG + H4 OB)
✅ SFP & order block add to short case, but context is choppy
⚠️ Trade is low conviction, manage size and stops accordingly
Short Scenario:
Entry: In $107,500–$108,500 zone (confirmation from SFP/OB)
Target: $104,000–$105,000 (D1 FVG zone)
Stop: Above $108,500 or invalidate on strong reclaim
🔔 Triggers & Confirmations:
Look for reaction (SFP, rejection wicks) in FVG/OB zone before adding
Exit quick if invalidated or strong momentum up
🚨 Risk Warning:
Not a high conviction setup; use smaller position size and stay nimble

BTC/USDT – Fakeout Above Rising Channel | Why Clean Breakouts StThis chart highlights an important lesson in breakout trading: Not all breakouts are valid, even when backed by volume.
🔍 Technical Breakdown:
BTC was trading inside a well-respected ascending channel, with multiple touches on both the upper and lower bounds.
Price broke above the channel with a 15-minute candle close and volume, giving the appearance of a clean breakout.
However, shortly after, price re-entered the channel, invalidating the breakout. This is what we call a fakeout or bull trap.
❓ So Why Did the Breakout Fail?
Lack of Follow-Through Buyers:
Despite volume, there wasn’t enough buyer continuation above the breakout level to sustain momentum.
Liquidity Hunt:
The wick beyond the upper trendline likely served to trigger breakout entries and stop losses of short sellers, only to reverse after liquidity was collected.
Key S/R Reaction:
After re-entering the channel, price reacted at a minor horizontal level (previous S/R), attempted another push, but failed again, confirming weakness.

Breakout on multiple levelsWe're having a breakout on price, RSI and MACD - unless we dump into the daily close.
