BTC: H4 Plan 25/06/25Trade Plan – H4 BTC
Market Context:
- Total market cap has retraced into a 4H order block
- BTC is holding stronger relative to total
- Market has been range-bound for 43 days – HTF is sideways
Key Levels:
- 3.18T on total = clean long trigger, aligns with BTC monthly close + daily FVG + 0.5 fib retrace
- 110k = equal highs, 0.886 fib level, clear derisk point for intraday and key supply zone
Trade Strategy:
- Wait for 3.18T retest on total market cap before entering
- Look to long BTC on any dip into monthly close + daily FVG + 0.5 retrace region
- Flip short at 110k – until breakout is confirmed, treat this as a range-bound environment
BTCUSDT.P trade ideas

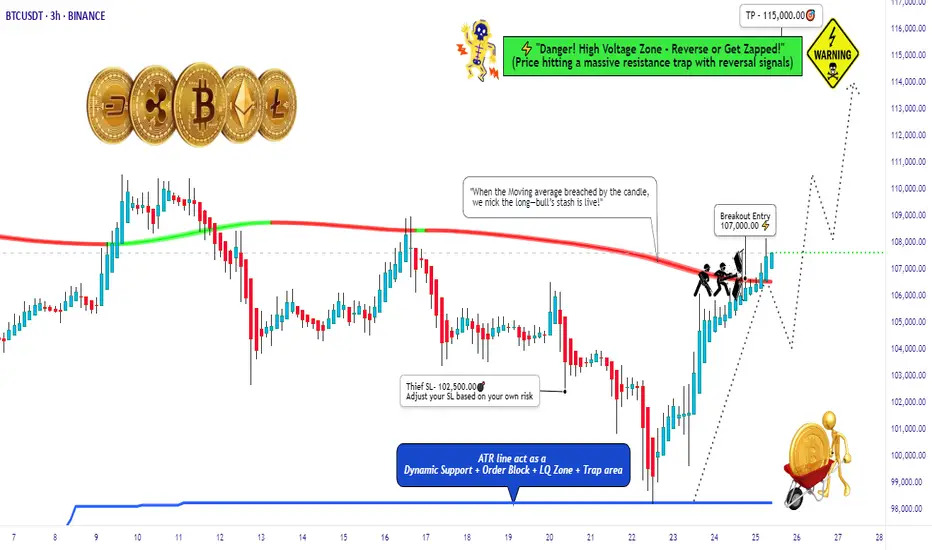
BTC/USD Thief Breakout at $107K – Eyeing $115K!🚨 Thief Entry Setup: BTC/USD Breakout Play 🚨
Overview:
Jump in after the $107 000 breakout—aiming for $115 000 with a tight “Thief SL” at $102 500. Adjust the stop‑loss to match your personal risk tolerance.
🧠 Setup Summary
Pair: BTC/USD
Entry trigger: Breakout above $107 000
Stop‑Loss: “Thief SL” at $102 500 (use your own risk‑based SL)
Target: $115 000
🎯 Why This Setup?
Clear breakout level at $107 000 = fresh momentum
Tight SL cushion (≈‑4.3%) = defined risk
Target ≈ +7.5% potential = strong reward-to-risk (~1.75:1)
📏 Risk Management Tips:
Only risk a small % of your capital—never exceed your comfort zone.
Move your SL to breakeven once mid‑target is hit to lock in profits.
Trailing your stop‑loss could secure bigger gains if BTC surges toward $115 000.
What now BTC?#bitcoin price has been moving in an ascending wedge for a few days. Although ascending wedges may end up bearish, there' s another chance for #btc price to break out this wedge and catch upper liquidities above 108K. But, also there' s a bearish divergence has been forming in this lower time frame chart of #btcusdt .
Maker may ignore this divergence and allow bots to print another HH but it' s now wise to be careful and watch out. The reverse is acceptable for #usdt dominance chart.
Breaking out 110K is the temporary invalidation of bull trap and above 120K is the complete invalidation.

$btc long zones set upsth: htf + ltf liq + sh fib lvls + 61.8 fib 1d + 78.6 1d fib + cypher 1d harmonic pattern

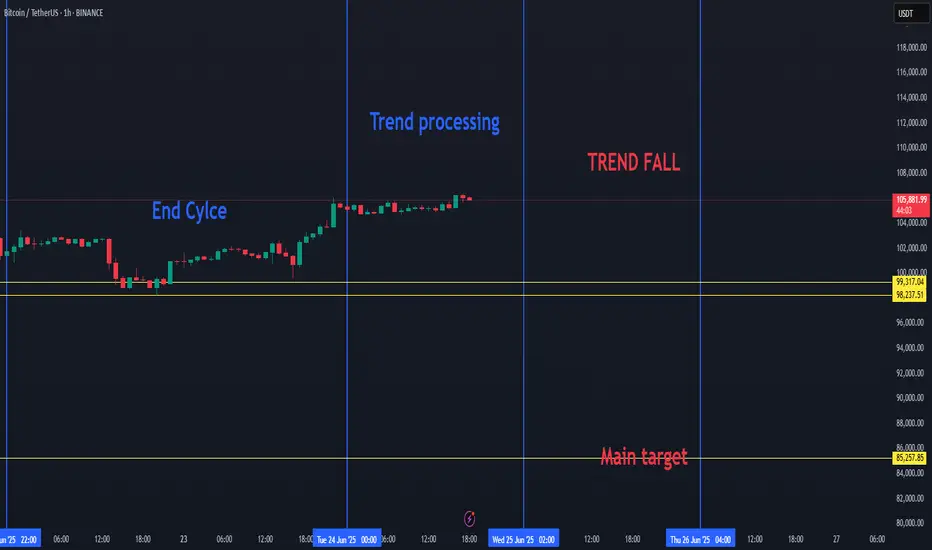
BTC HIGH DATA SHOW BREAKDOWN TO 85K FOR BITCOIN SOON.Bitcoin Market Update
BTC SEEMS TO ENTER A NEW CORRECTION PHASE SOON.
Recent data suggests that the current Bitcoin (BTC) cycle is coming to an end. As a result, we may soon see a downward move in BTC's price. The key target in this potential drop is around $85,000, with expectations that BTC will fall below $100,000.
This week, Bitcoin completed its cycle trend and is now entering a processing or transitional phase. Once this phase ends, we anticipate another decline in price.
This outlook is based on recurring patterns seen in previous BTC cycles, which have shown similar behavior in the past.
BTC can play on the low time frame with uptrends and downtrends, but if we will choice a side, then it will be the red trend.. since BTC cycle is ending.
Market next target ⚠️ Disruption Analysis – BTC/USDT
1. False Bullish Narrative
The chart labels the structure as “Bullish”, yet recent price action shows:
A strong rejection near 106,000.
Followed by multiple red candles with increasing volume — a common sign of sell pressure re-entering the market.
The bullish label may be premature or misleading based on this momentum shift.
2. Bearish Structure Developing
The price is starting to form a lower high after the sharp drop.
The outlined path resembles a head-and-shoulders pattern in early development, often preceding a bearish breakdown.
The breakdown could lead directly to the "Target" zone or even below if momentum increases.
3. Volume Divergence
The volume spike during the pump was not sustained. Post-spike, volume is declining on green candles, suggesting buyers are exhausted.
Sellers are likely using liquidity at the top to exit positions, not initiate new longs.
4. Support Turned Resistance
The red boxes mark failed support zones which now may act as resistance.
If price attempts to retest these zones and fails, it would confirm bearish control and validate the downward path toward the target (104,400–104,000).

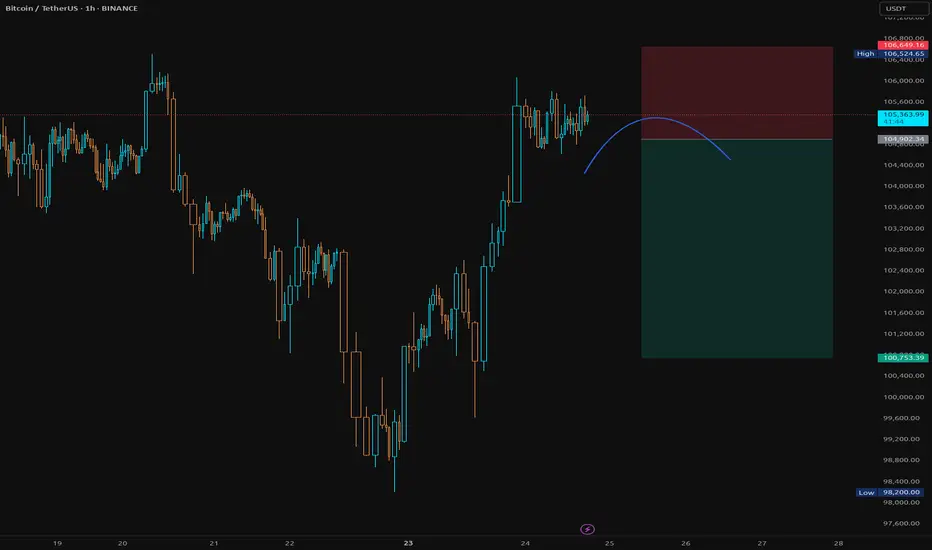
BTC Short Setup – Breakdown Below Structure💡 Idea:
Bitcoin is consolidating under a key structure after a sharp bullish move. If price breaks below the curved neckline, it could signal the start of a local downtrend.
🔔 Trade Plan:
Entry: Below $104,902 (after a clear 1H candle close under the curved line)
Stop-Loss (SL): $106,649 (above the recent swing high)
Take-Profit (TP): $100,735 (targeting major support zone)
Risk/Reward: Approximately 1:2.38
🧠 Reasoning:
Price is forming a rounding top structure, indicating potential exhaustion of bullish momentum. A break below the curve could lead to a retracement toward the $100k support level.
📆 Timeframe: 1H
⚠️ Always wait for confirmation and manage your risk.
Where are we going?BTC is at a critical level of resistance at the prior low. Breaking above this level would suggest a change in the trend. A rejection would suggest a final downward movement, which I would prefer in order to complete a 1-2-3-4-5 wave count and avoid an expanded flat correction.

Bitcoin Overall: Larger correction may be overWhile I believe it is still possible to target the more global support zone below, a sequence of events like that shown (another smaller push higher before a larger drop) would suggest BTC is on its way to new ATH again.
Conversely, a larger drop from current resistance levels would suggest we still have one more larger leg down to me.

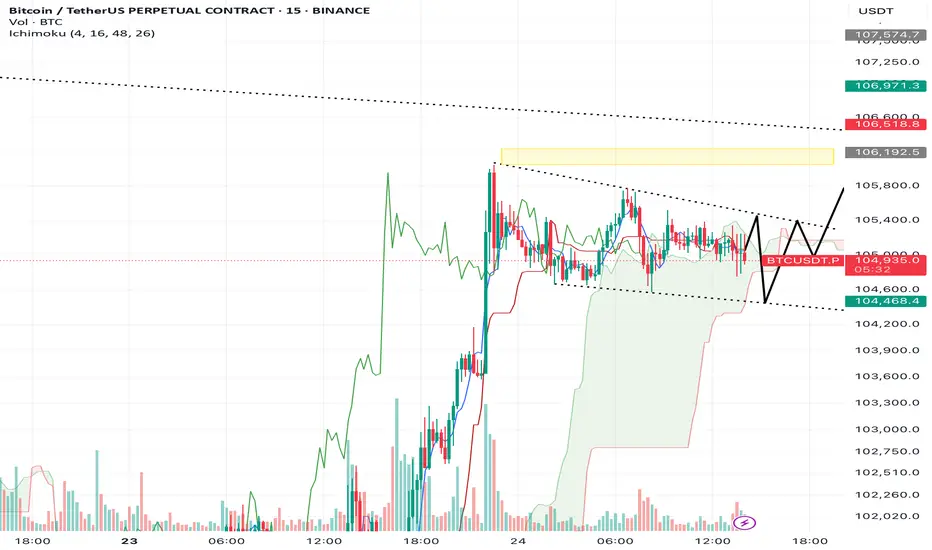
BTC/USDT – Intraday Plan (15m, Ichimoku) by RiscoraMy main scenario for today:
Expecting BTC to sweep the lows near 104,350, then see strong buying interest and a move up towards the yellow liquidity block around 106,300 by the end of the trading day. Ideally, I want to see this reversal on clear volume.
If there’s no strong buy reaction at 104,370 and buyers fail to step in, then I expect BTC to break lower — without reaching the yellow zone — and continue down by the width of the current channel.
Key zones:
Support: 104,350–104,370
Target if bullish reaction: 106,300 (yellow block)
Failure to bounce: deeper downside move, channel breakdown
Watching price action and volume closely at support for the next trade trigger.
Instructions on how to potentially use the SIG[TP/SL (1H-4H-1D)]It's a HF algorithm for the 1H,4H,1D Time-Frames. Which means whenever the instrument reaches the open price, the algo might give a lot of signals and sometimes it might give plenty of reverse signals. In order to use the specific algo in the best possible way, here's a helpful guide on how to potentially use it:
1)Wait for the instrument to reach the open price.
2) ALWAYS, Follow the signals, e.g: We are at the open price. If it indicates buy signal, then open a long position. If for example 5 seconds later (again at the open price) it indicates a sell signal, then reverse the long position into a short position, and keep doing it until it gives a signal, that will be followed by a good sized candle.
3) The safest way is to close the trade when the price reaches the potential TP1.
4) Happy Trading!
*The text above is not an investment advice, and it does not guarantee any profit.

Bitcoin (BTC): Buyers Back in Play | Buyside DominanceBitcoin had a strong sell-side movement recently, which led the price below the EMAs and showed us again the failed breakout attempt.
What we saw was news-based movement, which got eaten up very quickly by buyers, where the price is now back above the 100K area and going again for an attempt to break out from here.
Nothing is confimed yet but what we saw was strong buyside dominance!
Swallow Academy

Played it perfectly: grabbed long liquidity and rode down to ourHey everyone!
Move unfolded exactly as we planned:
Minor price spike – a classic false breakout to collect liquidity in the long zone.
No valid short formation, so I stayed sidelined during that spike.
Once long liquidity was swept, the market reversed sharply downward—right toward our objective.
Price then steadily slid to our lower target, closing the trade with the planned profit.
📊 Key takeaways:
Don’t force entries without clear setups.
Liquidity grabs in line with your overall scenario are powerful signals.
Patience and discipline remain the ultimate edge.
What are your thoughts? Share your experiences with similar liquidity hunts!

NEW BTC HIGHS?BTC just broke a previous resistance zone. Previous data indicates a more upward push.
This may even lead to new highs.
$BTC Breaks Out $110K in Sight?CRYPTOCAP:BTC has broken out of its descending channel and is now trading around $105K.
This breakout signals a potential trend reversal, with a projected move toward $111K.
Holding above the breakout zone could confirm further bullish momentum.
DYRO, NFA

Is BTC having War INDUCED PA? - 110k?
Owing to this the movement has been commenced due to the ceasefire! Whats next?
The move can be seen on the bit up 106,500 can be eyed, just expect a bit

BTC is the champion our portfolio needs. BTC has some work to do. Either it will correct for a nice confrimatio low or strucure out for a bull fag. Either way, the price remains within a downward-sloping channel. That keeps me neutral bullish. But until I see a pivot point structure with signs of divergence in oversold conditions, it's difficult to get a proper RR.
Full TA: Link in the BIO

Markets Rally as Iran’s Strike Falls Short of Expectations🟢 Markets Rally as Iran’s Strike Falls Short of Expectations
One key point here is that global markets were bracing for a much more severe response from Iran toward the U.S. But when the actual attack turned out to be less intense than expected, risk assets — including crypto and stocks — started to climb, while oil prices dropped. Normally, heightened tensions in the Middle East would push oil prices higher, but this time, the opposite happened.
Another important factor is Bitcoin’s exchange outflows. As I’ve mentioned before, BTC leaving exchanges is a bullish sign — it means fewer coins are available to sell, which can fuel quick upward moves when a long trigger appears.
📍Wait for a clean long setup, and avoid emotional trades.
---
💬 Do you think the market is reacting rationally or emotionally right now? Drop your thoughts in the comments!

btc dirrectionnow days btc was bleeding much but to day was was recovering little as you see my last analyst it approaches the exact direction and I hope the coming days will go as I will insh Allah be ready for big bull run after it finish the last liquidity swept

A bearish trend is gradually taking shape.From a technical perspective, the complete breakdown of the box bottom, coupled with the MACD indicator about to fully crossing below the zero axis, both indicate that bullish momentum is weakening and a bearish trend is gradually forming. Short-term bulls need to take a temporary break and wait for the construction of a stabilizing platform. For bears, according to the current trend, they can lay out short positions on rallies. The ideal entry position is near the lower edge of the box, and they can try to lay out positions boldly after setting stop-losses.
On the news front, "Laote"'s policies change frequently, with extremely high uncertainty. The market needs global stability, and there has been no bull market in history built in a turbulent environment. Therefore, we need to treat market conditions cautiously, avoid blind and radical operations, and only by maintaining rationality can we respond to market changes.
you are currently struggling with losses,or are unsure which of the numerous trading strategies to follow,You have the option to join our VIP program. I will assist you and provide you with accurate trading signals, enabling you to navigate the financial markets with greater confidence and potentially achieve optimal trading results.
Trading Strategy:
sell@102300-102800
TP:100000-100500

BTC comleted wykoff with retest of sowJudging by 4h analysis, BTC completed wykoff with retest of sow and is getting completely obliterated now. Get out while you can! X_X

BTCBTC is currently trading within an 8H short FVG. For continued upside, a clean inversion of this zone is required.
Failure to flip this level may trigger a corrective move toward the $93K–$98K range. Monitor price action closely — confirmation is key.

BTC outlook Just as analysed , Bitcoin delivered nicely , and still delivering, now we expect to see a full drop to 74k
