BTCUSDT.P trade ideas

Bitcoin Ready For Fall Check my levels Hello trader's
Here is the chart level of bitcoin for selling...
So if you want to Know about intrday levels
Comment...

BTC-----Buy around 104900, target 106000 areaTechnical analysis of BTC contract on June 19:
Today, the large-cycle daily level closed with a small positive line yesterday, the K-line pattern was a single positive line with continuous negative lines, the price was below the moving average, and the attached indicator was dead cross. The general trend of the decline was still relatively obvious, but in trading, we should pay more attention to the rhythm of the price range in the shock, so the operation should be decisive, not greedy, and do a good job of risk control; the short-cycle hourly chart yesterday's intraday support was corrected upward, the European session fell but did not continue to break down, the price support rebounded in the early morning, the current K-line pattern was a single positive line with continuous positive lines, and the attached indicator was golden cross, so it is highly likely to break through yesterday's high of 105500 area within the day.
Today's BTC short-term contract trading strategy:
Buy at the current price of 104900 area, stop loss at 104000 area, and target 106000 area;

BTC – Bullish bias under review: 102k/103k supports in focus__________________________________________________________________________________
Technical Overview – Summary Points
__________________________________________________________________________________
Momentum : Dominant on all major timeframes (1D, 12H, 6H, 4H). Risk On / Risk Off Indicator signals STRONG BUY except on 15min (neutral).
Support/Resistance : Structurally key pivot zone 102k–106k; major supports 102k/103k. Potential breakout above 106k (swing target 109k).
Volumes : Normal across all timeframes. No excess signals, no accumulation/capitulation peaks.
Multi-TF Behaviors : Horizontal consolidation with bullish dominance. Short-term bearish divergence on 2H–15min, micro-TF in correction only, no panic.
__________________________________________________________________________________
Strategic Summary
__________________________________________________________________________________
Global Bias : Solid bullish structure as long as 102k/103k hold. “Risk On” maintained by sector outperformance.
Opportunities : Entries on pullback/main base 103k–104k; breakouts to watch above 106k.
Risk Zones : Clear invalidation <102k, potential rapid flush to 97k–88k; keep strict stop-loss below 102.5k.
Macro Catalysts : FOMC, Fed projections, Middle East geopolitics keep volatility high, but no shock. Price action leads near-term strategy.
Action Plan : Swing buy on confirmed support, dynamic hedge post-news, monitor volumes/closures on key pivots.
__________________________________________________________________________________
Multi-Timeframe Analysis
__________________________________________________________________________________
1D : Bullish momentum, major supports intact (102k/105k). Risk On / Risk Off Indicator = STRONG BUY, stable volume, no excess. Healthy structure for long swings.
12H : Positive bias, range 102.6k–106k. Risk On / Risk Off Indicator = STRONG BUY.
6H : Presumed accumulation 103k–106k, momentum still strong. No volume weakness.
4H : Range oscillation, structural support test at 103k. Sector outperformance, neutral volume.
2H : First sign of short-term weakness. Divergent with higher TFs but no panic.
1H : Technical rebound towards 104.8k possible as long as 103k support holds.
30min : Short-term trend remains bearish (trend 30min = down). Correction/purge ongoing.
15min : Neutral momentum, supports being tested. No panic or melt-down observed.
Summary : Strong bullish confluence on higher TFs, temporary divergence on micro-TFs. “Range with bullish bias” scenario as long as 102k/103k holds the structure.
__________________________________________________________________________________
Macro and Fundamental Analysis
__________________________________________________________________________________
FED/FOMC (June 18) : Rates unchanged, “data dependent” guidance. Raised volatility but no risk-off shift.
Market Sentiment : BTC technical structure holds, moderate post-FOMC volatility.
S&P500 : Above all key moving averages. Sector momentum (software, uranium, semis) remains dominant.
Energy Level : Weak oil = little macro pressure against BTC.
Geopolitics : Israel–Iran escalation / US posture reinforced. High FX/oil volatility but BTC resilient (>102k), no panic on record.
Economic Calendar : Closely watching BoE & SNB, but low BTC impact odds.
Implications : Post-news phase = ideal for range trading, no rupture event expected within 48h.
__________________________________________________________________________________
Strategic synthesis & R/R guidance
__________________________________________________________________________________
Long on pullback 103–104k, swing targets 106/109k. Optimal R/R (>2.5) if stop 102.5k (D Pivot Low).
Invalidation area : Clean close <102k or heavy downside volume (capitulation via ISPD/volumes).
Risk Management : Dynamic stops, partial hedge post-FOMC during macro volatility.
Conclusion : Bullish structure preserved. Range trading scenario dominant, no extreme signals or panic. Actions: support watch, technical buy on confirmed pullback.
BTC continues to accumulate above 103,500Plan BTC today: 19 June 2025
Related Information:!!!
Bitcoin (BTC) price edges slightly higher, trading near $104,700 at the time of writing on Thursday, after stabilizing above a key level — the 50-day Exponential Moving Average (EMA) at $103,100. A breach below this level could trigger a sharp fall in BTC. Risk aversion could intensify, as reports indicate that US officials are preparing for a strike on Iran in the coming days. Despite this risk-off sentiment in global markets, institutional demand remains strong, with US spot Bitcoin Exchange Traded Funds (ETFs) seeing positive inflows for eight consecutive days
personal opinion:!!!
btc continues to accumulate above 103,500, the market is no longer sensitive to interest rate information yesterday
Important price zone to consider :!!!
support zone : 103.500 \ 101.000
Sustainable trading to beat the market

Volume spikes on down moves add to selling pressure.📉 BTCUSDT – 1H Chart Technical Outlook
🔍 Structure Insight:
Bitcoin is currently trading within a descending channel, forming lower highs and lower lows, indicating persistent bearish pressure. Price action appears compressed between key trendlines, hinting at an imminent breakout.
---
🔻 Scenario 1: Bearish Breakdown (Primary Bias)
If BTC fails to hold above the lower boundary of the range, a decisive break below could trigger a sharp move toward the 103,650–103,000 demand zone. The structure supports continuation to the downside if the price rejects resistance again.
🧊 Bearish Confluence:
Price is unable to break above dynamic resistance.
Momentum remains weak near the mid-range.
Volume spikes on down moves add to selling pressure.
---
🔼 Scenario 2: Bullish Breakout (Alternative View)
A breakout above the descending trendline and confirmation candle could flip bias short-term bullish. This would target the 105,400+ region as the next liquidity area.
⚡ Bullish Signs to Watch:
Break and retest above trendline resistance.
Bullish engulfing or breakout candle with volume.
---
🔍 Key Levels to Monitor
Support: 103,650 / 103,000
Resistance: 105,000 / 105,400
Breakout Zones: Watch for clean breaks and retests outside the wedge pattern.
---
📌 Conclusion:
BTC is coiling within a tightening range. The breakout direction will likely dictate the next short-term trend. Maintain flexibility — breakout confirmation is key before positioning.
🚨 Not financial advice — always DYOR before trading!

Bitcoin buy ideaBitcoin (BTCUSD) had a challenging week of consolidation, but it remains stable above $100,000 despite losing some weekly gains. On the 4-hour chart, demand is holding above $102,000. With the Fed maintaining interest rates at 4.50%, if Bitcoin consolidates above $102,000-$103,000, we could see short-to-mid-term growth towards $106,000-$110,000.

BTC – Stop Hunt at the Edge of ValueThis is what a liquidity raid looks like.
Price just swept the bottom of the range, tapped into the low-volume zone (as seen on the volume profile), and reclaimed — classic sign of a trap sprung.
Key points:
The downtrend line labeled “comp” = compression — bulls forced to capitulate into a thin zone
High probability deviation with stop run and reclaim — this fuels the next move up
The green box shows risk-defined entry off the sweep low
Targeting the prior high: 106,787
Volume imbalance filled = no inefficiency above — price can now move cleanly
Execution mindset:
Trap spring → retrace into structure → expansion
Risk is clear, liquidity is engineered, structure remains
Late shorts just became the fuel.
Watch the reclaim of the box top. If that flips support, we ride momentum.
📈 For more setups like this — including pre-breakout traps — check the description in the profile.

Bitcoin's Latest Market AnalysisThe recent escalation of the situation in the Middle East has triggered a surge in risk - aversion sentiment across global financial markets. As a risk - on asset, Bitcoin has faced certain selling pressure in a market environment dominated by risk - off sentiment.
From a technical chart perspective, Bitcoin has made multiple attempts to break through the key resistance range of $108,800 - $110,000 in the recent period, but has encountered significant selling pressure each time. On the other hand, the area between $105,000 - $103,000 forms an important support zone. When the price drops to this area, it attracts some bargain - hunting capital inflows, which provides a certain degree of support for the price.
The price of Bitcoin is expected to fluctuate within a relatively narrow range. If it can hold the key support level of $105,000 and the bulls can regain strength, the price is likely to rebound to the range of $106,000 - $108,000. However, if the $105,000 support level is effectively breached, it may trigger additional selling pressure, potentially driving the price down further to $103,000. In extreme cases, if market panic sentiment spreads further, it may test the psychological threshold of $100,000.
you are currently struggling with losses,or are unsure which of the numerous trading strategies to follow,You have the option to join our VIP program. I will assist you and provide you with accurate trading signals, enabling you to navigate the financial markets with greater confidence and potentially achieve optimal trading results.

Bitcoin Eyes $110K or $94K – Depends on Global HeadlinesBitcoin (BTC/USDT) – 4H Technical Outlook
📅 Update: June 18, 2025
🧭 Current Market Status:
Bitcoin is currently trading around $105,296, sitting in a tight consolidation above key support ($104K). The price has respected both demand and supply zones over the past few sessions but remains sensitive to macro-driven events, especially geopolitical instability.
We can clearly see BTC is caught between strong support around $100K–102K and resistance around $108K–110K, awaiting a directional break.
📊 Key Technical Levels:
Resistance Zones (Red):
$108K–110K – intraday resistance block
$112K – short-term breakout target
$114K–116K – final bullish extension zone
Support Zones (Green):
$102K–104K – immediate demand
$100K – psychological round number + previous breakout base
$98K / $96K / $94K – downside targets if panic sets in
🔺 Scenario 1: No US-Iran War (Bullish Case)
If no escalation occurs:
BTC could bounce from current support or even dip to $102K before pushing higher.
A clean break above $108K may trigger a move toward $112K and then $114K–116K.
Stochastic shows bullish divergence forming (see trendline), supporting a possible upside breakout if momentum strengthens.
🟢 Look for breakout candle + volume confirmation above $108K.
🔻 Scenario 2: US-Iran War Escalates (Bearish Case)
If military conflict breaks out:
Safe-haven rotation may favor cash or gold short-term; BTC could lose traction.
Breakdown below $102K may lead to panic drop toward $98K, followed by potential flush into $94K.
Watch for failure to hold $100K — this would mark a major shift in sentiment.
🔻 BTC has historically struggled during initial shock of war-related uncertainty.
🔁 Neutral/Bounce Scenario:
If price holds $104K–102K range but no major trigger emerges, expect sideways consolidation.
Traders can scalp range levels until a confirmed breakout or breakdown.
🛡️ Risk Management Notes:
BTC remains headline-driven — adjust position size based on volatility spikes.
If trading directionally, place tight SLs below key support or above resistance, depending on side.
Consider hedging with stablecoins or options if holding long-term spot.
📢 If you found this analysis valuable, kindly consider boosting and following for more updates.
⚠️ Disclaimer: This content is intended for educational purposes only and does not constitute financial advice.

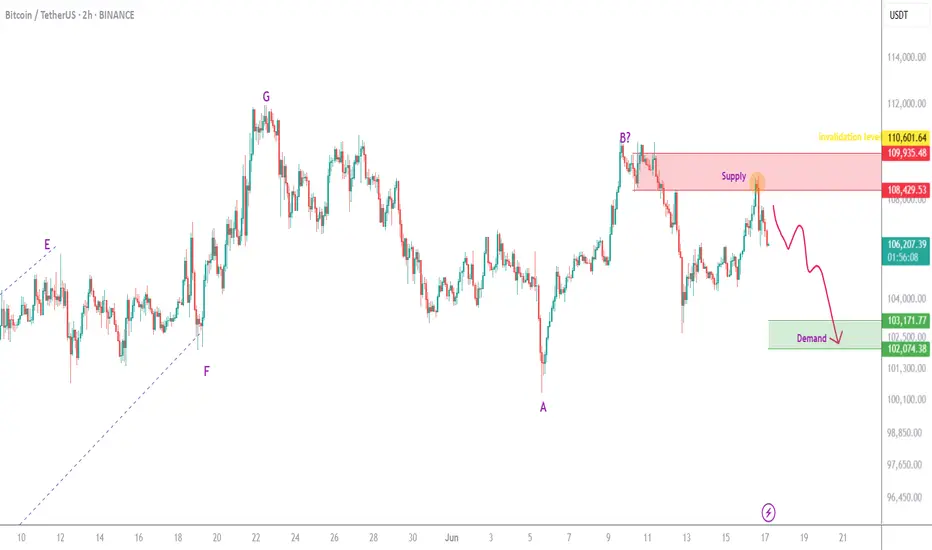
BTC is still bearishThe red zone seems to have had enough orders to reject the price downward. It is expected that the price will drop at least to the green zone below.
There will be some fluctuations along the way.
A daily candle closing above the invalidation level would invalidate this analysis.
Everybody is trying to sell due too todays news No one want too risk trading today whiles news are inbound for today

My thoughts on Bitcoin long-term, as well as mid- to short-termLONG-TERM / THE BIG PICTURE:
Regarding the big picture, we couldn’t be more bullish. We’re currently fighting our way through the cycle as usual—despite the fact that this cycle has had way too many chop phases, flushing out far too many participants.
Just a few weeks ago, we got our bullish crossover on the weekly MACD—a signal that has triggered a major BTC rally every single time this cycle.
At no point in this cycle has #BTC been overheated. The blow-off top is still coming.
LOCAL PRICE ACTION:
CRYPTOCAP:BTC remains in this vertical ascending channel and remains macro bullish what imo is another huge re-accumulation range lasting more than 200 days since November, that will lead to an impulsive breakout TO THE UPSIDE in the weeks to come
MACRO LANDSCAPE:
Due the last crash we potentially got an bulllish structure, wich if the price breaks the high at $110.000 is confiraed and can bring us to 120k on #Bitcoin
On the lower TF we currently see an oversold RSI + a bounce from the 0.667 level
RECOMMENDATION:
Watch the high at 110k and the low at 100k, we have to break either one of these 2 levels.
Have an eye on the current conflict with israel & iran and dont forget the FOMC meeting tmwr, where we can expect some important news due the current situation
Either way, I'm long and mid-term bullish despite the current accumulation by long-term holders (which just peaked)...
Always watch the big picture from above - maintain perspective and don't focus too much on smaller timeframes...
But most importantly: Survive.
Thanks for reading, let me know your thoughts about the current market situation & price action👇

Bitcoin sell short go 83kBitcoin is ready for a heavy drop, just sell.
Do not take any buy or sell trades.

BTCUSDT – Price Poised to Break Descending ChannelBTCUSDT has been maintaining a series of higher lows since early May, consistently rebounding from its dynamic support trendline. Currently, the price is consolidating just below the descending channel resistance around the 108,000 USDT level. A clear double-bottom pattern accompanied by solid recovery momentum suggests a potential breakout from the prolonged correction phase that has persisted throughout June.
If BTC breaks above the descending trendline, the next target could be the major resistance zone near 113,000 USDT.
On the news front, the market is reacting positively to BlackRock’s announcement of expanding investment in crypto ETF products. At the same time, recent soft U.S. inflation data has strengthened expectations that the Fed may halt its tightening cycle. This combination is improving investor sentiment and driving renewed interest in risk assets like Bitcoin.

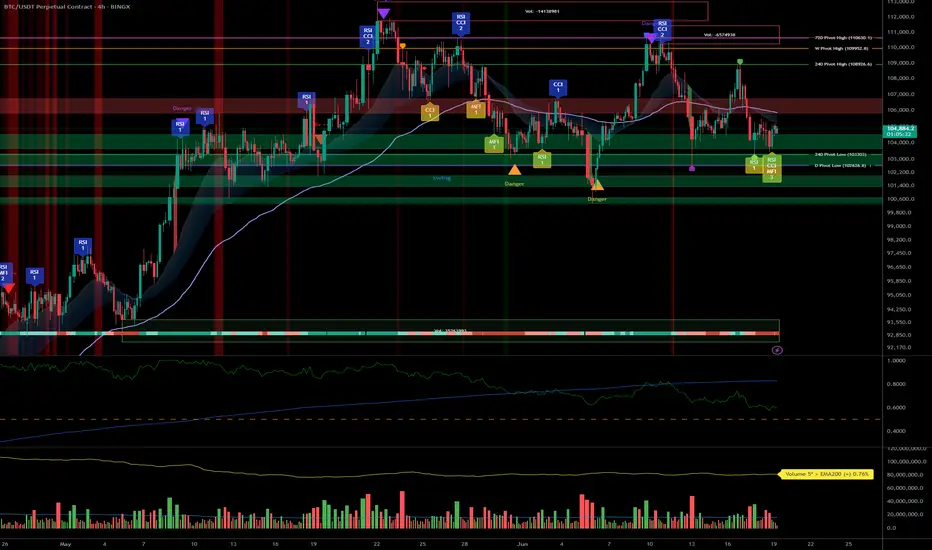
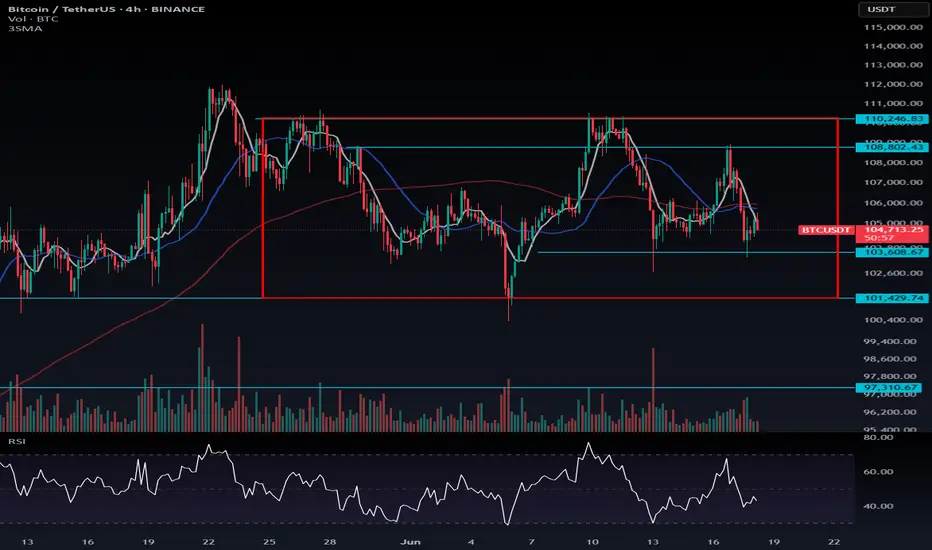
BTC at Risk Amid Technical Weakness and Geopolitical TensionsBitcoin has failed to break above the previous high of $110,264, and instead formed a lower high at $108,802, signaling potential weakness in the current structure. From a technical standpoint, this breakdown increases the likelihood of a bearish move — especially with today’s FOMC interest rate decision on the horizon and escalating geopolitical tensions, including the risk of U.S. involvement in the Middle East conflict.
We're also seeing increased volatility and market sensitivity to news, which can make short-term trading riskier than usual. Bitcoin remains inside the red consolidation box — and as previously mentioned, any breakout from this range is likely to be sharp and aggressive (whale-driven). That’s why positioning ahead of the breakout is crucial.
If BTC breaks below $103,608.67 and at the same time Bitcoin Dominance rises above 64.90%, it could be a strong signal that capital is exiting altcoins. In that case, short opportunities in altcoins may offer better setups, as they could drop more significantly than BTC.
🛑 Due to the high volatility and macro uncertainty, keep your risk low, use tight stop-losses, and don’t forget to secure profits quickly.
💬 What’s your take on BTC’s next move? Drop a comment below — let’s discuss! 👇
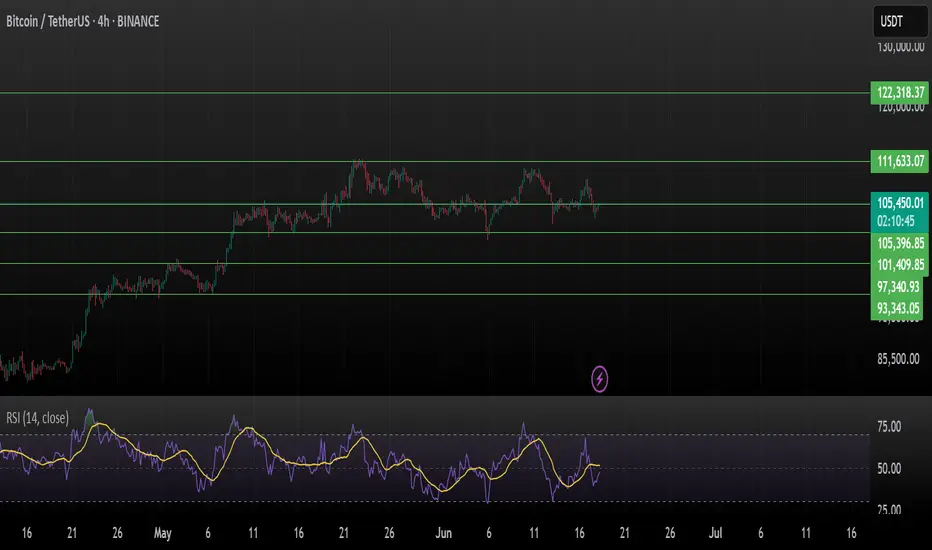
Bitcoin (BTCUSDT) 4H AnalysisBitcoin is currently consolidating around $105,523 after a strong rally and forming a short-term sideways structure. It is still unable to break the immediate resistance of $ 111 K.
Key Technical Observations:
BTC has been ranging between $101,409 and $105,523
RSI at ~51.38 indicates a neutral zone, signaling indecision in momentum
Support holding at $105,396, but price action is flat
Bulls need to reclaim $111,633 to regain momentum
Major Levels to Watch:
Resistance: $111,633 → $122,318
Support: $105,396 → $101,409 → $97,340 → $93,343
A break above $111,633 could trigger bullish continuation, while a fall below $101,409 might open the path to deeper support zones.
Patience is key — wait for breakout confirmation before making moves.
This is not financial advice. Always DYOR and manage risk.
Like, share & comment if you find this analysis helpful!
#Bitcoin #BTC #BTCUSDT
BTC- Can it reach 97Kish?As thing suggests the move can only be done when heavy fall is there, but as suggests lets small scalp things to our best!

BTC/USDT Long Trade Setup – 1H Chart AnalysisBTC/USDT Long Trade Setup – 1H Chart Analysis
BINANCE:BTCUSDT
Hello traders! Sharing a recent long entry I took on Bitcoin (BTC/USDT) based on price action and liquidity concepts. This trade is taken on the 1-hour timeframe and aligns with my strategy of combining liquidity sweeps, support zones, and market structure shifts.
---
🔍 Trade Overview:
Entry Price: 104,704 USDT
Stop Loss: 103,660 USDT
Take Profit (Target): 108,349 USDT
Risk-to-Reward Ratio (RRR): Approximately 1:3
---
🧠 Trade Idea Behind the Entry:
As you can see on the chart, BTC had been in a downtrend and recently made a strong move into a key liquidity zone. This zone had previously seen multiple touches and rejections, making it an area of interest for both buyers and sellers.
The price swept liquidity below the previous low (labelled as “Liquidity Sweep $$$”), grabbing stop losses of early buyers and triggering limit orders of smart money. This move into the liquidity zone was followed by a strong bullish reaction – a signal that buyers may be stepping in.
Additionally, the "Break of Structure" (BOS) confirms a potential shift in market direction. The reaction from the liquidity zone indicates that this level is holding as new support.
---
🛠️ Why I Took the Trade:
1. Liquidity Sweep: The wick that pierced the liquidity zone signals stop-hunting and accumulation. These moves often precede a strong reversal.
2. Demand Zone Reaction: After the sweep, the candle closed bullish inside the demand box. This shows buyer strength.
3. Risk Management: The stop loss is set just below the liquidity zone to protect from deeper sweeps while keeping the RR healthy.
4. High Probability Target: The target is placed near the next resistance level around 108,349, which also aligns with a clean imbalance that price may want to fill.
---
📊 Technical Confidence:
Confluence Factors:
✅ Liquidity sweep
✅ Demand zone reaction
✅ Market structure shift
✅ High RR
✅ No immediate resistance till target
This type of setup reflects smart money behavior – first pushing price below structure to grab liquidity and then reversing sharply. The bullish momentum after the sweep gave extra confirmation.
---
🧭 What I’m Watching Now:
I will continue monitoring how price reacts around the 105,500–106,000 range. If momentum continues with higher highs and higher lows, I may trail my stop loss to lock in profits.
---
Let me know what you think of this setup! Have you taken a similar trade or are you waiting for confirmation? Drop your thoughts or charts below 👇
Stay disciplined, manage your risk, and trust the process. 🚀
#Bitcoin #BTCUSD #PriceAction #LiquiditySweep #SmartMoney #CryptoTrading #TradingSetup #TechnicalAnalysis #TradeJournal

Test the crucial round-number threshold of $100,000.Affected by sudden news factors, the Bitcoin market has seen sharp fluctuations. The price started a significant downward trend from the $108,900 level and has dropped to around $104,000 as of now. This decline has caused Bitcoin to break through multiple key support levels.
On the daily timeframe, the originally important support range of $106,000 - $107,000 was easily breached, with market bearish forces gaining absolute dominance. Bitcoin is facing significant downward risks and is highly likely to continue falling to test the crucial psychological level of $100,000.
you are currently struggling with losses,or are unsure which of the numerous trading strategies to follow,You have the option to join our VIP program. I will assist you and provide you with accurate trading signals, enabling you to navigate the financial markets with greater confidence and potentially achieve optimal trading results.
Trading Strategy:
sell@104000-104500
TP:102000-1025000

BTCUSDT ShortSet-up: Fade breakouts inside 2‑day 1 % VWAP band
Entry: $107 k‑$107.5 k
Stop: 0.5% -> 108k
Target: Re‑enter VWAP mean $105.5 k
R:R: 3:1

BTC POC, Golden Pocket, S1, FVG confluence @ 105kBTC POC, Golden Pocket, S1, FVG confluence @105k
Nice confluence here for a bounce. I would take profit quickly though with bearish momentum still strong.

BTC - AnalysisWe’re currently back at the short-term trend reversal zone,
which has been reactivated after price moved 3% away from it.
The zone itself spans 1.6%, so a new reaction from this level is likely.
If the bottom at $102,500 holds,
we’ve activated a valid bullish structure that could take us up to the $119,000 target zone —
which also overlaps with a weekly target region.
We’ll see what the next few days bring...
Key events to watch right now:
1️⃣ Israel & Iran – Will the conflict escalate or calm down?
2️⃣ Tomorrow’s FOMC meeting – Will QT be addressed?
Feel free to drop any questions or feedback —
I’ll read and respond to everything.
LFG 🚀
