BTCUSDT – Multi-Timeframe Analysis | Demand Zone Sweep SetupAnalyzing BTCUSDT using 15m, 1h, 4h, and 1D timeframes.
Current structure shows a potential demand zone sweep followed by a reclaim setup.
Key confluences include:
RSI divergence forming on the 15m and 1h
Possible CHoCH on the 15m chart confirming bullish intent
Daily structure still intact as long as 106k holds
TP1, TP2, and SL levels are marked on the chart.
Monitoring closely for bullish confirmation before entry.
Trade what you see, not what you feel.
BTCUSDT.P trade ideas

BTC - New month, new monthly Power Of ThreeNew monthly Power Of Three:
4 weekly candles to form a monthly candle.
So there will be 4 weekly PO3 within 1 monthly PO3.
Accumulation => Manipulation => Expansion
I anticipate the first week there should be a accumulation phase.
Determine the previous dealing range to find out the premium and discount range.
Short term trades back into the discount range and long term continues higher.

BTC — ATH or Lower High? Patience for the Next SwingBINANCE:BTCUSDT | 4h
Patience here — waiting for the next high-probability swing.
Major levels to watch: $111,990 (range high), $108,950 (weekly), $100,300–103,000 (demand).
Next move: ATH attempt or another lower high? Will act when the reaction sets up.

Bitcoin Short-Term Outlook – Coming Week📈 Bitcoin Short-Term Outlook – Coming Week
Currently, Bitcoin is expected to gather liquidity around the $106,000 zone, potentially initiating a move toward the $110,000 resistance level.
This area will be crucial in determining the next directional move.
🔍 The market's reaction around $110,000 will be closely monitored, and the analysis will be updated once that level is reached.
📌 Note: This outlook is based on current market conditions and may require adjustments if sentiment or price structure changes.

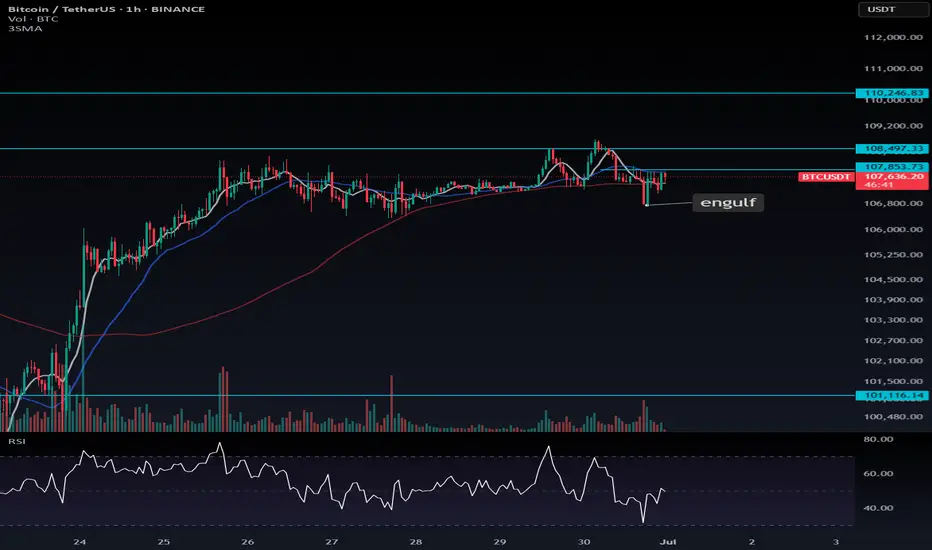
BTC Bullish Engulfing – Multiple Long Opportunities🚀 BTC Bullish Engulfing – Multiple Long Opportunities
Following the bullish engulfing candle, there are two potential long entries for Bitcoin:
🎯 Aggressive Entry: at $107,853.7 (higher risk)
✅ Conservative Entry: at $108,497.3
🔐 Stop-loss advice:
Place your stop either:
At a level that won’t be easily hit by short-term noise, or
At a level that confirms a short-term trend reversal if breached.
📈 If neither trigger plays out, set a stop-buy order at $110,246. A strong breakout is likely above this level, so don't miss it if momentum kicks in.
🧠 The choice is yours:
Enter early and accept the risk of getting stopped out
Or wait for confirmation and risk missing the trade
📌 If you’re already in a BTC long based on earlier signals, consider opening a position in high market cap altcoins to diversify exposure.
---
💬 Which entry level are you going for — early risk or breakout confirmation? Let me know in the comments! Always curious to see your strategies.
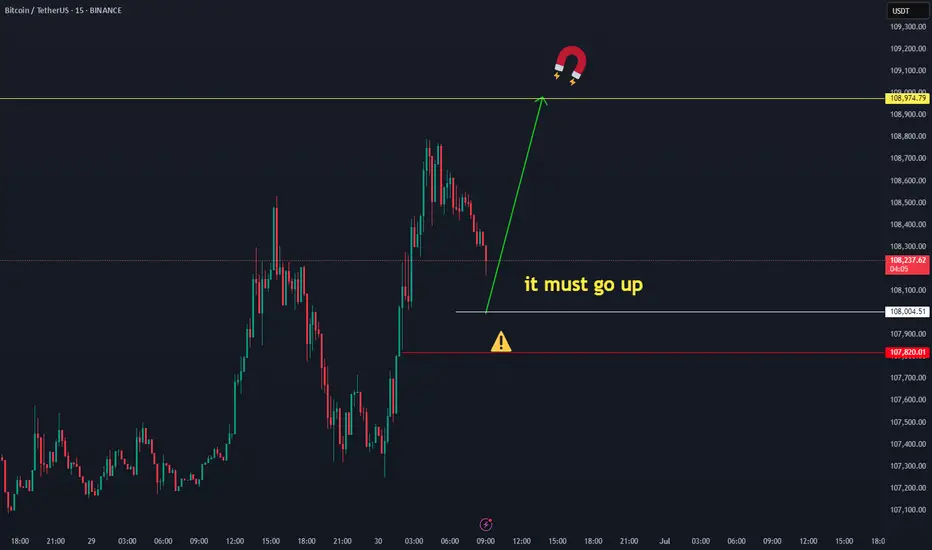
BTC needs to hold up here. BTC is at a very important level. A role over is expected, but without market structure confirmation, it's important to consider the possibility of a move up. The bearish thesis on lower timeframes is the easy one. Ensure your bullish thesis is also considered. A confirmed lower low or a lower high would confirm a CHOCH reversal.
Full TA: Link in the BIO

BTC TIME TO HEAD SOUTH BTC has given a CHOCH
Proper risk management
Sit tight as we ride to 102634.59 region.

BTCUSDT| Bounce from Channel SupportBTC just bounced cleanly off mid-channel support (~106.8K) within the descending structure.
Held above EMAs and reclaimed key short-term support.
If price holds above 107.2K → likely retest of 108.4K channel resistance.
Break and close above 108.5K = trendline breakout → 110K+ possible.
Break below 106.8K = failed bounce → 105.5K next demand.
Bias: Bullish while holding above 107.2K.

30-Minute Chart – Rising Wedge BreakdownBreakdown from 30m rising wedge confirmed with volume. Retest at 107.5K failed. Price now under EMAs.
4H also broke rising channel → rejection from 108.4K.
Key support: 106.4K.
Break below = 105.2K target.
Reclaim 107.5K = upside risk to 108.8K+.
Bias: Bearish below 107.5K.
Volume confirms move.

BTC Breakout Imminent – Targeting $110,349🕒 Timeframe: 30-Minute Chart
📈 Current Price: $108,425
🎯 Projected Target: $110,349
---
🔍 Chart Zones & Key Levels:
🔷 Blue Resistance Zone (~108,500 - 110,500)
Price is currently approaching the top of this range.
Historically, price rejected strongly from this area (left blue circle).
This zone has acted as major supply, but now price is retesting with bullish momentum.
🟢 Green Circles – Key Reaction Points
The first green circle marks a strong bounce from previous support (~106,000).
Second green circle shows resistance rejection, indicating it's a key pivot level.
🔶 Orange Zone (~104,000 - 106,500)
This acted as a demand zone during the correction (middle of the chart).
Price formed a double bottom within this zone, signaling bullish reversal (orange circle).
---
📊 Structure & Pattern:
Consolidation breakout from a horizontal range.
Forming higher highs and higher lows, showing bullish structure.
The blue arrow path shows expected price movement:
Minor pullback
Followed by breakout towards $110,349 target
---
🧠 Market Sentiment:
Strong accumulation near $106,000 suggests buyers are in control.
Price is gradually grinding higher into resistance with volume increasing (implied).
---
🧭 Conclusion:
Bias: Bullish
Entry Zone: Dips near $107,800–$108,000
Target: $110,349
Invalidation: Break below $106,500

Bitcoin/TiqGPT Setup1D Timeframe: The daily chart shows a bullish momentum with recent green candles indicating a strong upward push. The price is currently near the high of the recent range, suggesting potential resistance or profit-taking levels.
4H Timeframe: The 4-hour chart reveals a more detailed view of the bullish momentum. There are signs of a pullback with the latest candle forming a small body, which could indicate a temporary exhaustion in buying pressure.
1H Timeframe: On the hourly chart, the price action shows a sharp decline followed by a recovery, indicating a volatility spike. This could be a reaction to a liquidity grab below prior lows, which is a common institutional maneuver to eliminate stop-loss orders before a directional move.
15M Timeframe: The 15-minute chart displays a recovery phase with the price moving upward steadily, suggesting that the earlier drop was likely a liquidity sweep.
5M Timeframe: This timeframe shows continued upward movement with consistent green candles, supporting the recovery narrative seen in the 15M chart.
1M Timeframe: The 1-minute chart shows a very granular view of the bullish momentum. The consistent upward ticks suggest strong buying interest at these levels, possibly from retail following the institutional cue.
INSTITUTIONAL THESIS:
Institutions appear to be in a phase of accumulation after a liquidity sweep, as evidenced by the sharp drop and subsequent recovery. The goal seems to be to push the price higher after successfully capturing liquidity below recent lows.
LEARNING POINT:
"1H Liquidity Sweep followed by a 15M and 5M bullish recovery indicating institutional buying pressure."
SIGNAL: BUY
SYMBOL: BTC/USDT ENTRY PRICE: $107,800 STOP LOSS: $107,400 TARGET PRICE: $108,600 CONDITION: Buy limit order post-1M confirmation of continued bullish momentum. RATIONALE: The setup aligns with a liquidity sweep followed by a bullish recovery across multiple timeframes, indicating strong buying interest. The entry is set above the current 1M high to ensure momentum continuation, with a stop placed just below the recent 1H low to minimize exposure to another potential liquidity sweep. STRATEGIES USED: Liquidity Sweep Recovery, Multi-Timeframe Bullish Alignment URGENCY: HIGH TIMEFRAME: Short-term CONFIDENCE SCORE: 85% RISK/REWARD RATIO: Calculated as follows:
Risk: $107,800 (Entry) - $107,400 (Stop) = $400
Reward: $108,600 (Target) - $107,800 (Entry) = $800
Ratio: 800 / 400 = 2:1

Btcusd sell setup H4Hello! Friends,
Greetings. Please leave a Like if you like the idea.
Before start talking about technical Let's share your LOVE by giving me LIKES to support this work. Thanks in advance.


BTCUSDT in a sell zone Let's keep it simple.
The IOF is bearish on the H4 timeframe.
Price has retraced to a premium zone.
Technically, once we see a lower timeframe confirmation from these zones, we take a sell.
While I'm eyeing the liquidity at 109050, any break below 106415 will usher us into a sell towards 99000.
Use your proper entry confirmation and risk management.

BTCUSDT Analysis – Bullish Focus Amid ConsolidationBTCUSDT Analysis – Bullish Focus Amid Consolidation
Bitcoin is currently mirroring the broader market sentiment, particularly tracking the S&P 500. After a false breakout above the psychological 100K level, BTC entered a distribution phase, followed by a consolidation range. This indicates a potential accumulation before a bullish continuation, although resistance levels remain key hurdles.
False Breakout at 100K: A failed breakout attempt triggered a sharp reversal, signalling short-term weakness. Price rolled back and found temporary support around 106,200, pausing further downside The pair is consolidating within a tight range, indicating a possible setup for a renewed bullish push.
Outlook: Despite the resistance cascade, BTC remains in a bullish structural zone as long as it holds above 106,000. A clean breakout above 108,500–110,000 could open the path back toward 114,000–117,000. However, failure to break may result in a deeper pullback towards 104,000–102,500.
Ps Support with like and comments for more analysis Thanks for supporting.

BTC/USD Technical Analysis – Weekly Elliott Wave StructureIn this video, we analyze the weekly chart of Bitcoin ( BYBIT:BTCUSDT ) using Elliott Wave theory.
The current structure suggests the beginning of a new bullish impulse (waves 0, 1, and 2) following a clearly completed and technically correct corrective phase.
We explore potential impulsive scenarios starting from wave 2, using Fibonacci extensions to project possible targets and identifying key support zones and invalidation levels.
This analysis aims to provide a macro perspective based on price action, helpful for traders and investors following BTC from a medium- to long-term technical view.
🛑 Disclaimer: This content is for educational and informational purposes only. It does not constitute investment advice. Each user is responsible for their own trading decisions.

BTCUSDT 30min Breakout Retest | Micro Wedge into Macro ConfluencBTC 30m chart shows ascending wedge, followed by a bullish retest of prior resistance (now support ~107.4K). Price now consolidating just under diagonal resistance near 108.8K. EMAs are aligned bullish, volume surged during the breakout, and remains elevated—suggesting further upside potential.
🔄 Higher Timeframe Confluence
4H: Price pressing upper boundary of a rising wedge within a larger symmetrical pattern. Trendline pressure is real—either breakout above $109K or fade to $106.5K–$105K retest.
1D: Third touch on descending trendline from previous swing highs. Momentum building, and candles holding above EMAs. Breakout above $109.2K can trigger a move to $112K–114K (red expansion zone).
1W: Still inside a macro bull flag. Support from the 20 EMA is firm. Weekly close above ~$110K = confirmed flag breakout with target above $120K.
⚠️ Key Levels
Immediate Resistance: 108.8K → 109.2K → 110K
Support Zones: 107.4K → 106K → 104.5K
Bullish Targets: 110.8K → 113.5K → 114.8K
Invalidation (Short Bias Trigger): Break below 106K on volume
📌 Idea Summary
Micro breakout (30m) leading a potential macro breakout (4H/1D/W). Bulls control short-term trend. Eyes on volume follow-through above $109K. Rejection = potential revisit of 106K. Consolidation under resistance = breakout watch.

BTCUSDT 30min Breakout Retest | Micro Wedge into Macro ConfluencBTC 30m chart shows clean ascending wedge, followed by a bullish retest of prior resistance (now support ~107.4K). Price now consolidating just under diagonal resistance near 108.8K. EMAs are aligned bullish, volume surged during the breakout, and remains elevated—suggesting further upside potential.
🔄 Higher Timeframe Confluence
4H: Price pressing upper boundary of a rising wedge within a larger symmetrical pattern. Trendline pressure is real—either breakout above $109K or fade to $106.5K–$105K retest.
1D: Third touch on descending trendline from previous swing highs. Momentum building, and candles holding above EMAs. Breakout above $109.2K can trigger a move to $112K–114K (red expansion zone).
1W: Still inside a macro bull flag. Support from the 20 EMA is firm. Weekly close above ~$110K = confirmed flag breakout with target above $120K.
⚠️ Key Levels
Immediate Resistance: 108.8K → 109.2K → 110K
Support Zones: 107.4K → 106K → 104.5K
Bullish Targets: 110.8K → 113.5K → 114.8K
Invalidation (Short Bias Trigger): Break below 106K on volume
📌 Idea Summary
Micro breakout (30m) leading a potential macro breakout (4H/1D/W). Bulls control short-term trend. Eyes on volume follow-through above $109K. Rejection = potential revisit of 106K. Consolidation under resistance = breakout watch.

BITCOIN WATCH the break and close of 108k level,this will open a buy into 114-113k supply roof and it will be a quick take profit at that level.
if we close below 108k from the channel on 4hr then we are looking at sell into 94-95k 4hr demand floor .
#btc #bitcoin

BTC/USDT high win scalping signals in 15 minutes are as follows- Signal: SHORT
- Admission: 107,480 ~ 107,620
- Take Profit: 107,100, 106,860


Trading the Impulse Rally Retracement — Price and Time Symmetry The Stop Loss Triangle is back!
This time with BITSTAMP:BTCUSD coming off its recent impulse rally. For those of you that aren’t familiar with my strategy — let me start from the beginning…
This concept involves positioning against the opposing decline in price and time as a precursor to our theoretical projection. If the underlying enters our predetermined faded cross-section, the stop loss is triggered to prevent sideways consolidation and the erosion of contract premiums or leverage decay.
This inherently ‘sclene’ triangle is constructed by drawing a straight trend line through the bottoming reversal candle and the furthest projection in price and time symmetry (78.6%) of the retracement. Once connected, draw a vertically positioned straight line from the highest or lowest point in the previously identified retracement to the bottom reversal candle area once again. To create a ‘right triangle’, now turn 90 degrees towards the final point, which is determined by the nearest projection in price and time symmetry (38.2%). This allows time after the imposed price and time date, yet not enough for premium or leverage decay to become significant.
In its entirety, this forms the stop loss triangle.
I encourage my followers to identify and explore the system on their own. As always, feel free to ask me anything related to it. We’ll follow along and you’ll be amazed at the precision of Fibonacci symmetry.
CHEERS
