Technical Chart Analysis – BTC/USDT (4H Timeframe)📊 Current Price: ~105,108 USDT
---
🔵 Support Zone (Highlighted in Purple)
Zone Range: ~102,500 – 103,800 USDT
💡 Historical Significance:
This zone has acted as a strong support multiple times (📍June 13 & June 4), marking clear demand and buyer interest.
🛡️ Buyers stepped in strongly, causing sharp price reversals from this level.
---
🔴 Resistance Zone (Highlighted in Blue)
Zone Range: ~109,500 – 111,000 USDT
🔼 Marked with multiple failed breakout attempts (📍May 21 and projected again around June 18-20).
⛔️ Sellers dominate this zone, causing price rejection each time it was tested.
---
🔁 Rounded Bottom Formation (Cup Pattern?) ☕️
⚙️ A smooth rounded recovery pattern is forming, indicating accumulation and potential bullish continuation.
📈 If price sustains and retests the resistance again with momentum, we may see a breakout attempt.
---
🧭 Key Takeaways
Indicator Insight
🟣 Support Well-defined, historically respected zone. Good risk/reward for long entries.
🔵 Resistance Strong sell pressure zone. Needs breakout for bullish confirmation.
☕ Pattern Rounded bottom = bullish setup if volume supports the breakout.
📆 Watch Zone June 17–20 – potential resistance retest.
🔔 Risk Area Failure to hold mid-range (~105K) could lead to a retest of support.
---
🚀 Bullish Scenario
✅ Break and close above 111,000 USDT with volume.
📍 Target: 113,500–115,000 USDT 📈
🐻 Bearish Scenario
❌ Rejection at resistance again.
📍 Retest of support zone ~103,000 USDT or below.
BTCUSDT.P trade ideas

BTC Buy Setup | Sniper Trading System - Reverse Play🚨 BTC Buy Setup | Sniper Trading System™️ Reverse Play Activated
What you’re looking at isn’t luck — it’s Sniper-level execution.
This BTC reversal trade was triggered by my Sniper Trading System™️, which identifies institutional-level liquidity traps, dealer ranges, and timing zones with precision.
🧠 Setup Highlights:
— Liquidity sweep below key support
— RSI confirming reversal from the Fade Zone
— Dealer Range low respected
— Reversal candle + structure shift = high-probability sniper entry
📍 Chart:
This is powered by my Jesus Saves™️ + Fade Reversal Combo, built into the Sniper Trading System Suite™️.

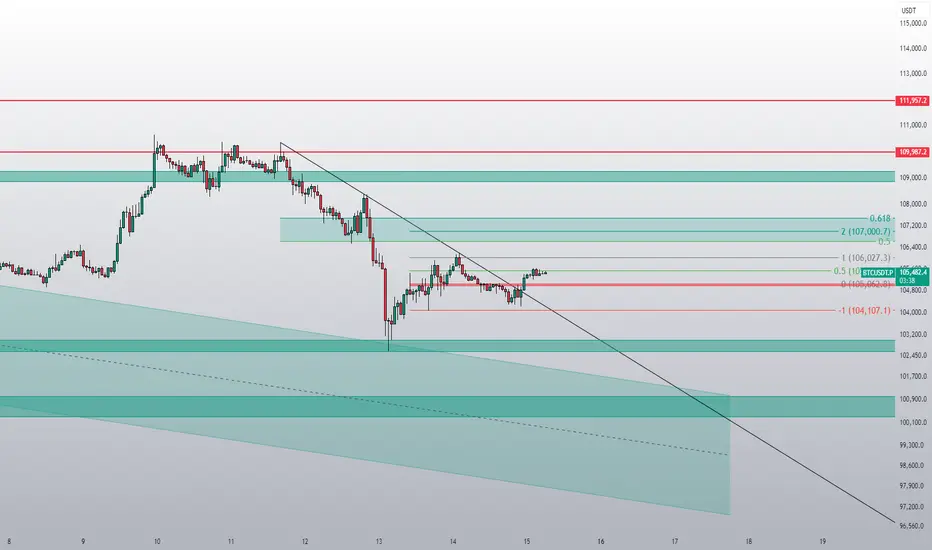
BTC - Short-Term market updateWe’re currently moving sideways between the ATH and $100K.
We’ve tapped into the short-term trend reversal zone and are now consolidating around it.
The next move will come — whether it breaks up or down.
What matters most now is the $100K Higher low.
As long as we stay above it, the structure remains bullish.
If we break below, momentum will shift accordingly.
I’m not taking any positions right now — just observing,
while the geopolitical noise plays out.
The most important thing in phases like this are to
stay calm, focused, and filter out the noise.

BTCUSDT Trend Analysis and Trading RecommendationsToday's overall BTC market rebounded after hitting a low of 102,614 in the early trading session, with Bitcoin's price maintaining a slow upward trend throughout the day. The intraday high reached 105,912 but encountered resistance. As the weekend approaches, historical market data shows limited volatility during weekends, so range-bound fluctuations are expected for the weekend.
From the current overall market rhythm, the price has rebounded slightly today after the previous decline. The hourly chart shows consecutive upward candles, though the price movement remains relatively slow. As time progresses, the price is expected to sustain an upward trend after pullbacks, and breaking through the short-term resistance level is only a matter of time. In terms of short-term structure and pattern, despite slight resistance and minor pullbacks, the downward momentum has weakened. We can still focus on long positions at lower levels, paying attention to the 106,000 resistance level.
BTCUSD
buy@104000-104500
tp:106000-107000
Investment itself is not the source of risk; it is only when investment behavior escapes rational control that risks lie in wait. In the trading process, always bear in mind that restraining impulsiveness is the primary criterion for success. I share trading signals daily, and all signals have been accurate without error for a full month. Regardless of your past profits or losses, with my assistance, you have the hope to achieve a breakthrough in your investment.

Bitcoin is holding the 200 EMA on H4 despite everything...Despite war news and heavy sell volume, BTC held the 200 EMA on H4.
Low-volume weekend = low liquidity, yet bears still couldn’t break it.
🧠 Classic Effort vs. Result: big effort, weak result = hidden strength.
🎯 If it holds: $106.5K → $108.2K → $110K in play.
Structure intact. Bulls stealthily in control.

Is BTC already reversing?Bitcoin broke out above its downtrend line. A retest may happen, but the trend is broken.

$BTC has seen neither wars nor crises nor antics.CRYPTOCAP:BTC has seen neither wars nor crises nor antics. But it is still here and still rising. What do you see in this chart? I do not recommend investing in the rise. I may be wrong about buying with what I wrote, but I am bullish flag technology in this chart. 100k 99k needles can be thrown but it will go up after closing the day under it.

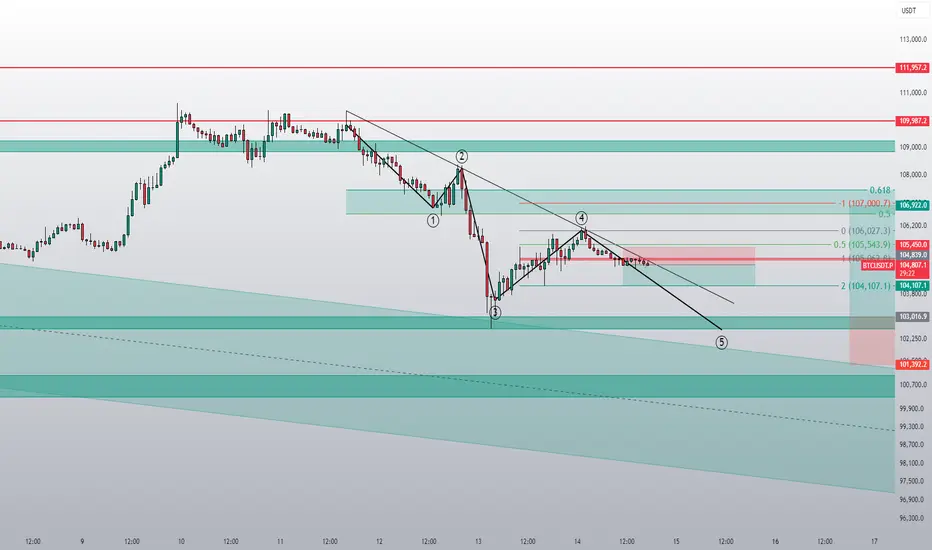
Wave (4) Correction Completed? Wave (5) ImminentBitcoin appears to be completing an Elliott Wave structure, currently sitting around the (4) pullback area with signs of a potential continuation into wave (5) to new local highs. The recent LH and bounce from demand could mark the beginning of the impulsive move.
Key Observations:
✅ Elliott Waves Count (1–2–3–4–5) in Play
Wave (3) completed near ~$113K
Wave (4) correction retraced into the ~$98K support zone
Structure looks corrective (ABC style), typical for wave 4
Wave (5) projection aims towards ~$120K+ based on symmetry
✅ Market Structure
Higher High (HH) → Higher Low (HL) pattern intact
Price respected a key demand zone and bounced
Green dotted line shows potential consolidation → breakout behavior
✅ Support Zones
~$98K = key demand + previous HL
~$92K = macro structure support
Holding these levels = bullish continuation scenario likely
✅ Resistance Ahead
~$113K = recent local high
Break and close above this = wave (5) confirmed
Final TP area ~$120K–124K based on Fibonacci extensions and wave symmetry
🎯 Trade Plan (Idea)
Entry: On confirmation above $106K
Targets:
TP1: $113K (retest)
TP2: $120K
TP3: $124K

One more drop?I assume the correction is not quite over yet. One more drop for BTC would make perfect sense.
BTC-----Sell around 100500, target 103500 areaTechnical analysis of BTC contract on June 14:
Today, the large-cycle daily level closed with a small negative line yesterday, the K-line pattern continued to fall, the price was below the moving average, and the attached indicator was dead cross. The decline in the big trend was still very obvious. We should pay attention to the breakout and pressure signal of the high point of yesterday's correction and pullback in the 106200 area; the short-cycle hourly chart yesterday's price rebounded and corrected after hitting the low point, and retreated under pressure in the Asian morning today. The current K-line pattern continued to fall, and the attached indicator was dead cross. Then the trend is likely to fluctuate downward during the day, but the strength is not expected to be great over the weekend, so it is still short-term.
BTC short-term trading contract strategy:
Directly short in the 100500 area, stop loss in the 105500 area; target is 103500 area;


btcCertainly! Here's a 3-paragraph explanation about the current state of the crypto world in English:
---
The cryptocurrency world in 2025 continues to evolve rapidly, with increasing adoption across financial, technological, and governmental sectors. Major cryptocurrencies like Bitcoin and Ethereum remain dominant players, but newer blockchains such as Solana, Avalanche, and Layer 2 networks like Arbitrum are gaining ground due to their scalability and lower transaction costs. Institutional interest has also grown, with several banks and investment firms offering crypto-related products, including ETFs and custody services.
Regulation has become a central theme in the crypto space. Governments around the world are creating clearer frameworks to manage digital assets, aiming to protect investors while still fostering innovation. The United States, European Union, and parts of Asia have introduced stricter guidelines around Know Your Customer (KYC), anti-money laundering (AML), and crypto taxation. While this has added compliance burdens for projects and users, it has also brought more legitimacy to the market.
Meanwhile, decentralized finance (DeFi), non-fungible tokens (NFTs), and blockchain gaming remain strong sectors, though they have matured compared to the initial hype. AI integration, tokenized real-world assets (RWAs), and cross-chain interoperability are current trends shaping the next phase of crypto innovation. Despite some market volatility, the overall sentiment in 2025 is one of cautious optimism, with developers and investors focusing on utility, security, and long-term sustainability.
---
Let me know if you'd like a version with simpler vocabulary or expanded to more paragraphs.

Bitcoin Sentiment Slips Below Neutral As Price Hovers Near $105KBitcoin sentiment drops to 46.1% as market shows hesitation despite price rebound.
Trading volume remains flat, weakening support for BTC’s move above $105K.
Sentiment must exceed 60% with rising open interest to avoid retest of $102K support level.
According to the latest Advanced Sentiment Index data, Bitcoin sentiment has weakened despite the asset making a small recovery. As of June 13, the index recorded a reading of 46.1%, falling below the neutral 50% mark. This shift indicates a cautious market environment where investors remain hesitant to drive further gains without stronger confirmation signals. While Bitcoin has rebounded from recent lows, sentiment metrics and trading volume suggest limited conviction behind the price move.
According to the Bitcoin Advanced Sentiment Index, the current reading has fallen to approximately 46% just below the neutral 50% threshold. The chart shows that after bullish sentiment peaked above 80% in early June, the index has gradually declined; despite the recent TELEGRAM /(@TradeWithARZ) June 14, 2025
Data from the Advanced Sentiment Index shows that market optimism peaked above 80% in early June but has steadily declined since. The chart, tracking activity from May 16 to June 13, shows that sentiment dropped below 20% on multiple occasions, including June 5 and June 13, both aligning with short-term declines in Bitcoin’s price. Although the asset has since bounced back from those levels, investor confidence remains subdued.
The bell curve model used in the chart emphasizes that the majority of sentiment readings have clustered between 40% and 65%, showing a lack of extreme bullish or bearish positions. This distribution suggests uncertainty, as traders hesitate to take strong directional bets.
Recent price action within the $103,000 -$105,000 area has, however, not been accompanied by new volume inflow as net buy volume and volume delta show almost no change. The stagnation of these indicators suggests that the market participants did not support the rise to a sufficient degree.
Price Volatility Contains Within Narrow Range
According to CoinMarketCap, Bitcoin was trading at $104,950.96 at the time of writing, reflecting a 0.31% decrease over the past 24 hours. The price surged above $106,000 but faced resistance and returned to a tighter trading band. A major dip occurred around 6 PM on June 13, followed by a rebound during the early hours of June 14. Despite these fluctuations, the asset has not broken out of its recent consolidation pattern.
Source: CoinMarketCap
The volume-to-market cap ratio over the last 24 hours is 2.38%, which indicates moderate trade. The total circulating supply of bitcoin has now grown to 19.87 million BTC and is getting ever closer to the protocol-imposed limit of 21 million. Despite the stability seen in price action, analysts are monitoring bigger signs before calling a directional change.
According to analysts, the sentiment index needs to exceed 6065 percent to validate a sustainable uptrend. An increase in open interest and net taker volume is unlikely to achieve that level. In the absence of those conditions, the market is vulnerable to retesting lower support areas between $102,000 and $103,000.

STOP LOSS LESSONI want to share my opinion about stop-losses.
I don’t use them, because very often the stop gets triggered — and then the price moves in the right direction, but you're no longer in the trade.
I do it differently: I set a take-profit, but no stop-loss.
Let’s say I have $1000, and I enter a short with $100.
The price would have to increase 10 times to get me liquidated.
A 2–3% drawdown is acceptable, especially in an overbought market.
So why would I use a stop?
Trade with small amounts — and everything will be fine.
You won’t lose money.
If you're looking for excitement, go to a casino — the odds are better there.
In trading, you need to be careful and stay calm.
From my experience, technical analysis often doesn't work.
Thanks for your attention.
#stoploss

SHORT BTC✅ Short Setup Summary – BTCUSDT (15m chart)
🧭 1. Context
Volume Profile shows clear value area and Point of Control (POC) between ~104,000–106,000
Price is expected to retrace to supply at 106,400 (previous HVN & resistance)
Trade plan: Short from 106,400 → down to 100,600 zone
📌 Trade Idea Breakdown
🔄 Trade Direction: Short
🟩 Short Entry Zone: ~106,400
🟥 Stop Loss: Above the recent swing high (~107,000+)
🎯 Take Profit (TP): 100,600–100,300 (previous demand/liquidity zone)
📏 Checklist-Based Analysis
✅ 1. Market Structure
Current short-term structure is bearish (lower highs, lower lows)
Plan to enter at pullback into resistance, in-line with the trend
📘 Rule: Always trade with MS unless you have a trap or reversal
✔️ Structure: Bearish → short pullback is valid
⚠️ 2. Key Level (106,400)
Acts as supply zone / resistance
Also lines up with previous POC / volume cluster
High probability reaction area
📘 Rule: Trade from areas where volume or liquidity previously reacted
🔻 3. Entry Confirmation
Watch for:
Trap wick (SFP) or
Bearish engulfing / 3-bar reversal
On M15 or M5 before entry
📘 Rule: Do not enter blindly — wait for confirmation
📊 4. Volume Check
Monitor if volume increases during the test of 106,400
Preferably with aggressive sellers stepping in
📘 Rule: Volume spike + rejection wick = institutional activity
🛡 5. Risk Management
Component Value / Zone
Entry ~106,400
SL Above 107,000 (last clean high)
TP 100,600 – 100,300
R:R Target at least 1:3
📋 Execution Rules Summary
Step Status
Market structure bearish ✅
Supply zone identified ✅
Entry confirmation seen? 🔲 Wait
Volume reaction checked? 🔲 Wait
SL/TP based on structure ✅
🧠 Final Thoughts
This is a solid short setup plan with the trend.
You’re selling from a liquidity cluster + resistance + supply area — a confluence zone.
Just ensure you:
Wait for trap confirmation or bearish price action
Don’t jump in early — let price show weakness first
Watch for volume spike confirming rejection at 106,400

LONG BTC✅ Long Setup Summary (BTCUSDT)
🧭 1. Daily Timeframe Context (D1)
Price is approaching a key low zone at 100,300 – 100,600
This is a previous liquidity area, often where large players hunt stop-losses
Expecting a trap or reversal if price sweeps below and quickly recovers
📌 Rule: Always check the Daily chart to:
Understand current trend bias
Identify if price is at support/resistance
Spot any trap or reversal signals (e.g., engulfing, pin bar, 3-bar reversal)
📐 2. Market Structure (M15–H1)
Short-term structure is currently bearish (lower highs, lower lows)
Trade idea is a counter-trend long, so confirmation is critical
📌 Rule:
Confirm market structure on M15/H1 before entry
Counter-trend trades must have trap confirmation to reduce risk
🔻 3. Trap / SFP Confirmation (Key Entry Condition)
Watch for price to break below 100,300 (previous low) and reject sharply
Look for a swing failure pattern (SFP) or false breakout wick
Entry is valid only if price closes back above the trap zone
📌 Rule:
Never enter just because price is at support
Only enter after trap wick + bullish candle confirmation
📊 4. Volume Confirmation
Look for a spike in volume at the trap wick
Confirms real interest and activity from institutional participants
📌 Rule:
A proper reversal setup includes price trap + volume confirmation
Avoid setups with low or flat volume during the move
🎯 5. Entry Plan
Component Details
Buy Zone 100,300 – 100,600
Entry After confirmation: trap wick + bullish candle
Stop Loss Below the trap wick (example: 99,800)
Take Profit 106,400 (prior resistance / supply zone)
R:R Ratio Minimum 1:3, depending on execution
📌 Rule:
SL must be based on trap invalidation, not random distance
TP should be at the next key structure, not a fixed pip target
✅ Execution Checklist
Step Check
Daily bias aligns or neutral? ✅
Market Structure reviewed? ✅
Trap / SFP occurred? 🔲
Volume spike confirmed? 🔲
Bullish PA confirmation? 🔲
SL placed correctly? ✅
TP set at logical structure? ✅
📌 Summary
This is a high-probability counter-trend long setup from a key liquidity zone.
Success depends entirely on:
A clean trap/SFP wick
Volume spike at the low
Bullish price action confirmation
Without these, avoid entering.
Stick to the rules, and let the market come to you — don’t force the trade.

BTC - FRACTAL!!!!I found a fractal, the price should rise to the range of 110888, and then there will be a sharp decline, a squeeze will form, with the price supposedly rising and crossing over, but in reality, the price will be pushed down sharply to a range below $90k. I have an idea related to this, I called it the dragon's wings pattern. At one point, I simply realized that the chart repeats what has already happened, and this is exactly what needs to be analyzed. I think the price will go exactly as I have drawn it. All the best and stay disciplined!


Bull Trap or Just the Beginning? All Eyes on 103kOnce we cleared the 109k ATH, I began tracking this new structure (in blue). Considering the current macroeconomic backdrop, it’s starting to make a lot more sense.
There’s plenty of noise about this being the biggest bull run in recent times, but looking at the chart, FVGs left behind, lack of volume commitment, and inefficient price action… are we actually gearing up for one of the largest bear markets we’ve seen instead?
You really don’t want to see a weekly close below 103k.

Bitcoin long 97kPlanning on a push below 100k over the next few days, I'll be looking for possible entry around 96 - 98k if LTF shows good support.
The monthly open is at 100k so Id expect to see some rejection at that level, there's also a monthly FVG around 97k which price could revisit.
My target will be the BTC highs, areas of interest marked on the chart.
