Bitcoin Prediction Update - BTC Crashed as expected! What’s nextBitcoin Crashed as Predicted! I am updating the current price action of CRYPTOCAP:BTC , and if we can reach our main target of $93K! Smash the Rocket Button if you did not completely hate this update! See you very soon again!
BTCUSDT.P trade ideas

Bitcoin to $100k Soon. The End of Bitcoin Bear Markets? In this chart we explore the batshit idea that we'll never have another bitcoin bear cycle ever again due to macro conditions and supply shock from no one needing to sell.
Not investment advice obviously.

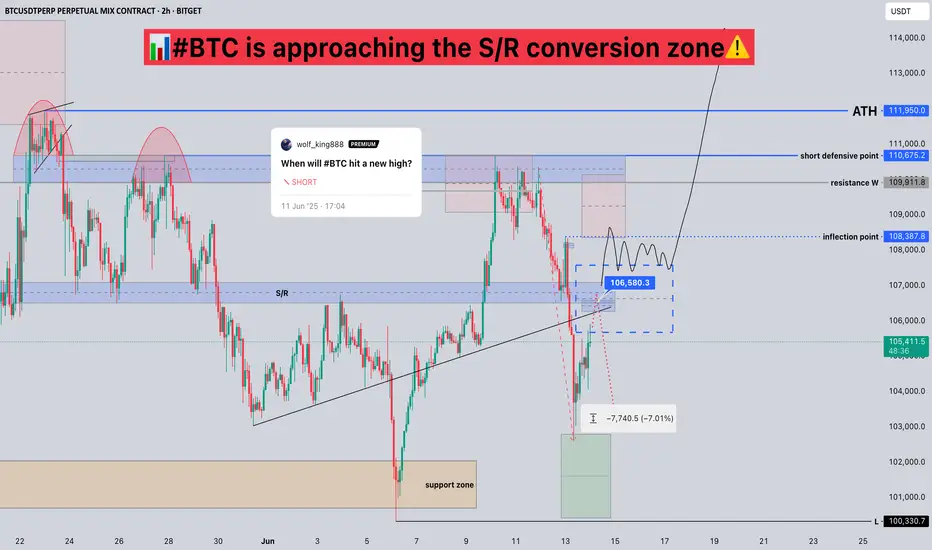
#BTC is approaching the S/R conversion zone📊#BTC is approaching the S/R conversion zone⚠️
🧠Yesterday's long orders were swept after moving up the SL, because the support zone near 106500-107500 was broken, and the support zone turned into a resistance zone.
➡️If the price rebounds here again, it may be resisted. Therefore, we can look for some short signals to participate.
➡️If we still want to continue to rise, we can only remain optimistic after breaking through the support-resistance conversion zone and stabilizing.
🤜If you like my analysis, please like 💖 and share 💬
BITGET:BTCUSDT.P
This Isn't a Crash Yet: Bitcoin's Real Correction Is Just Beginn⚡️ Hello, everyone! Bitcoin fell to $102,700 overnight. Liquidation volumes reached over a billion dollars according to official data alone. In reality, the figure is much higher.
This correction was linked to the start of hostilities between Israel and Iran. But those who follow me know that I have been predicting this for the past few weeks.
🌐 People think that geopolitics and macroeconomics drive the markets. And in part, that is true. But almost always, the signs of a sharp price movement in the near future are always visible on the chart much earlier.
➡️ And that is why I believe that the current decline is only the beginning:
A triple top has formed on the 4H timeframe. There are a huge number of gaps below, starting with $102,810 - 97,368, and another $93,270 - 85,162. And as we know, in 99% of cases, gaps close sooner or later.
There are 1 billion liquidations at the $102,700 level alone. Now imagine how much liquidity there is at the $99,000 level? And at $90,000? I don't even need to turn on the indicators to understand that there is now a huge amount of liquidity in longs concentrated below. Because throughout the entire last impulse from the 70 levels, we have hardly seen any normal correction.
⚙️ What the indicators say:
Money Flow - the outflow of liquidity and closing of positions continues. A divergence has formed even in the current movement, hinting at a potential continuation of the correction.
Dynamic Sup/Rez - the level of $105,773 is one of the most important levels, judging by the trading volumes on it. It is now also the key resistance level. The nearest support of the same strength, judging by the volume of demand, is no earlier than $94,750. And its volumes are significantly lower, at least for now.
📌 Conclusion:
For a long time now, all indicators have been literally screaming at us that a correction is about to begin. But no one believes it. I do not believe that Bitcoin will fall to 95 tomorrow. We may even see a rebound to $107,000 to close the newly formed above us and drop those who decided to short too early.
The price moves from liquidity to liquidity — that's the law. And right now, there is simply no liquidity at the top, just as there is no demand to set new ATXs at $150,000 or whatever everyone is waiting for.
🔥 So let's be patient, or better yet, stock up on free USDT and get ready to increase our positions. Because we will definitely get such opportunities soon.
Have a great weekend, everyone!

Bitcoin Analysis | Key Support Retest in Progress📉 Bitcoin Analysis | Key Support Retest in Progress
As shown in the chart, BTC has dropped precisely to the main support zone previously highlighted in our earlier analyses. So far, we haven’t seen a strong bullish reaction, which increases the likelihood of a retest of the major green support area.
🔻 If price breaks below the $104,120 level, the next key support to watch lies between $103,570 – $103,300.
🔼 However, if BTC starts to bounce from this zone, the key resistance levels and upside targets will be:
$104,740
$105,900
$106,800
and potentially $107,900
📌 All these zones have acted as key turning points in the past, so mark them on your chart and trade accordingly.
👉 Follow for more sharp entries, accurate technical zones, and daily trading insights!

BTC gathers liquidity ahead of growth Inside the trading range Bitcoin has moved into a sell-off phase due to the situation in the Middle East. The sell-off could extend to 102500 - 100600. But as the market is trending and bullish, the support at 100600 may hold the price and allow the market to strengthen
Scenario: A false break of the resistance at 105280 is formed. Accordingly, I am initially waiting for a decline to 102500. If 102500 fails to hold the move, bitcoin could then head to the liquidity pool. A false break of 100600 may give a chance for a rise to 105200 - 108200.

TradeCityPro | Bitcoin Daily Analysis #116👋 Welcome to TradeCity Pro!
Let’s dive into the analysis of Bitcoin and the key crypto indices. As usual, I’m going to review the futures triggers for the New York session.
✅ Yesterday, a very important event occurred: Israel launched a military attack on Iran, targeting not only military facilities but also residential areas.
⚔️ Leaving aside the fact that war is always a global tragedy, the fact that Israel also hit civilian zones shows that the tensions between these two countries have entered a new phase.
💫 In addition to civilian casualties, key commanders of the Iranian military were assassinated in these strikes.
🏳️ Most countries such as the United States, France, and most of Europe supported Israel in this conflict, while only North Korea and Russia backed Iran.
📊 Given these rising tensions and the cancellation of Sunday’s negotiations between Iran and the U.S., the likelihood of war between Iran and Israel has greatly increased following the resolution signed yesterday.
⭐ This development has caused safe-haven assets like gold to move upward, while risk-on assets like crypto have started to decline. As you can see, Bitcoin has been falling since yesterday.
⏳ 1-Hour Timeframe
On the 1-hour chart, as mentioned, after an initial correction to the 108436 zone, Bitcoin continued its decline down to 103606, breaking through the support level we had marked due to the war-related news.
✨ Currently, the price has found support at 103606 and has started a corrective phase. RSI has also exited the Oversold area and is now heading toward the 50 zone.
📉 In my opinion, under the current market conditions, we should wait to see how Iran reacts to Israel's actions. If war breaks out, Bitcoin is likely to drop again.
⚡️ Personally, I’m holding off on opening any positions until we get more clarity on the fundamental developments between Iran and Israel. I'm also not closing any of my longer-term positions that were opened in lower zones like 88k.
🔔 However, if you are looking to open a position, you could enter on a break below 103606. I don’t currently have a trigger for a long position and would prefer to wait for a proper structure to develop.
👑 BTC.D Analysis
Bitcoin dominance moved upward along with the market decline and, after breaking through 64.18, continued its bullish leg up to 64.85.
🧩 It has since begun a corrective phase after hitting that resistance. If this correction continues, the next zone to watch is 64.49.
📅 Total2 Analysis
This index also dropped alongside Bitcoin yesterday, falling from 1.18 down to 1.12 after triggering a short.
🔍 The price has since corrected up to 1.14. If a new bearish leg begins, we can open a short position on a break below 1.12.
📅 USDT.D Analysis
Tether dominance moved upward after triggering 4.68 and reached 4.89.
💥 If 4.79 is broken, the correction could continue. If 4.89 is broken, the next bullish leg in dominance will begin.
❌ Disclaimer ❌
Trading futures is highly risky and dangerous. If you're not an expert, these triggers may not be suitable for you. You should first learn risk and capital management. You can also use the educational content from this channel.
Finally, these triggers reflect my personal opinions on price action, and the market may move completely against this analysis. So, do your own research before opening any position.

BTC - Update on Suspected Flash Crash ScenarioFor those of you who have been following my ideas, and I don’t think that would be many - understandably so, because these ideas seem so outrageous and out of the norm - I feel obligated to provide updated numbers per my own personal trade ideas.
I expect BTC to flash crash. In summary, here is why:
1. DXY is breaking down and retesting a major bearish trendline on the monthly. This alongside geopolitical events and sentiment, I expect the dollar to fall rapidly and store of value assets such as BTC to see a multi year bull run.
2. The market has been steadily bringing BTC up since late 2022. This leaves a trail of long position stop losses below the price, leaving a massive chain reaction of sell orders ready to set off one into the next. In other words, the orders required to make the drop are already in the chart.
3. It’s a question of when - BTC is under 3 intersecting bearish trendlines, and we can see how price breaks above and below these support / resistance levels historically. Eventually they will hold and play out, estimating when is tricky - that’s why I use DXY to predict it.
It’s difficult to pinpoint where the upper resistance is - but a pretty solid pick is around 105,200. I’ve used various numbers in the past for this idea, but it’s always refining and evolving based on what I see price doing.
I’m proposing two movements for a massive liquidation sweep of the lows prior to a 3-5 year bull run where BTC sees those quarter million dollar prices.
Scenario 1:
105,200 to 35,000
35,000 retrace to 77,000 ( although this doesn’t have to happen, I just anticipate a 3 wave corrective move)
77,000 to 10,000 (could be as low as 7,000)
7,000 and upwards of 200,000 (after all liquidity is absorbed and reclaimed)
Scenario 2:
105,200 straight down (for the most part) to 17,000 to 20,000
17-20,000 and upwards to 200,000 plus
Personally I feel scenario one is most likely. I’ve been trading this market since 2017 and the newfound “ stability “ of Bitcoin during the last 2 years cannot be trusted. This upwards move IS NOT a bull run. It’s a BEARISH RETEST.
Bearish retests typically move straight up, exactly as what’s been happening - following by a drop roughly 10 times as fast.
Same ideas on the larger time frames as smaller time frames.
WHEN DO I EXPECT THIS TO HAPPEN?
Starting any minute and spanning over the next several days to week.
Anyway - that’s my update for those of you who are interested.
Understand this stuff gets laughed at - but I experienced the same treatment when I told my group to long BTC at 16,500 in Jan 2023 to a target of 90,000. It’s not new to me and I expect it.
Doing my best to help advise and open your minds to alternative ideas.

A possible 100k scenario?Good day!
Its been a while since a bloodbath. And there is another possible cycle down to 100k. Will this continue?
#NFA
#TYOR

HolderStat┆BTCUSD local correctionBINANCE:BTCUSDT
→ Price coils between rising-channel mid-line & descending cap
↳ 108 k lid: clear it to unlock 112–117 k upper rail
⇢ Hold 105 k mid-rail to keep staircase intact
⤴ Drop < 104 k flips bias to 102 k base

CAN YOU SPOT THE BULLISH FLAG THERE?As usual, I love clean chart. too much is too much. So, tell me whether there is a formation of bull flag there? (are we seeing the same continuation?) retracement a bit this weekend and it will continue to bull next week?

BTC Long Trade Setup IdeaWhy go long here?
1. Fill H4 i-FVG
2. OTE Zone
3. Bullish CISD
Trade Setup Idea:
- Entry Range: 103734.2 - 103020.2
- Stop Loss (SL): 102517.3
- Target Level: 100350.0

Bitcoin (BTC): Bullish, But Don't Buy Yet! Here's Why.Hello, traders! 👋 Let's break down the current situation with Bitcoin .
🔍 Overall Bias: Bullish
Bitcoin has confirmed its intention to continue the bullish trend towards a new All-Time High ( ATH ). This comes after a successful sweep of Sell Side Liquidity (SSL) and a confirmation of the bullish daily structure.
Price has already corrected into a discount zone, which is generally favorable for buys. But wait! Don't rush to open long positions just yet.
🐳 The Whale's Game Plan
The large players have a crucial Point of Interest (POI) below us — a 4h order block . This specific order block is what engineered the SSL sweep, making it a powerful support level and a magnet for price.
To sweep that liquidity and trigger the stop-loss orders of retail traders, the "whales" had to open short positions. Now, to continue the uptrend, they need to close those shorts at break-even or a small loss. The 4h order block is the perfect place to do that.
My Trading Scenarios
1️⃣ Primary Scenario: The Ideal Entry
I expect a mitigation of this 4h order block. I will be closely watching the price reaction around this POI and the 78.6% Fibonacci retracement level .
If the level holds and we get a Lower Timeframe (LTF) confirmation (e.g., the beginning of a bullish order flow), long positions could be considered.
🎯 Potential Long Entry Zone: ~ $102,745 - $103,868
2️⃣ Alternative Scenario: The Retail Trap
Price might not drop to our POI immediately. It could first bounce from the current levels, luring impatient retail traders into long positions. After that, a sharp drop could shake them out before the real move up begins next week, targeting the Previous Month's High (PML) as a minimum objective.
Conclusion
Patience is key. We need to watch the actual price behavior and reaction once the "whale" delivers the price to our POI.
This is not financial advice. My analysis is for educational purposes only.Hello, traders! 👋 Let's break down the current situation with Bitcoin.

BTC will be 74k soon/i sell all my altcoins I found fractals that confirm my idea, let's call this pattern “dragon wings.” I think the price will fall to $74k at best, and from there I will consider buying.

BITCOIN Short Position Update – June 11, 2025We are the SeoVereign Trading Team.
With sharp insight and precise analysis, we regularly share trading ideas on Bitcoin and other major assets—always guided by structure, sentiment, and momentum.
🔔 Follow us to never miss a market update.
🚀 Boosts provide strong motivation and drive to the SeoVereign team.
--------------------------------------------------------------------------------------------------------
Bitcoin downside perspective shared.
Currently, Bitcoin appears to have entered an overheated zone based on both Elliott Wave Theory and harmonic pattern analysis.
While it has been continuously setting new highs alongside Ethereum, the technical structure suggests the possibility of a short-term pause.
Accordingly, a bearish idea is shared.
The first target is set at 108,600.
More detailed ratio analysis and additional reasoning will be shared through an idea update once the first target is reached.
Flexible response according to market conditions is necessary.

Bitcoin (BTC): Strong Selloff | Sellers Taking OverBitcoin is bleeding due to the economic news. Escalating tensions between Iran and Israel, with reports of Israel possibly preparing military action against Iran, have triggered a strong selloff on BTC, which might send the price back below the 100K area if buyers do not manage to take back control over the $108K area.
We are in a big tension zones currently so we will be waiting to see how everything escalates. If buyers fail to show dominance anytime this week, we will be switching our view to bearish.
Swallow Academy

Its shopping time broToday is Blessed-Friday-sell on BTC. Buy it or miss it.
Now I do not want to listen,
"Oh, Abdul, we missed it. Next time, I will follow you for sure."
:)

BTC harmonics2 btc harmonic possibilities to watch out for. Of course, everything can be invalidated, but they are on the chart for now until invalidation.

BTC 4H. $104K or Bust — Critical BTC Moment! 06/13/25BINANCE:BTCUSDT remains in a sideways range between $110,336 – $101,297. The main trading volume is concentrated around $103,907.
Recently, the price reached the upper boundary of the range at $110,336 and sharply declined from there — confirming the strength of resistance. The drop was intensified by negative geopolitical news (Israel–Iran tensions).
As a result, BTC retraced into the $104,185 – $101,297 demand zone — a potential area where buyers might step in again.
Personally, I expect one more dip into the $104,185 – $101,297 range to test the strength of buyers.
⚠️ If negative news continues, a breakdown below $100,349 and a new local low is possible.
DYOR.

Markets Crash: Gold Soars, Crypto Dips!Israel’s strikes on Iran shook markets—Bitcoin and stocks tanked, gold soared. What’s next? Let’s unpack the best trading moves for this chaos!
Hey traders, Skeptic here!👋 Yesterday’s Israeli strikes on Iran’s military and nuclear sites, plus high-profile casualties, sent markets into a tailspin. If your positions got stopped out today, don’t sweat it—that’s normal in this mess. Today, I’m breaking down the most likely scenarios for financial markets, especially stocks and crypto, with no FOMO, no hype, just reason. Stick with me to navigate this storm!
📉Right now, markets are screaming risk-off . Stocks like the S&P 500, indices, and crypto like Bitcoin are bleeding as buyers have zero confidence. Everyone’s piling into safe-haven assets like gold, the Japanese yen, and the Swiss franc. Last night’s news triggered sharp drops in Bitcoin and SPX500, while gold’s rallying hard. This is classic flight-to-safety behavior, and it’s why your stops might’ve been hit. Let’s dive into the geopolitical scenarios driving this and then get to the charts.
📍First, the big picture.
Scenario one: Iran retaliates for Israel’s strikes, and we’re stuck in a tit-for-tat escalation for weeks. Markets stay risk-off, stocks and crypto keep sliding, and safe havens like gold thrive.
Scenario two: The US-Iran nuclear talks on Sunday, June 15th, lead to a deal, tensions cool, and markets stabilize. If those talks fail, I’m not optimistic— recent US inflation relief, might’ve pushed the Federal Reserve toward rate cuts to boost markets. Without de-escalation, rate cuts won’t save risky assets, and we’re looking at muted growth for crypto and stocks.
But if a deal happens, markets could rip—Bitcoin might hit $130K short-term and even $170K as the bull run’s ceiling. For now, uncertainty rules, so let’s see what the charts say.
👀 Let’s start with Bitcoin on the daily.
The first major support is $100K-$101K. If we lose that, we’re looking at a 3-4 month time-based correction . I know some of you see Bitcoin’s dip and think it’s a bargain, but hold up—if tensions escalate, breaking $100K-$101K is almost guaranteed. We could slide to $95K (0.382 Fibonacci retracement) or even $86K (0.618 retracement). No buying until Tuesday’s clarity—too risky. Shorting? Also a bad idea. After this sharp drop, where do you put your stop-loss? An 8% stop is the minimum, which trashes your risk-reward ratio. Best move? Sit tight, no positions, and wait for the dust to settle.
📈 Gold’s the star in this risk-off market.
On the 4-hour, as we said in last week’s watchlist, it broke the descending channel’s ceiling at 3333.86 and pulled back. Using our trick of cloning the prior channel and placing it above, it’s reacting perfectly at the new channel’s midline. A break above 3434.35 could push us to the channel ceiling at 3550.13 . Personally, I’d wait for more ranging here before going long—stops are too wide right now for a clean entry. If you caught our 3340 long trigger from the watchlist, you’re sitting pretty— just hold . Gold’s got more upside potential, but if you’re not in, don’t FOMO. Wait for a better setup.
🎯 Our EUR/USD long trigger from last week’s watchlist at 1.14555 was a winner
if you took it, you hit your risk-reward target and likely locked in profits. Nice work! The new long trigger is a break above 1.16142 resistance. No short triggers here, just like gold. With both major and secondary trends screaming uptrend, shorting against the flow is nonsense. I’d wait for key levels to break and confirm a bearish shift before even thinking about shorts. Trade with the trend, always.
📝our plan: Gold longs above 3434.35 target 3550.13; hold 3340 entries or wait for a range. EUR/USD longs above 1.16142, no shorts. Risk max 1% per trade, set alerts, and stay patient—geopolitical chaos means no FOMO moves.
I hope for a day with no wars, where we can focus on what matters—building value and humanity.🤍
That’s today’s breakdown, traders!
If this helped, smash that Boost button and Follow for more no-hype analysis. Drop a comment—what’s your next move? Want a coin or market analyzed? This is Skeptic, stay safe, protect your capital, and see you next time! <3

DeGRAM | BTCUSD correction from the 110k level📊 Technical Analysis
● Price has reclaimed the rising-channel median at ≈106.8 k and immediately made a higher-high on expanding volume; hourly RSI also pierced its two-week bear trend, flagging fresh upside energy.
● An ascending triangle is forming between 107 k support and a 109.5 k ceiling; its measured move coincides with the red supply/upper rail at 111.6-112 k.
💡 Fundamental Analysis
● Softer US PPI (-0.1 % m/m) dragged real 2-yr yields to one-month lows, easing dollar pressure, while spot-ETF desks soaked up another ≈4 600 BTC this week, signalling renewed institutional demand.
✨ Summary
Stay long above 107 k; triangle break over 109.5 k unlocks 111.6 k then 115 k. Long view invalidated on a 4 h close beneath 103 k.
-------------------
Share your opinion in the comments and support the idea with a like. Thanks for your support!

Bitcoin just gave a masterclass on Effort vs. Result.War news? Massive sell volume? No breakdown.
✅ Held and reclaimed the 200 EMA
✅ Price stayed elevated despite heavy effort to push it down
This is bullish divergence in action:
Big effort, little result = strength.
🎯 If this holds: $71.8K → $73.6K → $75K are in play.
Bears failed. Structure stands. Follow price, not panic.

BTCUSDT ShortBTCUSDT – Watching 105.8K–106.5K Supply Zone
Price currently retracing after a strong dump from 108K. I'm eyeing the 105.8K–106.5K zone for a potential short — previous order block + premium zone for smart money selloff. If price rejects there, I’ll target 103.5K and possibly 101K. SL above 106.8K.
Structure still bearish until proven otherwise.
