BTC - Bulls Getting Ready!!Hello TradingView Family / Fellow Traders. This is Richard, also known as theSignalyst.
📈BTC has been bullish trading within the flat rising wedge marked in blue and it is currently retesting the lower bound of the wedge.
Moreover, the orange zone is a strong demand.
🏹 Thus, the highlighted blue circle is a strong area to look for buy setups as it is the intersection of demand and lower blue trendline acting as a non-horizontal support.
📚 As per my trading style:
As #BTC approaches the blue circle zone, I will be looking for bullish reversal setups (like a double bottom pattern, trendline break , and so on...)
📚 Always follow your trading plan regarding entry, risk management, and trade management.
Good luck!
All Strategies Are Good; If Managed Properly!
~Rich
BTCUSDT.P trade ideas

Bitcoin Recovers Above 105,000, Extremely Bullish +AltcoinsBitcoin produced only two days red, a bear-trap, and is now trading daily back above $107,000, an extremely bullish development.
Good morning my fellow Cryptocurrency trader, I hope you are having wonderful day.
The altcoins market bull market is confirmed and what Bitcoin is currently doing gives further strength to the bullish case and bias. It will be only a matter of days before the entire altcoins market turns strongly bullish with major momentum.
The range is still valid though, $100,000 - $110,000. But this time around the upper-boundary is likely to break and the last ATH tested, a new all-time high is even possible and also highly probable which is what will propelled the altcoins to hit multi-year highs and some even new all-time highs. Many pairs will move ahead.
With each passing day, the Cryptocurrency market will continue to heat up. We can expect growth long-term.
The 2025 bullish cycle started with the 7-April market low. The start of the third wave started 22-June and should go for 2-3 months. Then we will have a correction, the fourth wave followed by one final jump, the fifth wave.
We can expect growth now and all through late 2025. The entire period will be bullish. Only when the marketwide correction comes there will be a pause but many pairs will grow even at this point.
Choose wisely. Low risk vs high potential for reward.
Aim high. Focus on the long-term.
Thanks a lot for your continued support.
Namaste.

Lingrid | BTCUSDT possible Channel Break - Upside Surge The price perfectly fulfilled my last idea . BINANCE:BTCUSDT is pulling back slightly after rejecting the descending red trendline near the 108,000 level, while remaining above the breakout zone around 105,000. The structure suggests a potential bullish continuation if the price holds this level and forms a higher low. A successful breakout above 108,000 could ignite a move toward the 111,000 resistance band.
📈 Key Levels
Buy zone: 105,000–105,300
Sell trigger: breakdown below 105,000
Target: 111,000
Buy trigger: breakout and retest above 108,000 with strong momentum
💡 Risks
Failure to hold 105,000 reopens path to 98,700
Bearish rejection at 108,000 could maintain lower high structure
Weak volume breakout may lead to a bull trap under 111,000
If this idea resonates with you or you have your own opinion, traders, hit the comments. I’m excited to read your thoughts!

$BTC to $107KPrice retraded into range of equilibrium on the 1h TF and created a bearish OB on the 15m TF and also a bearish rejection block on the 5m TF, which indicates that price might break lower in the next few days, with sellside liquidity pools at $107K.

TradeCityPro | Bitcoin Daily Analysis #123👋 Welcome to TradeCity Pro!
Let’s dive into the analysis of Bitcoin and key crypto indices. As usual, in this analysis I’ll go over the trigger levels for the New York futures session.
⏳ 1-Hour Timeframe
On the 1-hour chart, as you can see, Bitcoin is currently below a resistance zone at 109135 and is approaching this level with strong bullish momentum.
⭐ If the price breaks and stabilizes above this level, we can open a long position. Both the volume and market momentum are confirming this setup well, but the main long trigger remains the breakout of 109135.
📈 If this bullish move turns out to be fake and the price starts heading downward, the first trigger we have for a short position is the 107853 level. A break below this level would give us an entry for a short.
👀 Overall, I think the market has been pretty straightforward lately, and we don’t need complex tools to analyze it. Just these support and resistance levels and simple triggers are sufficient.
👑 BTC.D Analysis
Moving on to Bitcoin Dominance, the 65.04 floor has finally broken, and dominance is now trending downward.
💫 The next support ahead is at 64.81, which the price is approaching. We’ll have to see how the market reacts to this level. For now, the trend of dominance in the 1-hour timeframe appears bearish.
📅 Total2 Analysis
Let’s look at Total2. With Bitcoin Dominance dropping and Bitcoin itself moving upward, Total2 has started a strong bullish leg and is heading toward the 1.18 level.
🔑 Many of the altcoins I’ve analyzed have triggered their entries, and as long as Total2 remains bullish, these moves can continue.
📅 USDT.D Analysis
Now to Tether Dominance. After breaking below the 4.76 level, it has now reached the 4.72 floor.
💥 A break below this floor could confirm continuation of the downtrend, but in my opinion, the price may pause here for some correction and consolidation.
❌ Disclaimer ❌
Trading futures is highly risky and dangerous. If you're not an expert, these triggers may not be suitable for you. You should first learn risk and capital management. You can also use the educational content from this channel.
Finally, these triggers reflect my personal opinions on price action, and the market may move completely against this analysis. So, do your own research before opening any position.

Bitcoin pump back to $110450 todayStop: $108326
50% Tp at $109,550
25% tp at $110,450
Exit at $111,950
DTT Strategy

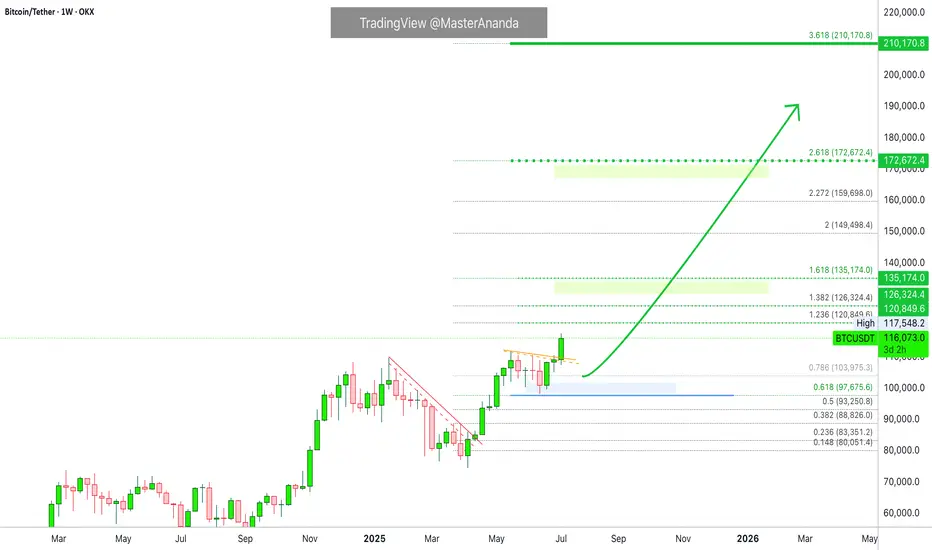
Bitcoin's Next Target Based on a 210 Days Long ConsolidationAfter each 210 days long consolidation phase Bitcoin advanced 137% on average, from bottom to top, since the November 2022 bear market low. Such an advance would put Bitcoin at a price of $170,000 next.
Now, the 137% is just the average. In one occasion Bitcoin rose 83% while in another occasion total growth amounted to more than 200%. We are counting the rise from the consolidation phase lowest point.
Let's look at some numbers:
» An 83% rise would put Bitcoin just above $135,000.
» A 128% rise would put Bitcoin right at $170,000.
» A 202% rise would put Bitcoin at a price of around $225,000.
~200% is how much Bitcoin grew between late 2023 and early 2024.
How much will Bitcoin grow exactly? We don't know. What we can know for sure is that there is plenty of room available for growth.
We are aiming for at least 100% growth starting from 100K, that is, a target of $200,000. Can be $180,000 just as it can be $220,000. That's the cycle top.
Do you agree with this target?
Leave a comment with your number.
Thank you for reading.
Namaste.
TradeCityPro | Bitcoin Daily Analysis #120👋 Welcome to TradeCity Pro!
Let’s dive into the Bitcoin analysis and key crypto indices. As usual, in this analysis I want to review the futures triggers for the New York session.
⏳ 1-Hour Timeframe
In the 1-hour timeframe, as you can see, Bitcoin has finally broken out of the range it formed yesterday and is now moving upward.
✔️ If this upward move continues, we can open a long position in these zones by getting confirmation in the lower timeframes. The main long trigger is still activated after breaking 110256.
💥 The RSI oscillator entered the Overbuy zone in the previous candle. We need to see how the price reacts to this move and what impact this oscillator will have on the price.
⚡️ In my opinion, this RSI move won't have much impact. Although the price is moving upward, the main trend has not yet formed, so there's no real momentum in the market, and RSI is basically useless for now.
✨ If this upward move turns out to be fake, we can enter a short position with the 107853 trigger.
👑 BTC.D Analysis
Let’s look at Bitcoin Dominance. Yesterday, dominance had an upward move and broke its ascending trendline but failed to stabilize above 65.52, resulting in a fake breakout and a move downward.
☘️ The fake breakout trigger for the trendline was the 65.38 zone, which was activated, and now the price is heading downward. If this move continues, the next target will be 65.04.
📅 Total2 Analysis
Alongside Bitcoin’s upward move, this index also activated the 1.14 trigger and is moving up, now reaching 1.15.
💫 If the move continues, the next entry trigger is at 1.17, which is still quite far from the current price.
📅 USDT.D Analysis
Looking at Tether Dominance, the 4.82 trigger was activated, and dominance is now moving down, having reached 4.78.
📈 If it stabilizes below 4.78, we can confirm the continuation of the downtrend in dominance, which could push it down to 4.72.
❌ Disclaimer ❌
Trading futures is highly risky and dangerous. If you're not an expert, these triggers may not be suitable for you. You should first learn risk and capital management. You can also use the educational content from this channel.
Finally, these triggers reflect my personal opinions on price action, and the market may move completely against this analysis. So, do your own research before opening any position.

Bitcoin has dropped for profitable purchasesBitcoin is within the range. Quite a bit of time has passed since the last retest, and the liquidity pool that has formed below 106345 may not allow the price to fall on the first attempt.
Global and local trends are bullish. Enter a buy position after a false breakout of support and the formation of a local reversal pattern on TF m5-m15
Scenario: if, after a false breakout, price consolidation forms above 106500, then the entry point could be a breakout of local highs (breakout of the structure - ‘bos’).

TradeCityPro | Bitcoin Daily Analysis #124👋 Welcome to TradeCity Pro!
Let’s dive into the analysis of Bitcoin and key crypto indicators. As usual, I’ll review the futures triggers for the New York session.
⏳ 1-Hour Timeframe
On the 1-hour timeframe, as you can see, Bitcoin made a bullish move yesterday after stabilizing above the 109391 level and managed to register a new ATH around the 112000 level.
⭐ The resistance at 111747 has effectively held back further price increases, and the price has reacted to it and entered a corrective phase.
✔️ I believe the correction could continue down to 110256. The next lower support levels are 109391 and 107853.
📈 If you already have a long position open, I recommend holding it. If the 111747 resistance breaks, a strong bullish trend could begin, and having an open position from earlier could have a big positive impact on your account.
🔼 If 111747 is broken, we can consider opening new long positions. If this level breaks, I’ll post a higher timeframe analysis to identify the next major resistance levels.
💥 RSI entering the Overbuy zone and rising volume would provide strong confirmation for this position.
👑 BTC.D Analysis
Bitcoin Dominance is still dropping. Yesterday, after breaking 64.81, it continued its downward move and is now approaching the 64.49 level.
🔍 If this level breaks, the drop could continue further, but in my opinion, after the recent drop, it's time for BTC.D to enter a correction phase.
📅 Total2 Analysis
Total2 has also had a bullish move, breaking through the 1.18 and 1.2 levels, and continues to rise.
🎲 The next resistance is at 1.24, which the price may target. However, I think there’s a high chance of a correction or consolidation phase starting soon.
📅 USDT.D Analysis
Looking at Tether Dominance, after the recent drop and the break of 4.72, it reached the 4.63 level and has formed a base there.
✨ If 4.63 breaks, USDT.D could head toward 4.56. In case of a pullback, the first level to watch is 4.72.
❌ Disclaimer ❌
Trading futures is highly risky and dangerous. If you're not an expert, these triggers may not be suitable for you. You should first learn risk and capital management. You can also use the educational content from this channel.
Finally, these triggers reflect my personal opinions on price action, and the market may move completely against this analysis. So, do your own research before opening any position.

BTC/USDT 4H Analysis – Key Supply Zone Holding Strong📊 BTC/USDT 4H Analysis – Key Supply Zone Holding Strong 🟥🟩
🚀 Chart Summary (July 7, 2025):
The BTC/USDT 4-hour chart reveals a clear range-bound market between strong support and resistance levels, with price currently consolidating inside a crucial supply zone.
🔍 Key Technical Highlights:
📌 Supply Zone (Resistance) – $109,500 to $110,800
🔴 Multiple rejections from this area (highlighted with red arrows) show that sellers are active and defending this zone aggressively.
🟡 Next major resistance target: $114,230.34 if breakout occurs.
📌 Demand Zone (Support) – $104,000 to $105,500
🟢 Seen several strong bounces here, indicating buyers stepping in confidently.
💪 Price has tested this support multiple times (green arrows) and maintained strength.
⚖️ Current Price Behavior:
📉 Price is once again pulling back after testing the supply zone.
This could either be:
A potential short-term retracement within the range
Or a build-up before a bullish breakout toward $114K 🎯
🧠 Conclusion & Outlook:
🔄 BTC is still range-bound, with no confirmed breakout.
🔺 Bullish Scenario: Break and close above $110,800 → possible rally to $114,230+.
🔻 Bearish Scenario: Drop below $104,000 → could retest $100K psychological level.
📌 Strategy Tip: Wait for breakout confirmation before entering major positions. Range traders may continue to play between the zones.
📈 Stay patient, follow structure, and manage risk carefully! 🧠💼

Do you think I'm joking ???The price is currently forming the second corrective wave, and a slight price drop to reach higher levels is normal.
Best regards CobraVanguard.💚

BTC - Isn't it obvious where it will go?BTC shorts not likely here - needs movement to top for further down momemntum!

Wait for 100k ( read reasons)If you look at my chart you can see the truth, Elliott waves are well marked on the chart, we are now completing the micro wave 2 of the main wave 5, I expect the corrective micro wave 2 to correct the price to Fibonacci 0.78, which is exactly touching the lower descending line of the channel and includes the 100k price range. Wait for the micro wave 1 correction to complete and buy again in the 100k range. I will not open a short position and I advise you to wait for the price correction to 100k.
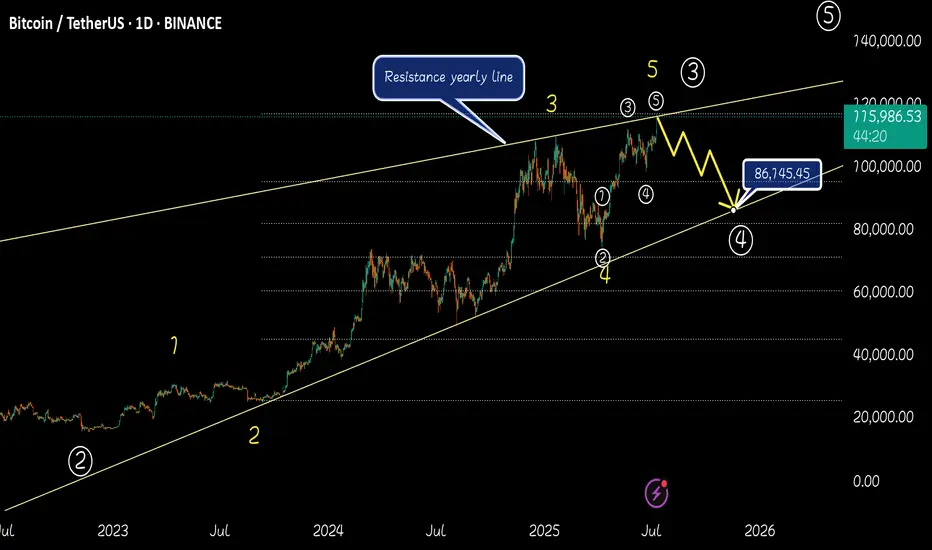
Crash incoming 117k - 86k Today btc record a new ATH . according to the Elliotts theory 117K was the end of main wave 3 . i think btc will start to dump very soon to 86k (wave4 ) . its need to start main wave 5 (86k - 140k) . Good luck. I think btc will bearish in next days.
BTC 1 hr technical analiysis Asset: BTCUSDT.P (Bitcoin Perpetual Futures)
Timeframe Provided: 1-Hour (1H)
BITGET:BTCUSDT.P
1. Higher Timeframe Bias (Assumed for 1H Context):
Based on the observed price action, specifically the strong impulsive bullish move around July 2nd-3rd, followed by a corrective pullback, it is reasonable to assume a bullish bias from the higher timeframes (Daily/4H). This assumption is crucial, as the 1H timeframe should ideally align with the dominant higher timeframe trend for high-probability setups. The strong push above previous resistance and the subsequent retracement suggest the potential for a continuation of an uptrend.
2. 1-Hour Structure Analysis:
Initial Structure: The price was generally ranging or in a slight downtrend until around July 2nd. We observe multiple internal bearish Break of Structures (1H BOS in red).
Change of Character (CHoCH): A significant bullish 1H CHoCH is observed around July 2nd, indicating a shift from a bearish to a bullish internal structure. This shift was followed by strong bullish momentum.
Break of Structure (BOS): After the CHoCH, the market showed clear bullish 1H BOS, confirming the new bullish impulse.
Current Structure: The market has recently pulled back significantly after the strong bullish impulse. This pullback has tested a key demand zone. We are looking for a continuation of the bullish trend from this pullback.
3. Liquidity and Inducement:
Sell-Side Liquidity (SSL): Prior to the bullish CHoCH, there were clear areas of sell-side liquidity that were swept, fueling the subsequent upward move.
Inducement: The current pullback, while corrective, may be acting as an inducement, drawing in early buyers or trapping sellers, before potentially continuing the upward movement. Price has swept some internal liquidity during this retracement.
4. Valid Demand/Supply Zones (1H):
Primary Demand Zone: The most prominent demand zone of interest is located roughly between $107,000 and $107,300. This zone represents an unmitigated order block (or a clear area of strong institutional buying) that initiated the significant bullish impulse. It also aligns with previous resistance that was broken and is now potentially acting as support (a "flip zone"). This is our primary point of interest for a long entry.
Mitigation: Price has begun to tap into this demand zone, indicating a potential mitigation phase.
5. Trade Setup Proposal (High Probability Long Setup):
Considering the assumed higher timeframe bullish bias and the current 1H structure, a long setup from the identified demand zone presents a high-probability opportunity.
Bias: Bullish
Entry Strategy: We are looking for confirmation within the demand zone. Given the 1H chart, a refined entry could be sought on a lower timeframe (e.g., 15M or 5M) for further confirmation (e.g., an internal CHoCH, aggressive entry within the order block). However, based on the provided 1H chart:
Proposed Entry Price: Around $107,150 - $107,250. This is within the heart of the unmitigated demand zone. The visual suggests an entry around $107,200.
Stop Loss (SL): Slightly below the low of the demand zone/order block, and crucially, below any structural low that would invalidate the bullish short-term structure.
Proposed SL Price: Around $106,750 - $106,900. The visual places the SL at approximately $106,900. This allows for some wick hunting but protects capital if the demand fails.
Target (TP): We will target the high of the recent bullish impulse, and potentially higher if the higher timeframe bias confirms a sustained uptrend.
Proposed TP Price: Initial target at the recent high around $110,900 - $111,000. The visual suggests $110,950.
Rationale for TP: This target represents the next logical liquidity pool (buy-side liquidity) and a significant structural high that, if broken, would confirm further bullish continuation.
Risk to Reward Ratio (RRR):
Entry: ~$107,200
SL: ~$106,900 (Risk: $300)
TP: ~$110,950 (Reward: $3750)
Calculated RRR: Approximately 1:12.5. This is an exceptional RRR and highlights the potential of this setup.
6. Important Considerations & Trade Management:
Confirmation: While the 1H demand zone is strong, for institutional-level entries, further confirmation on lower timeframes (e.g., a CHoCH or clear bullish momentum shift on the 5M/15M chart once price enters the demand zone) would be ideal.
Market News/Events: Always be aware of upcoming high-impact economic news (e.g., CPI, FOMC minutes, NFP) that could induce high volatility and invalidate technical setups. For crypto, major exchange news, regulatory announcements, or large whale movements can also impact price. As of Saturday, July 5th, 2025, there are no immediate high-impact economic data releases on the calendar for this weekend, but traders should always check the economic calendar for the upcoming week.
Partial Take Profits: Consider taking partial profits at intermediate highs or psychological levels to secure gains and reduce risk.
Trailing Stop Loss: Once the trade moves significantly in profit, consider trailing your stop loss to break-even or beyond to protect capital.
This detailed analysis, even with the limitation of a single timeframe, provides a clear, high-probability long setup based on advanced SMC principles. Monitor price action closely at the entry point and manage risk diligently.
Disclaimer: This analysis is purely for educational and analytical purposes and does not constitute a buy or sell recommendation or financial advice. All trading decisions must be made based on individual analysis, proper risk management, and careful consideration of market conditions by the trader themselves. As an AI model, I bear no financial responsibility for the outcomes of your trades.

Bitcoin Crash? No! The Bullish Wave Starts Now! $155,601 Next!Some people are still expecting for "Bitcoin to go down." Poor bastards, the advance is just starting. Bitcoin just broke out of a 210 days long consolidation phase. After this huge, long-term consolidation, expect a major advance. Next target is now set at $155,601.
This week is the first week green after the consolidation finally ends. The market was sideways for seven months, with some fluctuations, and the result is a bullish breakout. Why a breakdown? Why expect a drop? If the market just broke up—think about it—why would it go down?
If resistance is confirmed; you remember the range between $100,000 and $110,000. If resistance is confirmed then Bitcoin would start crashing down from $110,000. If the break of $110,000 does happen and Bitcoin moves to $112,000 as a bull-trap, then you would expect a major crash happening from $112,000 and no more. But, reality is saying, showing, something much different. We have a major advance. Resistance has been flipped into support.
Now, the first that is needed is the weekly close. It is still very early into this move but Bitcoin is showing maximum strength. Remember the altcoins? These confirm that the advance is just new, early, because these are recovering from all-time lows or major lows. There is still plenty of room for growth.
My people, wake up! Bitcoin is going up.
The next target is $155,601 and it can go higher, this is only the mid-term target based on the long-term. When Bitcoin consolidates for 7 months, it tends to grow some 137% on average, it can be less but it can also be much more. And it tends to grow at least for 1-2 months, but this also is just the average, Bitcoin can grow straight up for 4 months.
So, are you still bearish?
Oh please no! The bulls already won.
The 2025 bull market final phase starts now, soon you will experience a marketwide bull-run. We have not seen the euphoria phase, this is only the start. Prepare for additional growth.
I am calling out all of the bears, never bet down on Bitcoin; Bitcoin is going up.
Namaste.

CoinMarketCap chart and correlation with BTC
Hello, traders.
If you "Follow", you can always get new information quickly.
Have a nice day today.
-------------------------------------
(USDT.D 1D chart)
USDT dominance is showing a downward trend along the medium- to long-term downtrend line.
The decline in USDT dominance can be interpreted as an upward trend in the coin market.
Therefore, if it remains below 4.91 or continues to decline, the coin market is likely to enter a bull market.
The coin market is expected to show a major bull market until 2025.
At this time, the USDT dominance is expected to fall to around 3.42 and then rise, causing the coin market to enter a bear market.
Therefore, a major bear market is expected in 2026.
-----------------------------------------------
(BTCUSDT 1M chart)
You might think that it would be good if it continued to rise in a bull market, but in reality, that is not the case.
The reason is that if the price continues to rise, you have to buy more money.
Therefore, it will show a pattern of falling when appropriate and rising again when appropriate.
As I mentioned earlier, 2025 is a major bull market, so it will eventually show a rising pattern.
So, when should we buy and when should we sell?
It would be nice if we could know this a little bit faster, but we can never know.
Currently, BTC is renewing its ATH, so it is even more difficult to predict the movement.
Therefore, we can only predict it through predictable chart analysis techniques.
Among them, the method I use is to predict and respond to the high point using the HA-Low, HA-High indicators and the DOM (DMI + OBV + MOMENTUM) indicator using the Heikin-Ashi chart.
The DOM indicator indicates the end of the high and low points, and the HA-Low and HA-High indicators are used to establish a basic trading strategy.
The sky blue (#00bcd4) arrow is generated, indicating that the DOM (60) indicator is likely to be generated soon.
In other words, it means that the end of the high point is becoming more likely.
When the DOM(60) indicator is created, there is a high possibility of resistance, so the price is likely to fall.
Therefore, you should think about a countermeasure for the decline.
However, as I mentioned earlier, since 2025 is expected to show a major uptrend, it is recommended to sell in installments at an appropriate level to preserve profits.
The reason is that we cannot know how far it will fall.
The start of a full-scale decline is likely to begin when it falls below the HA-High indicator.
Therefore, if it falls after the DOM(60) indicator is created, we should observe whether a new HA-High indicator is created.
If a new HA-High indicator is created, the key point is whether there is support in the vicinity.
If a new HA-High indicator is not created, it is likely to fall to the current HA-High indicator location of 73499.86.
-
A trend line has been formed between highs, but a trend line between lows has not yet been formed.
Therefore, it is difficult to predict how far it will fall once the decline begins.
In the 2025 bull market, BTC is expected to rise to around the Fibonacci ratio of 2.618 (133889.92).
Therefore, we should also consider countermeasures for this.
------------------------------------------------
(BTC.D 1M chart)
When will the altcoin bull market start?
I think the timing is when BTC dominance falls below 55.01 and is maintained or continues to decline.
I think the rising BTC dominance means that the funds flowing into the coin market are concentrated toward BTC.
Therefore, we should consider that a market for trading BTC has been formed.
If BTC dominance fails to fall below the 55.01-62.47 range, BTC dominance is expected to rise to around 73.63-77.07.
At this time, it is highly likely that it will encounter strong resistance and begin to decline.
Since it has not fallen below the mid- to long-term trend line, it seems likely that it will continue to rise.
In order to eventually turn into a downtrend, BTC dominance must fall below 60.
If not, I think it will be difficult to expect an uptrend in altcoins.
----------------------------------------------------------------------
(BTCUSDT 1D chart)
This period of volatility is expected to continue until July 11.
Therefore, the key issue is whether there is support near 111696.21.
If there is support at the 111696.21 point, it is expected to rise to the right Fibonacci ratio 2.24 (116940.43).
If not, we need to check whether there is support near 108316.90.
As I mentioned in the previous idea, three conditions must be met to break through the 111696.21 point upward.
- The StochRSI indicator is showing an upward trend with K>D,
- The PVT-MACD oscillator is showing an upward trend (if possible, above the 0 point),
- The OBV indicator of the Low Line ~ High Line channel is maintained above the High Line,
If the above conditions are met, I said that there is a high possibility of a stepwise upward trend from the 111696.21 point.
-
The next volatility period is expected to occur around July 18 (July 17-19).
Therefore, we need to see if it can be maintained above 111696.21 until the next volatility period.
If it fails, we need to check if it is supported above the M-Signal indicator on the 1D chart, near 108316.90.
If not, it is likely to fall to the M-Signal indicator on the 1W chart or near 99705.62.
-
The basic trading strategy is to buy near the HA-Low indicator and sell near the HA-High indicator.
However, if the HA-High indicator rises, there is a possibility of a stepwise uptrend, and if the HA-Low indicator falls, there is a possibility of a stepwise downtrend.
The end of the stepwise uptrend is a downtrend, and the end of the stepwise downtrend is an uptrend.
That is, we can see that the support around the HA-High ~ DOM(60) section and the DOM(-60) ~ HA-Low section will be important turning points for the future trend.
----------------------------------------------------
On the USDT dominance chart, it seems likely that August 3rd will be the volatility period.
Looking at the BTC chart, it seems likely that August 2nd to 5th (August 1st to 6th) will be the pre-movement for the volatility period of August 1st to 6th.
-
Thank you for reading to the end.
I hope you have a successful trade.
--------------------------------------------------
- This is an explanation of the big picture.
(3-year bull market, 1-year bear market pattern)
I will explain more details when the bear market starts.
------------------------------------------------------

Bitcoin : Missed $100K? Don’t Miss What’s Coming Next!!MARKETSCOM:BITCOIN BINANCE:BTCUSDT continues to show exceptional strength and strong bullish momentum. When we look back at the charts from 2023 and 2024, a clear and reliable pattern stands out. Each time Bitcoin touched the 50 EMA on the weekly chart, it triggered a significant rally that led to new all-time highs. That same setup appears to be forming once again.
MARKETSCOM:BITCOIN tested the 50-week EMA around the $75,000 level and has since bounced with conviction. The price has reclaimed the $100,000 mark and is now challenging previous all-time high resistance. Historically, a successful bounce from this key moving average has not only signaled recovery but also sparked explosive upside moves.
Following this repeating pattern, the current cycle target is positioned at $150,000. A clean breakout above the current resistance zone could act as the trigger that launches Bitcoin into uncharted territory. The technical structure remains bullish, momentum is clearly accelerating, and the overall trend continues to favor the upside.
This moment represents a textbook Buy and HODL opportunity. Technical indicators are aligning, market sentiment is turning increasingly optimistic, and all signs suggest that Bitcoin could be preparing for another historic rally. Stay ready for what could be the next big move.
Follow Our Tradingview Account for More Technical Analysis Updates, | Like, Share and Comment Your thoughts

A Comprehensive Analysis !!!This market has shown disregard for technical patterns, and every time the price approaches historically significant levels, it reveals its true intentions and disappoints us. This cycle tends to repeat.
In my opinion, we’re likely to see one more drop in Bitcoin’s price. After that, instead of continuing the expected downtrend from the pattern, the price could break the descending formation and experience a strong upward move.
Stay Awesome , CobraVanguard.

BTC there was a limit seller yesterday 109700 BTC there was a limit seller yesterday 109700 . Today I'm looking at sales locally

PULL BACKFriends as per my analysis btc is forming an inverse head and shoulder pattern. with in a couple of days we will see a pull back up 101k area.

BTC makes new all time highs!Crypto has been soaring today.
Ethereum and BTC pumping liquidity!
Fed minutes came out today around 2pm, indicating rate cuts at next meeting and throughout the rest of the year and crypto absolutely loved that.
Crypto thrives in a cheap liquidity environment, rallying in potential rate cuts.
We took profits on IBIT calls - still holding longs in the BTC market expecting higher price.
