Bitcoin 4H – Battle at Resistance | Two Perspectives 🧪 1. 🐸 Miracle’s View – “Altcoins' Prophet” 🐸
"Yo fellow degenz! It's me – Miracle from the meme-coin clan, and I'm sniffing something bullish... but not so fast!"
Price is tryin’ to break out of a wicked resistance zone.
That red line? 🔴 It's not ketchup — it's the final boss trendline, and BTC must defeat it with volume ⚔️
Market sentiment is bullish, but Miracle says: "Wait for a clean break and retest — no fomo attacks!"
🔍 MA50 (gray snake) is curling up like a noodle of support. If we bounce off it again → 🚀 108.5K, 111K and beyond!
📉 BUT — if price gets rejected and drops below 105K… we might slide to 103.8K (or worse, the dungeon at 101.7K) 🕳️
📢 Miracle Rule: “Breakout without a retest is like a meme coin without a rug — rare!”
🔮 TL;DR:
🟢 Above 106.7K = Go time, ride the wave!
🔴 Below MA50 = Watch your bags, exit or short it with a stop above the resistance!
🔍 2. Unknown Analyst’s Neutral View (Clean & Pro)
BTC is challenging a major resistance zone between ~105.7K–106.7K.
A strong breakout above both the horizontal zone and descending trendline could initiate the next bullish leg.
MA50 and MA200 are offering dynamic clues:
MA50 holding = bullish confirmation if price closes above resistance
Failure to hold = a likely revisit to lower demand levels
Confirmation needed:
Clean candle close above resistance zone
Followed by a successful retest of the zone or MA50 as support
If rejection happens here → Potential retracement to 103.8K or lower (support & previous consolidation)
🎯 Targets on Breakout:
108.5K (local high)
111K (liquidity zone)
Extension possible if volume supports it
🧠 Dual Insight:
"Same chart. Two voices. One truth: Trade with logic — not emotion."
💬 Let us know in comments:
Are you team 🐸 Miracle or team 🧠 Unknown Analyst?
🎬 TradeWithMky – where altcoins speak louder than Bitcoin!
#Bitcoin #CryptoAnalysis #BTC #TradingView #TradeWithMky #MiracleShot #AltcoinArmy
BTCUSDT.P trade ideas

TradeWithMky — Where Altcoins Speak Louder Than Bitcoin!Welcome, fellow trader, to TradeWithMky — the only TradingView realm where charts are alive, trendlines whisper secrets, and candles burn with prophecy.
Led by Miracle, the pepe-faced meme wizard of TA, we don’t just follow the market — we ride it like a shooting star across the altcoin galaxy 🚀.
💡 Here’s what you’ll unlock inside this spellbook of price action:
🌀 Magic Channels & Trend Spells
🔄 MA50 Rejections & Support Summons
📉 Fakeouts Exposed, Traps Uncovered
📈 Breakouts Blessed by Fibonacci Spirits
🧠 Deep-dive TA with a twist of humor, mystery, and meme-lore
From the shadows of fake breakouts to the light of uptrend awakenings, our charts tell stories — and you are the hero. Whether you're a seasoned wizard or a humble apprentice, here you’ll find something rare:
Real analysis. Real magic. Real fun.
🎯 Targets that work. Levels that matter. A vibe you won’t forget.
👉 Follow now and let Miracle show you why:
@TradeWithMky – Where Altcoins Speak Louder Than Bitcoin!
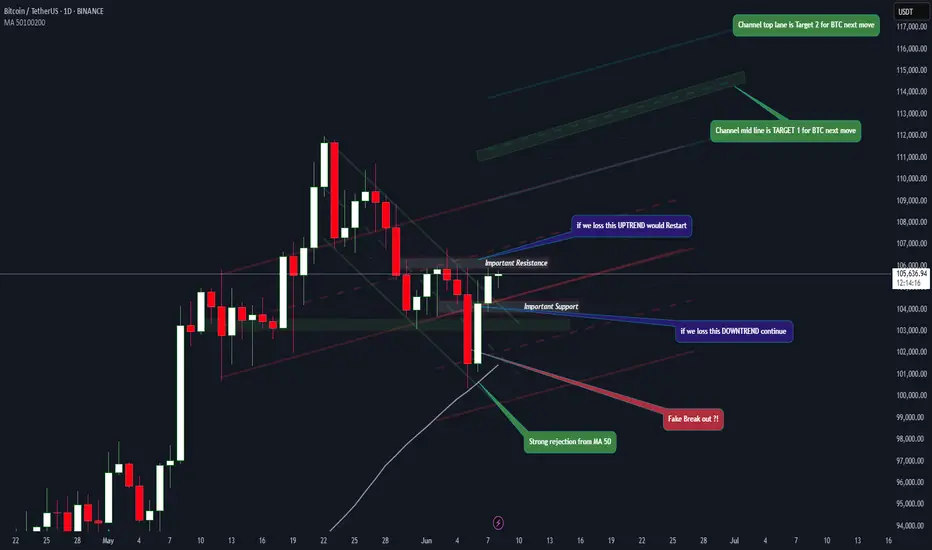
Bitcoin’s Reversal from Supports — Is the Correction Over? Bitcoin ( BINANCE:BTCUSDT ) moved as I expected in the previous idea , and it also reversed the decline I intended and started to rise from the Support zone($102,000-$107,120) , Support lines , and 50_SMA(Daily) .
Bitcoin is trading near the Resistance zone($104,380-$103,670) , Cumulative Short Liquidation Leverage($105,500-$105,265) , and Resistance lines .
In terms of Elliott Wave theory , it seems that Bitcoin has managed to complete the main wave Y . The main corrective structure was the Double Three Correction(WXY) . If the Resistance lines are broken , we can confirm the end of the main wave Y .
I expect Bitcoin to start rising after a re-correction from Cumulative Long Liquidations Leverage and reach the targets I have specified on the chart.
Cumulative Long Liquidation Leverage: $102,883-$102,181
Cumulative Long Liquidation Leverage: $101,318-$100,748
Note: If Bitcoin falls below $100,200(Worst Stop Loss(SL)), we should expect further declines.
Note: $105,500 is an important price for Bitcoin, and if Bitcoin can close the 4-hour candle above it, we can expect a break of the Heavy Resistance zone($104,380-$103,670)
Please respect each other's ideas and express them politely if you agree or disagree.
Bitcoin Analyze (BTCUSDT), 1-hour time frame.
Be sure to follow the updated ideas.
Do not forget to put a Stop loss for your positions (For every position you want to open).
Please follow your strategy and updates; this is just my Idea, and I will gladly see your ideas in this post.
Please do not forget the ✅' like '✅ button 🙏😊 & Share it with your friends; thanks, and Trade safe.

BTC/USD Short: Bearish Flag Targets $101,000Symbol: BTC/USD
Timeframe: 4H
Trade Type: Short
Entry Price: $105,700
Take-Profit: $101,000 (4.4% move, 22% with 5x leverage)
Stop-Loss: $106,500 (0.8% risk, 4% with 5x leverage)
R:R: 5.5:1
Leverage: 5x

BTCUSDT Analysis – Pivot 103k/106k, strategy and key zones__________________________________________________________________________________
Technical Overview – Summary Points
__________________________________________________________________________________
Momentum : Bullish structure on 1D/12H (MTFTI “Up”), but short-term consolidation (1H-2H “Down”). Momentum exhaustion observed.
Key Supports/Resistances : Resistances: 105287.8 / 106743.9 / 109952.8 / 111949. Supports: 103033.3 / 100333.3 / 93337.4. Repeated rejections below 105-106k, active testing of 103-100k supports.
Volume : Normal or slightly elevated on all timeframes. No capitulation or euphoric extremes detected.
Multi-TF Behaviour : Strong sector leadership (Risk On / Risk Off Indicator = “Strong Buy” across all frames; growth stocks > market). No behavioural anomalies on ISPD DIV. High-cycle consolidation below resistance.
__________________________________________________________________________________
Strategic Summary
__________________________________________________________________________________
Overall Bias : Neutral/bullish as long as 103k/100k holds. Bullish momentum intact, but short-term caution warranted.
Opportunities : Defensive buys/technical pullbacks above 103k; scalp/range trading 103-106k.
Risk Zones : Confirmed breakdown below 100k or acceleration in LTH distribution.
Macro Catalysts : Next FOMC June 17-18; no major short-term events identified (recent neutral macro, FOMC is key for swings).
Action Plan : Prioritize strict stops (≥3%) near pivots, consistent monitoring of behaviour/volume. Avoid overexposure pre-FOMC.
__________________________________________________________________________________
Multi-Timeframe Analysis
__________________________________________________________________________________
1D : Structuring range below 109952.8-111949 resistances. Bullish HTF trend, but momentum pausing. Average volume. Risk On / Risk Off Indicator “Strong Buy”. No extreme ISPD signals (neutral).
12H – 6H : Consolidation; supports holding, no euphoric confirmation (normal volumes, ISPD DIV neutral). Sector leadership unchanged.
4H : Compression below 105287.8. Moderate volume. Defensive resumption on supports. MTFTI bullish. Dynamic risk: monitor for sell-side capitulation.
2H – 1H : Technical correction, active retest of 105k (range 103-105k). Absorption volume. MTFTI “Down”.
30min – 15min : Short-term positive bias above 103k. Risk of false break if volume remains low. Risk On / Risk Off Indicator “Buy”/“Strong Buy”.
Cross-Indicators : Market leadership confirmed: Risk On / Risk Off Indicator = Strong Buy on all frames >15min. No excess behaviour or significant divergences detected. Key ranges: 103k-105k. On-chain: heavy LTH profit-taking but no panic.
Summary : BTC market in post-cycle-high congestion phase, structurally robust, but momentum recalibrating with fewer “easy trades.”
__________________________________________________________________________________
Cross insights & on-chain summary
__________________________________________________________________________________
On-chain (Glassnode) : Top at $111.8k, correction to $103.2k by LTH profit-taking. Spot accumulation on $103.7k/$95.6k. Upside limited unless fresh buying flows return.
Macro events : Awaiting FOMC; no recent surprises. Price action and levels dominate short-term strategy.
Stops/invalidation : Swing long defended at 103k/100k (stop <100k H4). Partial short/sell below 106743.9/109952.8. Dynamic targets: 106-109.9k; extension: 111.8k if breakout on volume.
__________________________________________________________________________________
Conclusion & Actionable Plan
__________________________________________________________________________________
Market condition:
- High consolidation, ranging below major resistances.
- Long-term bullish, short-term momentum fading.
- Neutral/bullish if 100-103k holds.
- “No macro — only levels” until FOMC or volatility catalyst.
Tactical decision:
- Trade technically, stops ≥3% under supports.
- Defended buys at 103k (stop <100k), partial profit 106-109k.
- Continuous monitoring of volume/on-chain zone reaction.
- Aggressive exit/hedge below support, target 96k/83k.
__________________________________________________________________________________
100% analysis based on TradingView multi-TF, Glassnode on-chain, macro calendar and risk management.
__________________________________________________________________________________

BTC TRrade Plan 08/06/2025Dear Traders,
📊 BTC/USDT 4H Analysis – June 8, 2025
Bitcoin is currently testing the upper boundary of a descending wedge pattern. We are monitoring two main bullish scenarios:
🔹 ALT 1: If the price breaks above the wedge resistance and holds, a continuation towards the $115,000–$120,000 zone is likely. This would confirm the breakout and a potential new bullish leg.
🔹 ALT 2: In case of a rejection from the current resistance, we expect a retracement toward the demand zone around $100,000–$101,600. If price action remains bullish in this zone, this could be a strong re-entry point for long positions.
🟥 Invalidation: A confirmed breakdown and consolidation below $100,000 would invalidate the bullish outlook and open the door to deeper corrections.
⚠️ Wait for confirmation and observe price action in key zones before entering any trades.
if you enjoyed this forecast, please show your support with a like and comment. Your feedback is what drives me to keep creating valuable content."
Regards,
Alireza!

BTC short scenario BTC will drop to 104.2k first, then maybe we'll see 103k if lucky. Range high range low rotation.

BITCOINBITCOIN ,the quick buy back at 100k level on demand floor faces a strong supply roof at 106k-105.98k level.
the rejection at 106k -105.98k level is backed by broken demand floor to act a supply roof .if buyers don't break this roof they could retest 100k again and break below will trigger 97k daily support zone .
on a flip side,a break and close followed by successful retest will be eyeing 113k-115k ascending supply roof based on the ascending trendline structure on daily.


BTC/USD DAILY MARKET OUTLOOK Price recently pulled back to $100k price level. Even though investors are still optimistic about BTC on longterm. We’re still having a price moving in a flag pattern which Indicate a possible fallback to $102k or $103k before investors will add more longs.

Bitcoin will continue to fall to support level in channelHello traders, I want share with you my opinion about Bitcoin. This chart shows how the price rebounded from the support line and started to grow. In a short time, it rose to the support level, which coincided with the buyer zone, and it even soon broke this level. Next, the price rose a little and then continued to move up, but later corrected the support line. After this, BTC rebounded and rose to the seller zone, breaking the 108800 resistance level. Then it rose a little more and turned around, and started to decline inside the downward channel. In the channel, price soon broke the 108800 level and continued to fall next. Later, Bitcoin broke the support line and fell almost to the support line of the channel, after which it turned around and made an upward movement. After this movement, Bitcoin dropped to the 100300 support level, after which it turned around and, in a short time, rose to almost the resistance line of the channel. Price didn't reach this line, turned around, and continued to fall in the channel. In my mind, Bitcoin can continue to move down top support level inside the downward channel. That's why my TP is 100300 level. Please share this idea with your friends and click Boost 🚀

BTC/USDT signal by tiqgptMARKET NARRATIVE: Analyzing the provided charts for Bitcoin against Tether (BTC/USDT) across multiple timeframes (1H, 15M, 5M, 1M), we observe a consistent narrative of price action that reveals the strategic maneuvers of institutional players. Starting with the 1H timeframe, the price displays a descending pattern, marked by a series of lower highs and lower lows, indicative of a dominant bearish market structure. This is further validated by the presence of descending mitigation blocks, which have been revisited but not significantly breached, suggesting a lack of buying interest at these levels.
Descending into the 15M and 5M charts, we see a more granular view of the bearish sentiment, with price action creating tight consolidation zones below previous mitigation blocks, signaling potential accumulation by smart money before further downward movement. The 1M chart offers the most detailed view, showing multiple liquidity sweeps below recent lows, which likely serve as inducements to trap retail traders into unfavorable positions before a potential expansion phase.
INSTITUTIONAL THESIS: The consistent bearish structure across all timeframes suggests that smart money is potentially targeting lower liquidity pools below the current price levels. The repeated liquidity sweeps and the formation of tight consolidation zones below mitigation blocks indicate a preparation phase for a further push downwards. This strategic positioning by institutional players aims to capitalize on induced retail selling pressure, allowing for accumulation at premium prices before a likely bearish continuation.


BTC Key Rejection or Breakout? Watch These Zones Closely!Hey fam! 👋 Here’s a clean 4H BTC setup with two key scenarios playing out – and both are packed with juicy liquidity zones and price action signals. Let’s break it down 👇
⚪ White Scenario (Bullish Bias):
1. BTC breaks above 107k – a strong breakout structure.
2. Expect a potential continuation move towards 109k, even eyeing the Premium Zone near 110k–111k if momentum holds.
3. Would confirm bullish intent and sweep weak highs.
🟡 Yellow Scenario (Bearish Bias):
1. BTC got rejected around 106k.
2. If it fails to reclaim 107k, expect a potential move back below 100k, especially if we see another CHoCH confirmation.
3. Watch for price to dive into the liquidity void near 98k, possibly deeper into the PMZ (Premium/Discount Equilibrium) zone.
4. Strong confluence at that Sell-side liquidity zone.
🧠 Key Market Structures:
1. Multiple CHoCHs and BOS visible – price is showing indecision.
2. Equal Highs (EQH) & Equal Lows (EQL) hint at liquidity grabs.
3. Liquidity Voids marked are critical for entries or exits.
📍No bias here, just trade the reaction.
Whether bulls or bears win this round, both scenarios offer clear entry/exit zones if you’re patient and follow structure. 📈📉
📢 Drop your thoughts in the comments – are you team breakout or breakdown?
Follow me for more BTC updates & analysis! 🚀🧠

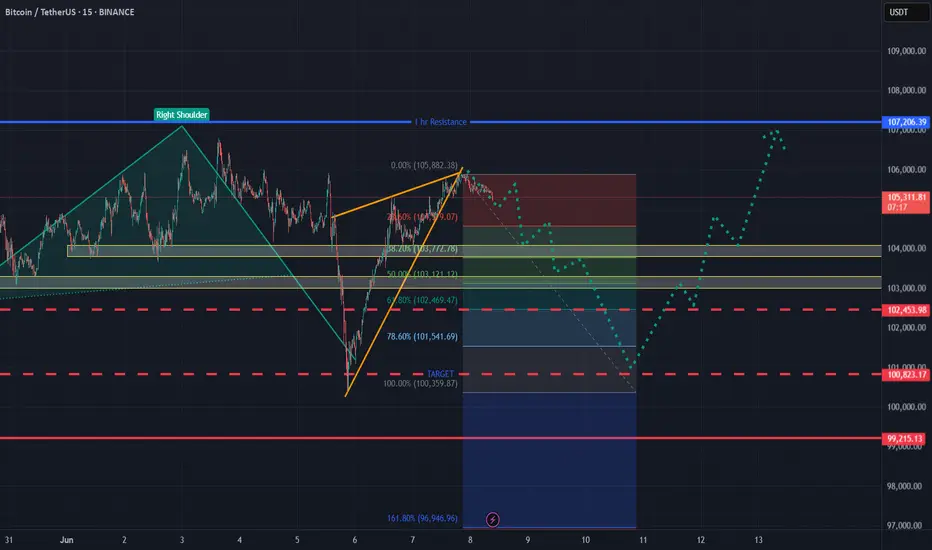
BTS Fibonacci tracing to identify the OTE zone from the lowest point to the highest point. We perceive the crossing of the red tenkan and the yellow kijun moving from the bottom that joins the cloud.

Short Signal – BTC Structural UpdateZemoG Trading Group Short Signal – BTC Structural Update
Bitcoin (BTC) reached the left shoulder wick at 105.8k, a key structural point we’ve been watching closely. This price action signals the market is preparing for its next decisive move — likely to complete the right shoulder of a developing head-and-shoulders pattern, a classic reversal structure rooted in market psychology.
As always with the ZemoG Strategy, we approach price from a structural and cyclical perspective, not just candlestick behavior. With BTC completing this setup, it further validates short momentum as we begin targeting lower levels.
With volume exiting the market, we’re now initiating a short bias, positioning for the next high-probability move.
🟥 Short Entry Trigger:
• A confirmed close below 105.8k on the 555-minute timeframe with structure continuation.
🎯 Short Targets:
• 104.6k – First liquidity pocket
• 104.2k – Support mirror from previous micro high
• 103.4k – Internal structure base
• 103.2k – Full shoulder completion zone
• 102k – Volume void level
• 101.4k – Deep liquidity sweep
• 100.3k – Main target and completion of right shoulder
🔒 Stop Loss:
• 106k – Just above structural invalidation; protects us from head-fake moves and liquidity traps.
We don’t chase price — we position ourselves for high-probability trades rooted in measurable structures, harmonic symmetry, and mirrored movements in time.
This unfolding move could be part of a larger cyclical rotation within BTC’s macro structure, which we’ve been tracking since the ATH at 111.97k. If the right shoulder completes and breaks down further, we may see momentum shift toward deeper retracement levels, opening the door to future setups with elevated reward potential.
Stay patient, focused, and aligned with the rhythm of the market.
ZemoG Trading Group – Sacred Structure. Timeless Precision.

BTC M15 distribution1. PS (Preliminary Support) –
highest volume
2. SC (Selling Climax) –
SC at lower volume and have a bull back
3. AR (Automatic Rally
after SC price is going up with a strong bull back
4. ST-B (Secondary Test in Phase B) –=
Waiting a Spring before crate a phase C

$BTC - LTF OutlookCRYPTOCAP:BTC | 2h
We got that push toward 105.8k retesting ltf immediate supply.
There's local demand around 104.2k–103.8k — if it holds, altcoins should run.
Otherwise, there's still a possibility we fill some imbalances below at 102k area

BTCUSD – Pressure is Building! WAE Squeeze Before the Storm?🔥 BTCUSD – Pressure is Building! WAE Squeeze Before the Storm?
Pair: BTC/USDT
Timeframe: 12H
Indicators: Waddah Attar Explosion + Trend Ribbon (Red/Green Zones)
📈 Market Snapshot:
Bitcoin has pulled back from the $112K region and is consolidating below the red resistance ribbon. But beneath the surface, the WAE histogram shows compression, signaling a potential breakout is on the horizon.
⚙️ Key Technical Signals:
✅ Trend Ribbon: Transitioned from red to flat — market is looking for direction.
📉 Volume Squeeze: WAE histogram is tightening under the yellow baseline, often the calm before major volatility.
🔵 Last Bullish Impulse: Price rallied strongly from $92K to $112K — this current zone could be a healthy bullish retracement.
📍 Support Levels:
$103,500 – short-term support
$100,000 psychological level
🚀 Breakout Level: $107,200 (clearance above red trend ribbon)
🎯 Strategy:
Wait for breakout confirmation of WAE (histogram bars break above yellow baseline with volume surge).
Entry zone: $106,000 – $107,500 (after confirmation)
Stop Loss: $102,800
TP1: $110,500
TP2: $114,800
TP3: $120,000+
💬 Caption:
Bitcoin is coiling... WAE shows compression.
Red zone acting as a lid, but smart traders know:
Pressure = Potential. 💣
Once the histogram bursts above the yellow line — it's time to move.
Are you ready for the breakout?

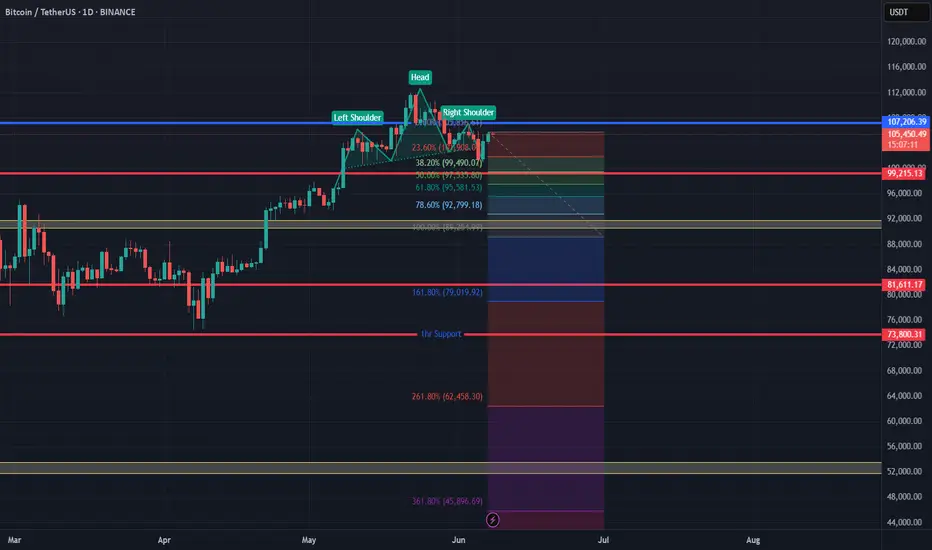
“Bitcoin Elliott Wave Breakdown – Watch This Before You Trade!”🔹 “This is Bitcoin on the 1-Month chart. What we see here is a completed 5-wave impulse according to Elliott Wave Theory.”
🔹 “Wave (1) through (5) is now complete, and the price has hit the upper boundary of a long-term ascending channel.”
🔹 “Notice this red zone? This is a strong resistance area between $76K and $111K. We might be forming a potential double top pattern here.”
🔹 “Divergence is likely forming in wave 5 — a classic sign of weakening momentum.”
🔹 “If we break below $66K and then $53K, expect a drop all the way to the $31K zone.”
🔹 “This level aligns with the bottom of the channel and possibly the 0.618 Fibonacci retracement.”
🔹 “Final target? $31,000 – a key zone for accumulation before the next major cycle.”

Bitcoin gonna dump to 97-95 zoneThis will be the leg down before 120k, which will fill the gap on monthly as well
