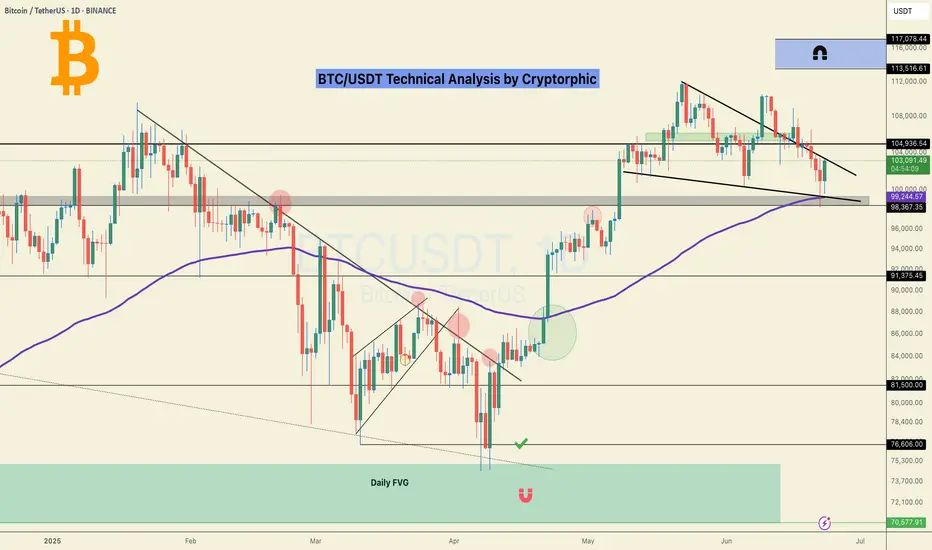
Bitcoin Pressing Up But This Compression Could Crack LowerBitcoin has been steadily climbing for months, respecting that long-term trendline since last year. Each dip into it brought a strong bounce, showing bulls are still in control of the bigger picture.
But right now price is pressing into a tight descending resistance line. We can see it making lower highs while struggling to break above that red trendline. At the same time, it’s sitting just above a key horizontal range, where buyers stepped in before.
This compression is risky . If BTC fails to push above the descending resistance and breaks back below the box, it could drop toward the next demand zone around the low 100K region .
As long as the major trendline from last year holds, the broader uptrend is intact . But losing this structure would open the door for a deeper correction.
This is the kind of spot where patience pays. Let the breakout or breakdown show its hand before jumping in heavy.
BTCUSDT.P trade ideas

Bitcoin, The Next High Is The All-Time HighThe title might be a bit misleading but, the truth is that Bitcoin stays bullish short-term and this is bullish on all terms...
Good afternoon my fellow Cryptocurrency trader, how are you feeling today?
Any day, any week, any moment; every month, place or year, the market provides everything we need to know. This information is made available to us through the chart.
Bullish Bitcoin
The present signal is the fact that Bitcoin remains very high, challenging resistance, after a strong recovery and advance. This is happening with the altcoins also.
If you look at the last two peaks, as soon as resistance was hit there was an immediate crash. The next day was full red; very strong bearish action and momentum and this led to a new low. The situation is not the same today.
22-May peak. 23-May, strong bearish action.
9-June peak. 11-June, strong bearish action.
26-June lower high (not a peak). Today, neutral action. This neutral action is what I am taking as a bullish signal. Many other factors of course support this conclusion yet, this is still an early signal.
Fib support
A closer view of the daily timeframe:
4H. The grey line represents Fib. retracement. Dark blue—Fib. extension:
Conclusion
Each time there is a price peak a retrace follows, if there is no retrace then you are not witnessing a peak but rather a stop, a pause; resistance being met.
It seems that the current lower high is not the end but rather just a pause before additional growth. Market conditions can change.
It can happen that several days Bitcoin goes sideways with the bulls failing to garner enough strength. In this scenario, there would be a move lower before additional growth.
The present scenario shows a bullish chart even if prices drop, remember, the market is in no hurry.
Easy money
In September we will have lower interest rates and this is a bullish development for Bitcoin. Advanced money minds see easy money as inflationary for the currency, while Bitcoin is inflation-proof. So the dollar goes down and Bitcoin goes up.
I didn't quite develop this point, next time I'll do a better job.
Summary
The market is good even if it shakes. The market is good and isn't shaking, the recovery is already in place.
Bitcoin's price is very strong and there are many layers of support. The altcoins are in a similar situation, growing from the bottom up.
The Fed will reduce interest rates in September and then once more before the year ends, this is bullish for everything so, everything will be going up, at least everything that we are interested in, support and trade.
Thanks a lot for your continued support.
Never give up!
You are divine! You are blessed.
If you are reading this now, you will be blessed for your great timing. Hard work and dedication always pays.
Keep moving forward, keep pushing forward, never give up.
When life hits you hard, do take a break if you need it, only to comeback with new energy, a new mind and an infinite drive to achieve your goals.
You are the reason why Bitcoin exist... You are the lifeblood of the market.
Without you, nothing is possible. It is because of you that we all continue to grow.
Thanks again for taking the time to read.
I appreciate your support.
Namaste.

Bitcoin sell short inter:115000Bitcoin needs to reach the 114,000-115,000 range and a daily time frame divergence and drop to the 84,000-50,000 range.

BTC Is Replaying a Bullish Fractal >>> Are You Watching?Hello guys!
I see a deja vu here! Let’s look at the historical daily chart (Jan–May 2025):
What happened?
Initial Drop (Yellow Oval): Bitcoin approached a key S&D zone but didn't touch it, triggering a short-lived bounce before dropping again.
Second Drop (Red Ovals): This time, price precisely touched the demand zone, triggering a clean bullish reversal.
What followed was a strong trend breakout, sustained higher lows, and an eventual surge past prior resistance levels.
Current 4H Chart Setup: A Mirror Image?
Yellow Highlight: Once again, we saw a bounce that didn't quite touch the key demand zone ($98K–$100K).
Red Zone Prediction: If this mirrors the historical move, the price is likely to return and touch this S&D area before launching a bullish leg.
Blue Path Projection: A sharp reversal is expected post-touch, aiming toward $111K–$113K as the next key resistance zone.
The descending trendline adds confluence
___________________
History Doesn’t Repeat, But It Often Rhymes
Based on this fractal analysis, Bitcoin is likely forming the same bullish base seen earlier in 2025. The setup hinges on one key event: a return to the $99K–$100K zone, where demand is likely to step in aggressively.
If the pattern repeats, the current market may offer one last high-reward long opportunity before a parabolic rally.

#BTC Update. Here's the trigger point.CRYPTOCAP:BTC Update:
Bitcoin is trading around the key $108K resistance, one of the most crucial levels for bulls to break.
A strong close above this zone could spark a rally toward $ 117,000. However, if rejected, we might see a pullback to $ 103,000.
I’m not touching futures just yet.
I’m okay with missing a few green days; I’d rather wait for clear momentum than get caught in this choppy price action.
Let me know what you think in the comments.
Thank you
#PEACE

PRICE SPECULATION ON BTCUSD!Price updates from the H1 timeframe . Price is likely to drop from the current high after we saw a distribution stage currently forming, therefore, a sell opportunity is envisaged.

Bitcoin Long Setup: Two Potential Entry Zones After The DropHello, traders! As predicted, Bitcoin is perfectly following Scenario #2 from my previous analysis.
📉 What Happened?
The instrument showed a fake rally, luring impatient traders into premature long positions, only to liquidate them with a sharp downward move. The primary Point of Interest (POI) remains below us — this is where the "whale" aims to deliver the price to fill their orders and close the shorts they used for the initial SSL manipulation.
My Trading Scenarios & Entry Plan
1️⃣ Scenario 1: Mitigation of the Primary POI
My expectation remains the same: a reaction upon the mitigation of the 4h order block , which aligns with the 78.6% Fibonacci level.
Entry Condition: The level must hold on at least the 4H timeframe, confirmed by a bullish reversal and an order flow shift on the Lower Timeframe (LTF).
Zone: $102,745 - $103,868
Invalidation: A clear break and close below the 78.6% Fib level would invalidate this scenario.
2️⃣ Scenario 2: Deeper Liquidity Grab
If the liquidity at the 4h OB isn't enough for the whale to continue the uptrend, they might trigger a more aggressive decline to grab liquidity from the low at $100,370.
Entry Condition: A swift sweep of this low, followed by a sharp reclaim of the level and the beginning of a bullish order flow on the LTF.
Zone: $100,700 - $102,000
Invalidation: A candle close below the $100,370 liquidity level would invalidate this scenario.
Final Thoughts
Do not open positions just because the price has reached a POI. Wait for a clear reversal reaction and LTF confirmation for more conservative and safer entries. Always use stop-losses to protect your capital; no setup has a 100% win rate, and for every whale, there can always be a bigger one.
To be consistently profitable, you just need to find setups with a win rate greater than 50% — this is how casinos and professional traders operate.
Happy hunting with the whales — don't be the plankton. Follow their tracks.

Next Volatility Period: Around July 2nd
Hello, traders.
If you "Follow", you can always get the latest information quickly.
Have a nice day today.
-------------------------------------
(BTCUSDT 1D chart)
The key is whether it can rise above 108316.90 and find support.
When OBV rises above the High Line, we need to check if the PVT-MACD oscillator switches to above the 0 point.
However, since the StochRSI indicator is currently showing signs of entering the overbought zone, I think there is a high possibility of resistance.
We need to check for support in the 108316.90-111696.21 zone, which is the high point boundary zone.
- If OBV fails to rise above the High Line,
- If the PVT-MACD oscillator fails to remain above the 0 point,
- If the StochRSI indicator falls from the overbought zone and switches to a state where K<D,
It is highly likely that it will eventually encounter resistance in the high point boundary zone and fall.
Therefore, what we need to do is to check for support near 108361.90-108353.0.
If it rises after that, we need to check for support near 111696.21.
Entering a new purchase in the high point boundary section is a very risky transaction.
Therefore, a short and quick response is required when making a purchase.
The basic trading strategy is to buy near the HA-Low indicator and sell near the HA-High indicator.
Do not forget this.
However, since the HA-Low or HA-High indicators are intermediate values, they may move in the opposite direction.
In other words, there is a possibility that the HA-Low indicator will receive resistance and fall, showing a stepwise downtrend, and the HA-High indicator will receive support and rise, showing a stepwise uptrend.
Therefore, you must check whether there is support in the low point boundary section of the DOM(-60) ~ HA-Low section or the high point boundary section of the HA-High ~ DOM(60) section.
To do this, you must trade in a split transaction method.
-
The next volatility period is expected to start around July 2 (July 1-3).
The reason why we calculate the volatility period is because it can be a turning point of the trend.
Therefore, making a new trade during the volatility period means that there is a high possibility of being caught in a fake.
-
Thank you for reading to the end.
I hope you have a successful trade.
--------------------------------------------------
- Here is an explanation of the big picture.
(3-year bull market, 1-year bear market pattern)
I will explain the details again when the bear market starts.
------------------------------------------------------

StochRSI indicator and support and resistance levels
Hello, traders.
If you "follow" me, you can always get the latest information quickly.
Have a nice day today.
-------------------------------------
The StochRSI indicator on the left chart is slightly different from the StochRSI indicator on the right.
The StochRSI indicator on the left chart is the StochRSI indicator provided by default in TradingView, and the StochRSI indicator on the right chart is an indicator with a modified formula.
The StochRSI indicator is a leading indicator that is reflected almost in real time.
Therefore, it reacts sensitively to price changes.
Although it is advantageous because it reacts sensitively, it also increases the possibility of being caught in a fake, so I thought that a slight delay(?) was necessary, and so I created the StochRSI indicator on the left chart.
If you look at the relationship between the K and D of the StochRSI indicators on the two charts, you can see that there is a big difference.
In the end, you can predict the movement by checking whether the movement of the K line has escaped the overbought or oversold section.
However, I think that you will receive information that can determine the sustainability of the trend depending on the positional relationship between K and D.
Therefore, it is important to distinguish the inflection points that occur in the StochRSI indicator.
This is because these inflection points provide important information for drawing trend lines.
Therefore, the StochRSI indicator on the left chart, which better expresses the inflection point, is being used to draw the trend line.
(Unfortunately, this indicator was not registered on TradingView because I did not explain it well.)
-
As a new candle was created, the StochRSI indicator on the left chart is showing an inflection point on the K line.
The StochRSI indicator on the right chart is showing a transition to a state where K < D.
We will have to check whether the inflection point was created only when today's candle closes, but I think that the fact that it is showing this pattern means that there is a high possibility of a change in the future trend.
Since the next volatility period is expected to start around July 2nd (July 1st-3rd), I think it has started to show meaningful movements.
-
It is true that you want to buy at the lowest price possible and sell at the highest price.
However, because of this greed, one mistake can lead to a loss that can overturn nine victories, so you should always be careful.
Therefore, if possible, it is better to check for support and respond.
In that sense, I think it is worth referring to the relationship between K and D of the StochRSI indicator on the left chart.
This is because the actual downtrend is likely to start when K < D.
-
In order to check for support, you definitely need support and resistance points drawn on the 1M, 1W, and 1D charts.
Ignoring this and checking for support at the drawn support and resistance points can result in not being able to apply the chart you drew to actual trading.
Therefore, you should draw support and resistance points first before starting a trade.
Otherwise, if you draw support and resistance points after starting a trade, you are more likely to set support and resistance points that reflect your subjective thoughts, so as I mentioned earlier, you are more likely to lose faith in the chart you drew.
If this phenomenon continues, it will eventually lead to leaving the investment market.
-
It is important to determine whether there is support by checking the correlation between the StochRSI indicator and other indicators at the support and resistance points drawn on the 1M, 1W, and 1D charts.
Even if the inflection point of the StochRSI indicator or other indicators occurs at a point other than the support and resistance points you drew, you should consider it as something that occurred beyond your ability to handle.
In other words, you should observe the price movement but not actually trade.
As I mentioned earlier, if you start to violate this, you will become less and less able to trust the chart you drew.
-
Accordingly, the basic trading strategy I suggest is to buy near the HA-Low indicator and sell near the HA-High indicator.
However, since the HA-Low and HA-High indicators are expressed as average values, they may move in the opposite direction to the basic trading strategy.
In other words, if the HA-Low indicator is resisted and falls, there is a possibility of a stepwise downward trend, and if the HA-High indicator is supported and rises, there is a possibility of a stepwise upward trend.
Therefore, the basic trading strategy mentioned above can be considered a trading strategy in the box section.
In the case of deviating from this box section, it is highly likely to occur before and after the volatility period indicated by the relationship between the trend line using the StochRSI indicator mentioned above and the support and resistance points drawn on the 1M, 1W, and 1D charts.
Therefore, special care is required when conducting new transactions during the volatility period.
This is because there is a high possibility of being caught in a fake when trading during the volatility period.
-
The DOM(60) and DOM(-60) indicators are good indicators to look at together with the HA-Low and HA-High indicators.
The DOM indicator is an indicator that comprehensively evaluates the DMI, OBV, and MOMENTUM indicators.
Therefore, the DOM(60) indicator is likely to be at the end of the high point range, and the DOM(060) indicator is likely to be at the end of the low point range.
In the explanation of the HA-Low and HA-High indicators,
- I said that if the HA-Low indicator receives resistance and falls, there is a possibility that a stepwise downtrend will begin,
- and if the HA-High indicator receives support and rises, there is a possibility that a stepwise uptrend will begin.
In order for an actual stepwise downtrend to begin, the price must fall below DOM(-60), and in order for a stepwise uptrend to begin, it must rise above DOM(60).
In other words, the DOM(-60) ~ HA-Low section and the HA-High ~ DOM(60) section can be seen as support and resistance sections.
-
If these correlations start to appear, I think you will be able to create a trading strategy that fits your investment style without being swayed by price volatility and proceed with trading.
The reason for analyzing charts is to trade.
Therefore, the shorter the time for chart analysis, the better, and you should increase the start of creating a trading strategy.
-
Thank you for reading to the end.
I hope you have a successful trade.
--------------------------------------------------

BTC Analysis (4H)This analysis is an update of the analysis you see in the "Related publications" section
Since the red arrow was placed on the chart, Bitcoin's bullish phase has ended and it has entered a corrective phase. This correction appears to be forming a Diametric pattern, and we are currently in the middle of wave E.
After interacting with the demand zone, the price may move toward the specified targets.
A daily candle closing below the invalidation level will invalidate this analysis.
For risk management, please don't forget stop loss and capital management
Comment if you have any questions
Thank You

BTC at Decision Point: Symmetrical Triangle Breakout Incoming ??BTC is now trading within a symmetrical triangle, bouncing strongly from the trendline support at $98,898, and now faces overhead resistance of around $106,000.
Price is moving between higher lows and lower highs; a breakout in either direction could trigger a significant move.
Key Levels:
Support Zones:
$101,409 – Near-term support
$98,898 – Strong ascending trendline support
$93,343 – Critical structure base
Resistance Zones:
$105,807 – Immediate ceiling
$106,057 – Triangle breakout point
$108,895 – First major upside target
$111,785 – Higher target if bulls take control
Analysis:
The structure shows clear compression, and BTC has already made a sharp bounce off the lower range, suggesting bulls are stepping in. However, a clean breakout above $106K is needed to confirm the momentum shift.
A breakout above this triangle could lead to a fast move toward $111K, while failure could send the price back toward $101K or even lower.
This is a make-or-break zone.
DYOR | Not Financial Advice

Bitcoin Bullish But... Support Zones (Incl. Altcoins)Bitcoin is bullish right now but we know things can change. As long as the action is happening within the blue and gray space, all is good, the bullish bias remains intact. If the action moves below the gray zone and enters the orange zone, this is the danger zone. This danger zone can turn into a buy opportunity or a wait and see approach.
On the other hand, if Bitcoin remains above the blue zone this is ultra-bullish short-term. This is specially bullish for the altcoins but it is bullish for Bitcoin as it reveals consolidation at high prices, but right now we have a lower high so anything goes.
The chart is mixed when looked at up-close. Bullish long-term and on all bigger timeframes. Corrections tend to develop from high prices.
One more thing to consider
When we look at the action short-term we can miss the bigger picture, we can become clouded with noise. The bigger range is $100,000 - $110,000, this is the new long-term support zone that is being established and created before additional growth. Bitcoin can remain here for weeks or even months, if this happens, the altcoins will continue to grow.
We are in a bull market. Bitcoin is obviously in a bull market as it is trading near its all-time high after years of growth. The altcoins are just getting started after years of sideways action... Some altcoins hit new all-time lows but still part of a broad, long-term consolidation phase. Many produced higher lows, some produced lower lows, it makes no difference.
The bear market ended in mid/late 2022 and the ensuing two years we had mix growth. Bullish waves and bearish waves, with the usual variations of course.
The year is now 2025 and Bitcoin is up, most of the big projects have been growing for years now and we are getting close to the final advance, the major fifth wave and the bull market bull run. When this happens, close to its end, all the smaller projects will produce the biggest growth in their history and this will be the boom that will catapult Crypto to take over the financial world.
It won't be the first time this event happens nor the last, the market will continue to fluctuate.
I know there is a lot of information out there and we can become uncertain with every drop, but look at the price; what do you see? Bitcoin is going up.
The altcoins are set to follow, the altcoins do what Bitcoin does.
Namaste.

Good moment for try to Buy BTCGood moment for try to Buy BTC. Very good down movement and now we make small step of the up. This point can be point for start to move new up trend with update local highest high. Stop to previous local low bar. Will see...

BITCOIN PREDICTION THAT WILL MAKE BULLS CRYI am sharing with you exclusive insights that I am seeing on MARKETSCOM:BITCOIN right now.
WARNING: If you are a bull, you might start crying hysterically while watching this video.

Analyzing the new month, new week, new day
Hello, traders.
If you "follow", you can always get the latest information quickly.
Have a nice day today.
-------------------------------------
(BTCUSDT 1M chart)
A new month begins in one day.
The key is whether it can hold the price by rising above 109588.0.
If not, there is a possibility that it will fall below the 94172.00 StochRSI 50 indicator point that the arrow is pointing to.
We need to see if it can rise with support near the Fibonacci ratio of 1.618 (89050.0).
Since the current low-point trend line is not complete, it is not surprising that it can show a downward trend at any time.
However, if it rises above 109588.0 and maintains the price, it is expected that there will be an attempt to rise near the Fibonacci ratio of 2.618 (133889.92).
I think it is likely to be the last target of the target bull market in 2025.
-
(1W chart)
It is a period of volatility around the week including June 23.
That is, from June 16 to July 6 is the volatility period.
The key is whether it can rise to the right Fibonacci ratio 2.24 (116940.43) during this volatility period.
Even if it fails to rise, if the price maintains above 104463.99, it is expected to show an upward trend around the next volatility period.
The next volatility period on the 1W chart is expected to be around the week of August 18.
-
When it falls below 104463.99, we need to check whether the HA-High indicator is newly generated.
If not, it is important to check whether there is support around the current HA-High indicator point of 99705.62.
Since the M-Signal indicator on the 1W chart is passing around 99705.62, its importance can be said to be high.
If it falls below the M-Signal indicator of the 1W chart, it is expected to determine the trend again when it meets the M-Signal indicator of the 1M chart.
-
(1D chart)
The key is whether it can maintain the price by rising above the HA-High indicator point of 108316.90 on the 1D chart.
If it fails to rise,
1st: 104463.99
2nd: 99705.62
You should check for support near the 1st and 2nd above.
If it falls below the M-Signal indicator of the 1W chart,
1st: 89294.25
2nd: M-Signal of the 1M chart
There is a possibility that it will fall near the 1st and 2nd above.
-----------------------------------------
(1W chart)
The chart above is a trend line chart drawn on the 1W chart.
It looks complicated, but what's important to look at is the correlation between the high-point trend line and the low-point trend line.
That is, even if the price rises above 109.588.0, if it doesn't rise above the high-point trend line, it is likely to fall near the low-point trend line.
Fortunately, since it is forming an upward channel, it is expected that the price will eventually rise even if it falls.
-
(1D chart)
Unlike the trend line on the 1W chart, the high-point trend line on the 1D chart forms a downward trend line.
Accordingly, the period around July 7, when the low-point trend line and the high-point trend line intersect, can be considered an important period of volatility.
However, the volatility period starts around July 2nd and is expected to end around July 10th.
----------------------------------------------
As shown above, many lines were drawn to analyze the chart.
I have roughly explained which of the lines drawn in this way should be prioritized.
Since chart analysis is for creating a trading strategy, the support and resistance points drawn on the 1M, 1W, and 1D charts are ultimately the most important.
Therefore, it is most important to check how the support and resistance points were created and find the reason for them.
Other analyses are only additional elements.
As I always say, chart analysis that does not show support and resistance points is only an analysis chart that can be used for trading.
You cannot trade with such analysis charts.
Also, if support and resistance points are shown, you should check the basis for setting the support and resistance points.
In order to serve as a support and resistance point, there must be a basis.
When you cannot confirm the basis for the support and resistance point, it is important to ask questions and find out the basis.
Fibonacci ratios are not suitable for actual trading.
However, when the ATH or ATL is updated, it is valuable enough for analysis.
Other than that, there must be support and resistance points drawn on the 1M, 1W, and 1D charts.
-
Thank you for reading to the end.
I hope you have a successful trade.
--------------------------------------------------
- This is an explanation of the big picture.
(3-year bull market, 1-year bear market pattern)
I will explain more details when the bear market starts.
------------------------------------------------------

BITCOIN PRICEACTION TRADING STRATEGIESBitcoin’s price is influenced by macroeconomic factors, including U.S. inflation trends and institutional adoption (e.g., Bitcoin ETFs with $138B in assets). Its volatility remains high, with 10% daily moves possible, driven by 24/7 trading and sentiment shifts. Recent recovery from a dip below $102,000 was tied to geopolitical tensions, but macro signals suggest a risk-on environment supporting further gains.
Outlook: Bitcoin is at a critical juncture, with technical indicators leaning bullish but resistance at $108,000 posing a challenge. A decisive breakout above $108,950 could signal a move toward $111,000-$115,000, failure to hold this level will retest 100k$ level or below.and below 100k could turn bearish .

#BTC Bounced, 100EMA saved the day!100 EMA saved the day.
But the one concern? We’ve printed a new Lower Low, not a great sign.
The chart looks bouncy, but the overall structure still feels uncertain.
No point guessing or forcing trades here, I’d rather wait for clear confirmation.
I’ll share updates if I spot any changes or interesting altcoin setups.
For now, patience is our best edge. I know many altcoins might look great, but BTC Dominance is not yet done. I'll be sharing that chart tomorrow.
Stay sharp.
Hit that like button if you find this short update useful.
Thank you
#PEACE
Bitcoin at Risk: Will Geopolitical Tensions Push BTC Below $90K?By analyzing the #Bitcoin chart on the weekly timeframe, we can see that the price continued its correction amid rising tensions and conflict between Iran and Israel, dropping to as low as $98,000. Currently, Bitcoin is trading around $101,000, and if these tensions escalate further — especially if Iran decides to close the Strait of Hormuz — it could significantly impact global markets, and Bitcoin would not be an exception.
If BTC fails to hold above $100,000 by the end of the week, a continuation of the drop toward $90,000 is possible.
Please support me with your likes and comments to motivate me to share more analysis with you and share your opinion about the possible trend of this chart with me !
Best Regards , Arman Shaban

BTC/USDT Trade Setup – Lord MEDZStrategy: Goldbach Fair Value Gap + Smart Money Concepts (SMC)
Timeframe: 6H
Bias: Long
Trade Parameters
Entry: 102,577
Stop Loss: 99,527
Take Profit: 118,153
Risk to Reward: Approximately 5:1
Confluences and Justification
Price is expected to retrace into a clear Fair Value Gap (FVG) formed after displacement, aligning with the Goldbach model.
The structure confirms a completed reaccumulation phase, presenting a high-probability long setup.
This would complete the right shoulder of the classic inverse head and shoulders pattern, with the shoulder projected to dip into the POI. Head and shoulders patterns are often manifestations of Wyckoff accumulation or distribution phases, for those who may not be aware.
Liquidity left inside the gap provides inducement, increasing the likelihood of a sweep into the 102.5K zone.
The take-profit target at 118,153 aligns with the high of the Goldbach Fibonacci extension level.
Execution Plan
Wait for price to return to the FVG zone around 102,577. Look for confirmation such as a bullish displacement candle, a lower time frame BOS (break of structure), or mitigation of a lower time frame order block. Upon confirmation, execute long with a stop below 99,527. Take profit is set at 118,153.
Final Note from Lord MEDZ
"I await the return of price to imbalance. The reaccumulation is complete, and the alignment is clear. Entry shall be taken where inefficiency remains, and profit shall be claimed where liquidity awaits."

Skeptic | RSI Masterclass: Unlock Pro-Level Trading Secrets!Hey traders, it’s Skeptic ! 😎 Ready to transform your trading? 95% of you are using the Relative Strength Index wrong , and I’m here to fix that with a game-changing strategy I’ve backtested across 200+ trades. This isn’t a generic RSI tutorial—it’s packed with real-world setups, myth-busting insights, and precise rules to trade with confidence. Join me to master the art of RSI and trade with clarity, discipline, and reason. Big shoutout to TradingView for this epic free tool! 🙌 Let’s dive in! 🚖
What Is RSI? The Core Breakdown
The Relative Strength Index (RSI) , crafted by Welles Wilder, is a momentum oscillator that measures a market’s strength by comparing average gains to average losses over a set period. Here’s the formula:
G = average gains over n periods, L = average losses.
Relative Strength (RS) = | G / L |.
RSI = 100 - (100 / (1 + RS)).
Wilder used a 14-period lookback , and I stick with it—it’s smooth, filters noise, and gives a crystal-clear read on buyer or seller momentum. Let’s get to the good stuff—how I use RSI to stack profits! 📊
My RSI Strategy: Flipping the Script
Forget what you’ve read in books like The Handbook of Technical Analysis by Mark Andrew Lim— overbought (70) and oversold (30) aren’t just for shorting or buying. I go long when RSI hits overbought, and it’s been a goldmine. I’ve backtested over 200 trades with this approach, and it’s my go-to confirmation for daily setups. Why does it work? When RSI hits overbought on my 15-minute entry chart, it signals explosive buyer momentum. Here’s what you get:
Lightning-Fast R/R: I hit risk/reward targets in 30 minutes to 2 hours on 15-minute entries (longer for 1-hour entries, depending on your timeframe).
Massive R/R Potential: An overbought RSI on 15-minute can push 1-hour and 4-hour RSI into overbought, driving bigger moves. I hold for R/Rs of 5 or even 10, not bailing early. 🚀
Rock-Solid Confirmation: RSI confirms my entry trigger. Take BTC/USD:
BTC bounces off a key support at 76,000, sparking an uptrend.
It forms a 4-hour box range, but price tests the ceiling more than the floor, hinting at a breakout.
Trigger: Break above the box ceiling at 85,853.57.
On 15-minute, a powerful candle breaks the ceiling, and RSI hits overbought—that’s my green light. I open a long.
Soon, 1-hour and 4-hour RSI go overbought, signaling stronger momentum. I hold, and BTC pumps hard, hitting high R/R in a short window.
This keeps trades fast and efficient—quick wins or quick stops mean better capital management and less stress. Slow trades? They’re a mental grind, pushing you to close early for tiny R/Rs. 😴
Pro Rules for RSI Success
Here’s how to wield RSI like a trading weapon:
Stick to the Trend : Use RSI in the direction of the main trend (e.g., uptrend = focus on longs).
Confirmation Only: Never use RSI solo for buy/sell signals. Pair it with breakouts or support/resistance triggers.
Fresh Momentum: RSI is strongest when it just hits overbought/oversold. If the move’s already rolling, skip it—no FOMO, walk away!
Customize Zones: Overbought (70) and oversold (30) can shift—it might show reactions at 65 or 75. Adjust to your market’s behavior.
Backtesting RSI: Your Path to Mastery
To make RSI yours, backtest it across at least 30 trades in every market cycle— uptrend, downtrend, and range. Test in volatile markets for extra edge. 😏 Key takeaways:
Range Markets Kill RSI: Momentum oscillators like RSI (or SMA) are useless in ranges—no momentum, no signal. Switch to ROC (Rate of Change) for ranges—I use it, and it’s a beast. Want an ROC guide? Hit the comments!
Overextended RSI Zones: On your entry timeframe (e.g., 15-minute), check higher timeframes (e.g., 4-hour) for past RSI highs/lows. These are overextended zones—price often rejects or triggers a range. Use them to take profits.
Final Vibe Check
This RSI masterclass is your key to trading like a pro—fast R/Rs, big wins, and unshakable confidence . At Skeptic Lab, we live by No FOMO, no hype, just reason. Guard your capital— max 1% risk per trade, no excuses. Want an ROC masterclass or more tools? Drop a comment! If this fired you up, smash that boost—it means everything! 😊 Got a setup or question? Hit me in the comments. Stay sharp, fam! ✌️

Once again a perfect time to enter a short
As we are closing in to key resistance area we can see that we are getting a lot of smaller bodied 4H candlesticks. This is indicating a weak buy side and that we are looking to top out!
We also got overbought on the hourly RSI and the MACD has flipped bearish
Combining a crocodile tooth shaped formation taking form on the 15min, a rejection from the downward sloping trend line (third rejection indicates strong trend line) and that we are looking to reverse at key resistance. I entered a 100x short at 106375.
As I am writing we also got in another confirmation on the hourly timeframe. As we can see we got a nice bearish engulfing candlestick.
I think the chart speak for itself. We are about to go down big time!

BITCOINBITCOIN wait on the close of daily candle for clear directional bias ,break and close 108k will expose 111-115 and more higher zones .break below by rejection on daily candle will call for sell and target will be around 100-94k zone .
trading is 100% probability, some people are gifted while some are not.

BTCUSDT Analysis – Bullish Focus Amid ConsolidationBTCUSDT Analysis – Bullish Focus Amid Consolidation
Bitcoin is currently mirroring the broader market sentiment, particularly tracking the S&P 500. After a false breakout above the psychological 100K level, BTC entered a distribution phase, followed by a consolidation range. This indicates a potential accumulation before a bullish continuation, although resistance levels remain key hurdles.
False Breakout at 100K: A failed breakout attempt triggered a sharp reversal, signalling short-term weakness. Price rolled back and found temporary support around 106,200, pausing further downside The pair is consolidating within a tight range, indicating a possible setup for a renewed bullish push.
Outlook: Despite the resistance cascade, BTC remains in a bullish structural zone as long as it holds above 106,000. A clean breakout above 108,500–110,000 could open the path back toward 114,000–117,000. However, failure to break may result in a deeper pullback towards 104,000–102,500.
Ps Support with like and comments for more analysis Thanks for supporting.
