Bitcoin Short-Term 4H Timeframe, Still Bullish But...Bitcoin continues bullish on the 4H timeframe and we have some positive signals coming out of the most recent swing and shakeout.
» The action went below 0.618 but is back above this level.
» The higher low did not reach 0.786 Fib. retracement support, which is a signal of strength.
» Trading volume continues to rise and as the action happens above $100,000, this signal works in favor of the bulls.
Short-term, Bitcoin continues green with the bulls in full control of the chart. When in doubt, zoom out; Crypto is going up.
This is obviously a consolidation pattern because we have higher lows but also lower highs. The revealing signal of course comes from the altcoins, look at Bitcoin Cash and you can get a good example.
The market will resolve bullish once the consolidation ends.
I say this based on market data and the charts.
If you agree leave a comment.
Thank you for reading.
Namaste.
BTCUSDT.P trade ideas

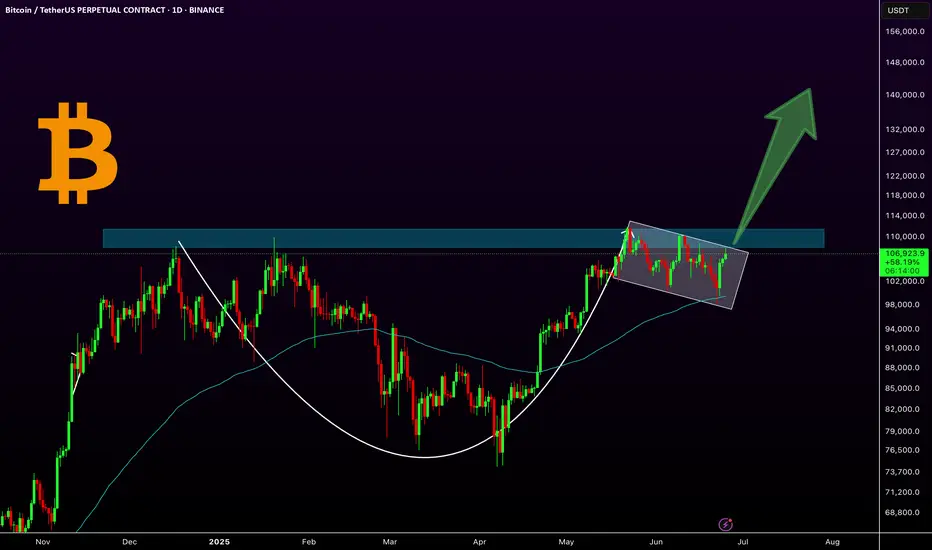
BTC is breaking out of a falling channel 🚀
Bitcoin has pushed strongly off the lower boundary and is approaching the top of a descending parallel channel on the daily chart 📈
A confirmed breakout could lead to a continuation rally toward key upside targets ✈️
🎯 Targets:
1️⃣ $111,233.01
2️⃣ $114,942.31
3️⃣ $118,490.33

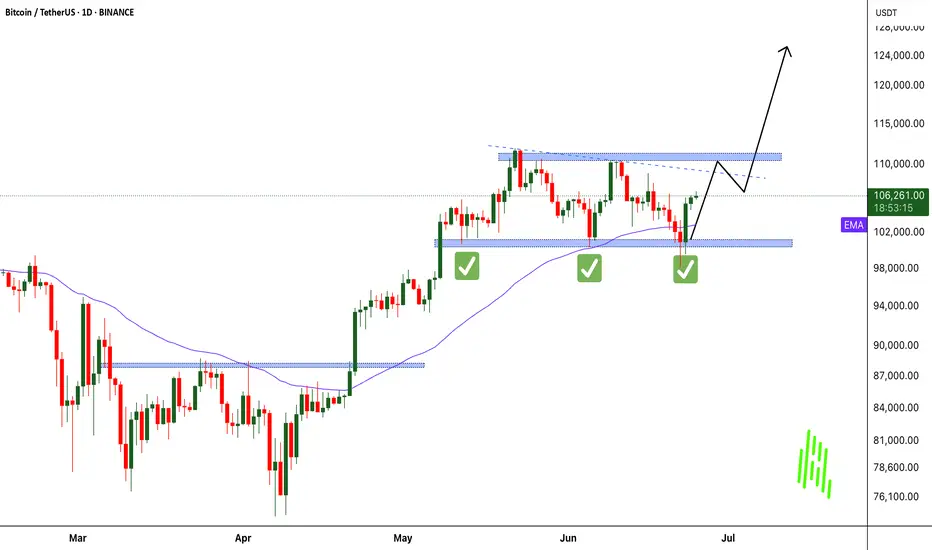
Bitcoin Mid-Term, 4H Timeframe, Bullish ($119,165 Next Target)On the 4H timeframe we have a consolidation pattern with a bullish bias. Bitcoin is aiming higher after a close above EMA8 & 13 with higher lows.
The drop 13-June found support perfectly at 0.786 Fib. retracement on a wick. The session closed above 0.618. The action turned bullish immediately and we are seeing slow but steady growth.
The recent drop was a market reaction due to a geopolitical situation. As soon as the event is priced in, the market seeks balance and goes back to its previous trend.
Bitcoin's bullish bias is not only supported by strong prices, $105,600 is very strong, but also by the altcoins and the cyclical nature of the market.
While Bitcoin already produced several new all-time highs this year the altcoins are yet to do the same. A bull market happens every four years or the year after the halving. For Bitcoin this is already true but this is a marketwide event and the altcoins are yet to go there and this is a bullish factor and soon this will be obvious on the chart.
We are 5-6 days away only from very strong bullish action. Notice that this isn't a long time, it is less than a week. The altcoins will reveal this bullish bias much sooner than Bitcoin but Bitcoin will also grow and hit a new all-time high soon. This new all-time high will be the catalyst for everything to boom.
» Ignore the short-term it is all noise—crypto is going up.
The next target is $107,558, followed by $109,508 on this timeframe. The latter being a mild resistance.
The main target here is $119,165 and this is a good resistance zone. It can be rounded up to $120,000. If this level gets hit it will only confirm additional growth. The target that follows is $130,000 and the minimum for this cycle is $160,000 but we are aiming higher.
Feel free to follow for more.
I will continue to detail Bitcoin on all the timeframes as well as many of the top, mid- and small altcoins.
Thank you for your support.
It is appreciated.
Namaste.

Today's BTC trading strategy, I hope it will be helpful to youBitcoin is currently fluctuating around $105,500, rebounding 4.5% from yesterday's low of $101,000 and successfully breaking through the key psychological threshold of $105,000. Looking at recent trends, the price touched $105,000 in early June before pulling back, and now standing above this level again indicates that bullish forces are attempting further breakthroughs. Notably, this rally has been accompanied by continuous inflows of institutional capital—BlackRock's Bitcoin ETF (IBIT) has reached a scale of $71.9 billion, holding 660,000 BTC, making it the largest institutional holder in the market. Such "whale"-level position changes provide solid support for prices.
The market is currently in a phase where an "institutional bull market" intersects with an "emotional market". $105,500 is both a breakthrough point and a divergence point between bulls and bears. Investors need to maintain rationality amid greedy sentiment: in the short term, take advantage of volatility for high-throw and low-suction trading, while in the long term, adhere to the overarching logic of increasing institutional holdings and loose liquidity to seize opportunities amid fluctuations.
Today's BTC trading strategy, I hope it will be helpful to you
BTCUSDT BUY@104500~105500
SL:102500
TP:106500~107500

BITCOIN → Buyback bar. Chance of growth to 108,000BINANCE:BTCUSDT is trading in a fairly wide range of 100,600 - 110,400. The market is stagnating due to fundamental uncertainty, but the risks of a decline are quite high...
After the escalation of the conflict in the Middle East, Bitcoin broke the bullish structure on the market and managed to test the local level of 102500, from where a fairly aggressive phase of buying out the fall began within one trading session. The market is defending the structure quite aggressively. The chart shows a local range forming with strong levels at 102500 and 106200. Accordingly, the price may remain in this range for a long time (in which case an intraday trading strategy can be considered). However, if Bitcoin starts to stick to one of the boundaries, then we can consider the price leaving the range, but based on the structure of the uptrend, correction, and the formation of a buyback bar, it would be logical to see an attempt to break through resistance with the aim of continuing growth.
Resistance levels: 106200, 108200, 110400
Support levels: 102500, 100600
On D1, there are no prerequisites for a strong decline. The market is buying up knives and trying to stay afloat (in consolidation). In the medium term, there may be an attempt to retest 102500 - 100600 due to the liquidity pool. But locally, the market may form an attempt to grow to 108200
Best regards, R. Linda!

#BTC bearish cup-handle structure, beware of a pullback!📊#BTC bearish cup-handle structure, beware of a pullback!
🧠From a structural perspective, we broke below the neckline, which means a bearish structure is established, so we need to be wary of further declines.
➡️Yesterday's decline was rapid, so we can wait for a rebound to appear and look for shorting opportunities near the blue resistance area or the downward trend line.
➡️Since it is the weekend, the trading volume may be less. If there is no rebound, then we need to wait patiently for a period of sideways consolidation before looking for shorting opportunities.
⚠️Note that the area around 106500 is a support-resistance conversion zone. If it breaks through here and stabilizes, we can remain optimistic.
🤜If you like my analysis, please like 💖 and share 💬 BITGET:BTCUSDT.P

Once again a perfect time to enter a short
As we are closing in to key resistance area we can see that we are getting a lot of smaller bodied 4H candlesticks. This is indicating a weak buy side and that we are looking to top out!
We also got overbought on the hourly RSI and the MACD has flipped bearish
Combining a crocodile tooth shaped formation taking form on the 15min, a rejection from the downward sloping trend line (third rejection indicates strong trend line) and that we are looking to reverse at key resistance. I entered a 100x short at 106375.
As I am writing we also got in another confirmation on the hourly timeframe. As we can see we got a nice bearish engulfing candlestick.
I think the chart speak for itself. We are about to go down big time!

Bitcoin (BTC/USDT) – Bearish Continuation After Failed Support !Bitcoin attempted to hold the $101,409 support level but failed to sustain above it. The breakdown confirms weakness, and the chart now suggests a continuation of the downtrend if bulls don’t reclaim lost ground quickly.
Technical Breakdown:
Failed Bounce: BTC briefly bounced near $101.4K but got rejected and closed back below the zone.
Bearish Structure: Price continues forming lower highs and lower lows — a clear downtrend.
RSI at 30.34: Close to oversold but still room to fall, which means downside isn’t exhausted yet.
Market Sentiment: Weak hands are exiting, and support zones are getting tested faster than they’re defended.
Key Levels to Watch:
Resistance:
$101,409 – Immediate level, now flipped to resistance
$103,573 – Strong barrier if bulls attempt recovery
$105,807 – Major horizontal resistance and lower high zone
Support:
$97,340 – Next major support zone (possible short-term bounce)
$93,343 – Key level if $97.3K fails to hold
$92,200 – Final support before panic could set in
Trade Idea – Bearish Bias:
Short on Retest Zone: $101.4K – $102K
Stoploss: Above $103.6K
Take-Profit Targets:
TP1: $97,300
TP2: $93,300
TP3: Optional – trail lower if breakdown continues
What Bulls Need to Do:
Reclaim $101.4K fast with a strong close above it on the 4H chart
Otherwise, sellers remain in control
This is not financial advice. Always do your own research (DYOR) and manage your risk accordingly.

Bitcoin Reclaims Momentum: War Fears Fading, Bulls Eye $125K! MARKETSCOM:BITCOIN just delivered a powerful bounce right off the critical $100K level. A key psychological and technical support zone tested multiple times in recent sessions. This time, the bounce came with strong volume confirmation, signaling renewed buyer interest. As geopolitical tensions in the Middle East begin to ease, market confidence is returning, fueling bullish sentiment across the board.
CRYPTOCAP:BTC now looks poised to retest the $110K resistance zone, where some short-term rejection could occur. However, a decisive breakout above $110K opens the gates for a potential rally toward the next major target at $125K. Stay sharp, always manage your risk, and don’t forget to set a proper stop loss. The trend is strong, and momentum is building!
Follow Our Tradingview Account for More Technical Analysis Updates, | Like, Share and Comment Your thoughts
How to Tell BITCOIN is BULLISH using MOVING AVERAGES OnlyBTC is trading sideways and it sparks a lot of debate whether or not we are at the beginning of a new bearish cycle, or if there is still a push upwards waiting to happen.
Here's how you can use the Moving Averages to determine whether or not BTC is bullish.
Don't miss this update on my stance on the market and why I think ALT Season is waiting:
______________________
BINANCE:BTCUSDT

BTC pressure, price under a lot of selling pressure💎 Update Plan BTC weekend (June 22)
Notable news about BTC:
Market overview: Bitcoin's consolidation lasts in the context of increasing macro instability
US President Donald Trump expressed his caution on Thursday when he delayed the decision involving a potential direct attack on Iran for a maximum of two weeks. The global market, including cryptocurrencies, has reacted, slightly increased in Asian and European sessions when investors absorb the impact of crude oil prices in the context of interrupted transport routes.
However, traders are very cautious, reflecting the tough stance of Fed President Jerome Powell on the economy, with the reason for the expectation of inflation in the short term due to tariffs.
Bitcoin -large holders continue to accumulate despite the cautious attitudes of traders on the spot and derivative markets.
Technical analysis angle
Bitcoin price fluctuates around $ 104.057 after cutting up the day from the peak of $ 106,457 of Friday. Main technical indicators, such as relative power index (RSI), strengthen the trend of discounts when the price slip down the average line 50.
Money Flow Index (MFI) indicator, monitoring the amount of money poured into BTC, shortening the trend of increasing, stable around the middle line. This reflects the limited interest in Bitcoin on both spot markets and derivative markets.
If the weakness of the Organizing Committee overshadows the demand on the chain and network activity, supporting the exponent dynamic line (EMA) 50 days at $ 103,169 can be helpful, temporarily absorbing the pressure of selling. Overcoming this level, high fluctuations can accelerate the decline, bringing the main levels, such as EMA 100 days at $ 99,085 and EMA 200 days at $ 93,404, in.
==> Comments for trend reference. Wishing investors successfully trading

Another visit to $95,000 for Bitcoin?Looking at the price action of Bitcoin it appears to be moving in a descending channel formation. Usually this results in one of two outcomes. Either it breaks out, or it doesn't. And if it doesn't then it's most likely back down to the lows of the channel.

Trade of the day - Tuesday!📊 Tuesday Trading Update
As we saw yesterday, the market reacted uncharacteristically to global events — we witnessed some interesting volatility, to say the least ⚡. While there’s still plenty of opportunity to capitalise on, today is a new day, and here are the trades you should be watching like an eagle 🦅.
Most setups today are continuation plays, especially considering we SFP’d the range low and failed to close below 100.3 on the daily. Did we get a bearish close on the LTF? Yes — so we must tread with caution ⚠️.
We're currently sitting at 4H supply, which makes it a juicy spot for a range deviation play — hence my single short 📉. However, if we continue to purge this zone, a continuation long could come into play, targeting the previous demand range.
I doubt I'll be having a class later today. If I get the time, I’ll record a quick session — but if not, here’s what you should be looking for to enter this trade:
👉 A clear change in market structure on the LTF. Or a divergence if you use oscillators
Not sure what that means? Go back and scour through the older videos — it’s all there 📚.
📅 Weekly Schedule:
Wednesday – Potential class
Thursday – ❌ No class
Friday – ❌ No class

BTC: A Classic Cup & Handle in Play!Bitcoin has formed a classic cup and handle pattern on the daily chart, with the 100 EMA providing solid support during the handle formation. Currently, the price is consolidating in what appears to be a bullish flag or extended handle, just below the key resistance zone around $109K. A breakout above this level could ignite a strong bullish rally toward higher targets like $144k.
Key Highlights:
-Cup & Handle pattern confirmed
-10 EMA acting as dynamic support
-Bullish flag/handle forming near resistance
- A breakout could lead to explosive upside
Regards
Hexa
CRYPTOCAP:BTC BITSTAMP:BTCUSD
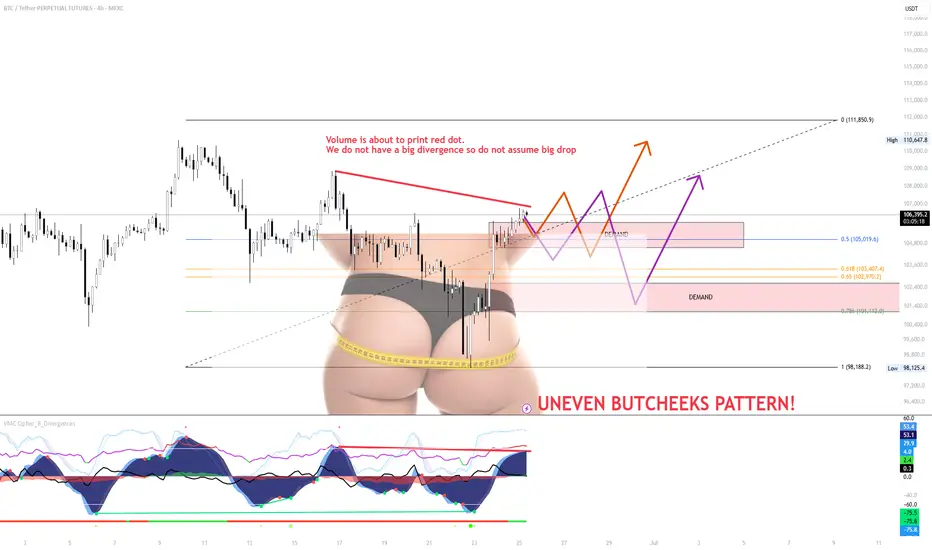
SMALL RETEST on BTC and continuation of BTC TrendThe small range forming just under local resistance is weak and showing signs of exhaustion. Despite a possible red dot printing soon, volume is not confirming a strong bearish divergence, so don’t assume a major drop is guaranteed just yet.
The “Uneven Butcheeks” pattern visually highlights imbalance
A fakeout back into the range, or
A flush to grab liquidity sitting beneath key demand zones.
Key Scenarios
Scenario A (Orange Path)
A breakout through the overhead supply zone could trigger upside continuation toward $111,850.
But unless it’s backed by strong volume and broader BTC strength, I’ll be fading this move.
Right now, this doesn’t look like conviction from bulls — it looks like exhaustion.
Scenario B (Purple Path)
A rejection at current levels or a weak fakeout could break back into the demand zone.
With thin structure below and low buy-side aggression, price could sweep down toward $102.9k–$101.1k, or even lower.
If we get this move, I’ll be watching how buyers behave around the lower demand — that’s where bulls need to prove themselves.
⚠️ Strategy:
Don’t front-run this — let the price confirm or invalidate.
Watch volume. Watch BTC dominance.
Until then, this zone is chop-heavy, and patience = protection.
Bitcoin BTC Pullback Strategy: How I’m Planning My Next EntryI’m currently watching BTCUSDT 👀. Yesterday, we saw a bullish break of structure 🔼, and my bias is to follow that momentum moving forward 📈. Right now, price is overextended 📊, so I’m looking for a retracement into equilibrium, ideally around the 50–61.8% Fibonacci zone 📏.
If price pulls back into that range and holds above the bullish imbalance (discussed in the video) 🧱, I’ll be watching for a long opportunity 🎯. My targets are set at the previous highs and the Fibonacci extension levels 🔝.
⚠️ Disclaimer
This is not financial advice. Trading involves risk, and you should only trade with capital you can afford to lose. Always do your own analysis or consult a qualified financial advisor.

Today's BTC trading strategy, I hope it will be helpful to youWhen Bitcoin prices dip to $101,900—despite the prevailing bearish sentiment—a rational long-position strategy can still be formulated by weighing long-term investment value against potential short-term rebound opportunities. The analysis below covers entry timing, position management, and risk control.
I. Entry Timing Judgment
(1) Technical Signals
Monitor price performance around $101,900. Potential long entry signals include:
1. **Confirmation of bottom patterns**: When prices consolidate near this level to form double bottoms, triple bottoms, or other base structures, and the trading volume during the second/third retest is notably lower than previous attempts—indicating weakening selling pressure. For example, if a double bottom forms near $101,900 with 30% less volume in the second retest than the first, this signals a preliminary entry point.
2. **Technical indicator crossovers**: Track metrics like the Relative Strength Index (RSI) and Moving Averages (MA). A long signal strengthens when:
- RSI breaks above 50 from oversold territory (below 30).
- The 5-day MA crosses above the 10-day MA (golden cross).
- Price breaks through short-term resistance (e.g., $102,500) alongside moderate volume expansion.
(2) News Catalysts
Macro events and industry trends are critical for timing:
1. **Fed dovish signals**: Clues of earlier rate cuts or reduced hiking expectations—boosting market liquidity and benefiting Bitcoin. Align such news with technical signals to enhance long-position reliability.
2. **Cryptocurrency sector tailwinds**: Developments like progress on U.S. stablecoin legislation, relaxed global regulatory policies, or breakthroughs in real-world adoption (e.g., more enterprises accepting Bitcoin payments, higher settlement ratios) can reignite value reassessment. If prices stabilize near $101,900 amid such news, consider entering long positions.
Today's BTC trading strategy, I hope it will be helpful to you
BTCUSDT BUY@102000~103000
SL:101000
TP:105000~106000

Timeframes in Trading: Which Chart Tells You WhatHello, traders! 👋🏻 Why can the same chart tell a different story on 1D, 4H, or 15M? You’ve probably been there. BTC looks bullish on the daily… bearish on the 4-hour… and totally sideways on the 15-minute. So, which one is right?
The truth is: none of them is wrong. They’re just telling different parts of the story. Understanding timeframes in trading isn’t just a technical skill. It’s how you decode what the market is actually doing.
Every Timeframe Has a Role
Think of timeframes like zooming in and out on a map: The 1W chart tells you where the mountain ranges are, the macro trend. The 1D chart shows the highways and the current direction within that macro. The 4H chart reveals city streets, the local trend swings. And the 15M chart? That’s the back alleys, where the noise and micro moves live. BTC, for example, doesn't behave the same way across these views, and it shouldn't.
What Happens If You Ignore Timeframes?
You try to short a "breakdown" on the 15M, only to realize you just sold into 4H support.
You enter a 1D bullish breakout, only to panic when price pulls back aggressively on the 4H… forgetting that the 4H was just doing a retest. Or worse, you start trading against the macro trend, thinking the 15M chart holds more weight than it actually does.
How Professionals Read Timeframes (BTC Example)
Example:
You can start high, work down: 1W → 1D → 4H → 1H/15M. Check the macro first. Is BTC bullish, bearish, or ranging on the 1D or 1W? Then, you can map key levels: Support/resistance from higher timeframes is 10x more meaningful on lower timeframes. For example, BTC’s $30K, a weekly level, creates reactions even down on 5-minute charts. And, align context: A bullish setup on 15M is excellent, but check if it aligns with the 4H trend direction. If the 4H is also bullish, your setup has context. If not, expect chop.
🔗 BTC Right Now: Timeframe Confusion in Action
Just look at the current BTC structure. On the 1W, BTC is still trending higher, higher highs and higher lows from the $15K bottom in 2023. On the 1D, BTC trades inside a broad consolidation range after a strong uptrend. The price has repeatedly tested the $107K–$112K zone, acting as a key resistance cluster, while forming a series of higher lows. It's not a breakdown but a correction inside a bullish structure, testing previous supply zones. The 4H? Chaos. The price bounces between $105K and $112K, which is pure range behavior. The 15M? Traders are getting whipped trying to catch fake breakouts that mean nothing in the daily or weekly context.
Which Chart Tells You What?
All of them. But differently.
THE 1W TELLS YOU THE NARRATIVE.
THE 1D SHOWS YOU THE CURRENT DIRECTION.
THE 4H REVEALS TRADEABLE SWINGS WITHIN THAT DIRECTION.
THE 15M CAPTURES THE NOISE, THE TRAPS, AND THE MICRO OPPORTUNITIES.
If you’re only looking at one timeframe, you’re only seeing part of the picture. So, timeframes aren’t about right or wrong. They’re about perspective. If you’re a day trader, you probably live on the 5-minute to 15-minute charts, while still peeking at the 1H or 4H for structure.
If you’re a swing trader, the 4H and 1D are your home base, with the weekly chart guiding the bigger story. And if you’re thinking in months or quarters, the 1W and 1M are what actually matter – everything else is just noise.
So next time BTC feels “confusing”… zoom out. Or zoom in. The answer is probably hiding in the chart, just not the one you were looking at. Which timeframe do you trust the most when trading crypto? Drop it in the comments!

Support Tested: Can Bitcoin Withstand Global Fear?CRYPTOCAP:BTC is struggling to hold above the key support zone after losing its rising trendline.
This weakness comes as the Israel-Iran conflict intensifies, shaking global market confidence. While BTC has often acted as a hedge, rising geopolitical tension is pushing investors toward safety, causing hesitation even at critical support levels.
A breakdown here could trigger deeper downside.
DYOR, NFA
Bitcoin, The Next High Is The All-Time HighThe title might be a bit misleading but, the truth is that Bitcoin stays bullish short-term and this is bullish on all terms...
Good afternoon my fellow Cryptocurrency trader, how are you feeling today?
Any day, any week, any moment; every month, place or year, the market provides everything we need to know. This information is made available to us through the chart.
Bullish Bitcoin
The present signal is the fact that Bitcoin remains very high, challenging resistance, after a strong recovery and advance. This is happening with the altcoins also.
If you look at the last two peaks, as soon as resistance was hit there was an immediate crash. The next day was full red; very strong bearish action and momentum and this led to a new low. The situation is not the same today.
22-May peak. 23-May, strong bearish action.
9-June peak. 11-June, strong bearish action.
26-June lower high (not a peak). Today, neutral action. This neutral action is what I am taking as a bullish signal. Many other factors of course support this conclusion yet, this is still an early signal.
Fib support
A closer view of the daily timeframe:
4H. The grey line represents Fib. retracement. Dark blue—Fib. extension:
Conclusion
Each time there is a price peak a retrace follows, if there is no retrace then you are not witnessing a peak but rather a stop, a pause; resistance being met.
It seems that the current lower high is not the end but rather just a pause before additional growth. Market conditions can change.
It can happen that several days Bitcoin goes sideways with the bulls failing to garner enough strength. In this scenario, there would be a move lower before additional growth.
The present scenario shows a bullish chart even if prices drop, remember, the market is in no hurry.
Easy money
In September we will have lower interest rates and this is a bullish development for Bitcoin. Advanced money minds see easy money as inflationary for the currency, while Bitcoin is inflation-proof. So the dollar goes down and Bitcoin goes up.
I didn't quite develop this point, next time I'll do a better job.
Summary
The market is good even if it shakes. The market is good and isn't shaking, the recovery is already in place.
Bitcoin's price is very strong and there are many layers of support. The altcoins are in a similar situation, growing from the bottom up.
The Fed will reduce interest rates in September and then once more before the year ends, this is bullish for everything so, everything will be going up, at least everything that we are interested in, support and trade.
Thanks a lot for your continued support.
Never give up!
You are divine! You are blessed.
If you are reading this now, you will be blessed for your great timing. Hard work and dedication always pays.
Keep moving forward, keep pushing forward, never give up.
When life hits you hard, do take a break if you need it, only to comeback with new energy, a new mind and an infinite drive to achieve your goals.
You are the reason why Bitcoin exist... You are the lifeblood of the market.
Without you, nothing is possible. It is because of you that we all continue to grow.
Thanks again for taking the time to read.
I appreciate your support.
Namaste.

What is Dollar Cost Averaging (DCA)?🔵 What is Dollar Cost Averaging (DCA)?
Dollar Cost Averaging (DCA) is a timeless investment strategy that involves investing a fixed amount of money at regular intervals, regardless of the asset's price. It’s one of the most effective ways to build a position over time while minimizing the impact of market volatility.
The term "Dollar Cost Averaging" was popularized in the early 20th century by Benjamin Graham — the father of value investing and mentor to Warren Buffett. Graham advocated DCA as a way to remove emotions and guesswork from investing. By spreading out purchases, investors could avoid mistiming the market and reduce risk exposure.
Today, DCA remains a core strategy for retail investors, especially in volatile markets like cryptocurrencies and growth stocks.
🔵 How Does DCA Work?
The concept is simple: instead of investing a lump sum all at once, you break your total investment into smaller, equal parts and invest them over time — for example, weekly or monthly.
Invest $100 every week into Bitcoin.
Keep buying consistently — regardless of whether price goes up or down.
Over time, this smooths out your average entry price.
You buy more when price is low, and less when price is high.
Example:
If BTC is at $30,000 one month, you buy a small amount.
If BTC drops to $25,000 the next month, you buy more units with the same $100.
Over time, your entry price averages out — reducing the risk of buying at a peak.
🔵 Why Use DCA?
DCA offers both psychological and mathematical advantages:
Reduces timing risk: You don’t need to predict market tops or bottoms.
Builds discipline: Encourages consistent investing habits.
Prevents emotional mistakes: Avoids FOMO buying and panic selling.
Smooths volatility: Especially useful in crypto or fast-moving assets.
🔵 Smart DCA: Buying Into Market Bottoms
While classic DCA is powerful on its own, it becomes even more effective when combined with market structure. A popular approach is to only DCA when the asset is trading below its long-term average — such as the 200-day Simple Moving Average (SMA) or using RSI (Relative Strength Index).
What is the 200-day SMA?
It’s the average closing price over the last 200 days — a key indicator of long-term trend direction.
Why DCA Below the 200 SMA?
Historically, many market bottoms occur below the 200 SMA. Using this as a filter helps you avoid accumulating during overvalued or overheated conditions.
SDCA with RSI
The Relative Strength Index (RSI) helps identify momentum exhaustion. When RSI drops below 30, it often marks deeply oversold conditions — especially on the daily chart for BTC.
How to use it:
Only DCA when price is below the 200-day SMA.
You accumulate during crashes, fear, and corrections.
Avoid buying when price is extended far above long-term value.
🔵 Scaling DCA Based on Undervaluation
To further optimize the strategy, you can scale your DCA amounts depending on how far below the 200 SMA the price is.
Example:
Price is 5% below 200 SMA → invest normal amount.
Price is 15% below → double your investment.
Price is 25% below → triple your investment.
This creates a dynamic DCA system that responds to market conditions — helping you build larger positions when prices are truly discounted.
🔵 When DCA Doesn’t Work
Like any strategy, DCA has limitations. It’s not magic — just a system to reduce timing errors.
In strong uptrends, a lump sum investment can outperform DCA.
In declining assets with no recovery (bad fundamentals), DCA becomes risky.
DCA works best on quality assets with long-term growth potential.
Always combine DCA with research and risk management — don’t blindly accumulate assets just because they’re down.
🔵 Final Thoughts
Dollar Cost Averaging isn’t about buying the exact bottom — it’s about consistency , discipline , and risk control . Whether you’re investing in Bitcoin, stocks, or ETFs, DCA offers a stress-free approach to enter the market and smooth out volatility over time.
Smart traders take it one step further: using moving averages and structure to focus their DCA efforts where value is highest.
DCA won’t make you rich overnight — but it will help you sleep at night.
This article is for educational purposes only and is not financial advice. Always do your own research and invest responsibly.

Skeptic | RSI Masterclass: Unlock Pro-Level Trading Secrets!Hey traders, it’s Skeptic ! 😎 Ready to transform your trading? 95% of you are using the Relative Strength Index wrong , and I’m here to fix that with a game-changing strategy I’ve backtested across 200+ trades. This isn’t a generic RSI tutorial—it’s packed with real-world setups, myth-busting insights, and precise rules to trade with confidence. Join me to master the art of RSI and trade with clarity, discipline, and reason. Big shoutout to TradingView for this epic free tool! 🙌 Let’s dive in! 🚖
What Is RSI? The Core Breakdown
The Relative Strength Index (RSI) , crafted by Welles Wilder, is a momentum oscillator that measures a market’s strength by comparing average gains to average losses over a set period. Here’s the formula:
G = average gains over n periods, L = average losses.
Relative Strength (RS) = | G / L |.
RSI = 100 - (100 / (1 + RS)).
Wilder used a 14-period lookback , and I stick with it—it’s smooth, filters noise, and gives a crystal-clear read on buyer or seller momentum. Let’s get to the good stuff—how I use RSI to stack profits! 📊
My RSI Strategy: Flipping the Script
Forget what you’ve read in books like The Handbook of Technical Analysis by Mark Andrew Lim— overbought (70) and oversold (30) aren’t just for shorting or buying. I go long when RSI hits overbought, and it’s been a goldmine. I’ve backtested over 200 trades with this approach, and it’s my go-to confirmation for daily setups. Why does it work? When RSI hits overbought on my 15-minute entry chart, it signals explosive buyer momentum. Here’s what you get:
Lightning-Fast R/R: I hit risk/reward targets in 30 minutes to 2 hours on 15-minute entries (longer for 1-hour entries, depending on your timeframe).
Massive R/R Potential: An overbought RSI on 15-minute can push 1-hour and 4-hour RSI into overbought, driving bigger moves. I hold for R/Rs of 5 or even 10, not bailing early. 🚀
Rock-Solid Confirmation: RSI confirms my entry trigger. Take BTC/USD:
BTC bounces off a key support at 76,000, sparking an uptrend.
It forms a 4-hour box range, but price tests the ceiling more than the floor, hinting at a breakout.
Trigger: Break above the box ceiling at 85,853.57.
On 15-minute, a powerful candle breaks the ceiling, and RSI hits overbought—that’s my green light. I open a long.
Soon, 1-hour and 4-hour RSI go overbought, signaling stronger momentum. I hold, and BTC pumps hard, hitting high R/R in a short window.
This keeps trades fast and efficient—quick wins or quick stops mean better capital management and less stress. Slow trades? They’re a mental grind, pushing you to close early for tiny R/Rs. 😴
Pro Rules for RSI Success
Here’s how to wield RSI like a trading weapon:
Stick to the Trend : Use RSI in the direction of the main trend (e.g., uptrend = focus on longs).
Confirmation Only: Never use RSI solo for buy/sell signals. Pair it with breakouts or support/resistance triggers.
Fresh Momentum: RSI is strongest when it just hits overbought/oversold. If the move’s already rolling, skip it—no FOMO, walk away!
Customize Zones: Overbought (70) and oversold (30) can shift—it might show reactions at 65 or 75. Adjust to your market’s behavior.
Backtesting RSI: Your Path to Mastery
To make RSI yours, backtest it across at least 30 trades in every market cycle— uptrend, downtrend, and range. Test in volatile markets for extra edge. 😏 Key takeaways:
Range Markets Kill RSI: Momentum oscillators like RSI (or SMA) are useless in ranges—no momentum, no signal. Switch to ROC (Rate of Change) for ranges—I use it, and it’s a beast. Want an ROC guide? Hit the comments!
Overextended RSI Zones: On your entry timeframe (e.g., 15-minute), check higher timeframes (e.g., 4-hour) for past RSI highs/lows. These are overextended zones—price often rejects or triggers a range. Use them to take profits.
Final Vibe Check
This RSI masterclass is your key to trading like a pro—fast R/Rs, big wins, and unshakable confidence . At Skeptic Lab, we live by No FOMO, no hype, just reason. Guard your capital— max 1% risk per trade, no excuses. Want an ROC masterclass or more tools? Drop a comment! If this fired you up, smash that boost—it means everything! 😊 Got a setup or question? Hit me in the comments. Stay sharp, fam! ✌️

Bitcoin Short-Term, 1H Timeframe, Bullish ($115,482 Next Target)Bitcoin completed its retrace 13-June 01:00 AM with a higher low at $102,663. Price action and trading volume indicates that the bearish move is over. Bitcoin is trading above support in the form of 0.618 Fib. retracement.
Bitcoin is turning bullish moving above EMA34, EMA21, EMA13 and EMA8 all in this current active session.
Immediate support stands between $105,293 and $105,314.
Next support is $104,533 and main support $104,282 matching the 0.618 Fib. retracement level.
Next target easy hit is $106,625, followed by $107,559. The second being a mild resistance.
Bitcoin can easily continue higher short-term aiming next at $108,989 followed by the last high at $110,586. Depending on how this level is handle we can update the short-term view.
The 1H timeframe is bullish now based on price action, candlestick patterns, higher lows, moving averages and the oscillators.
Namaste.
