BTC/USDT — New Local High, Trendline BrokenBitcoin has officially broken out of a descending trendline and just made a new local ATH, flipping key resistance into support.
Structure:
Descending wedge breakout
Clean move above 111.8K zone
Confirmation pending with retest
Strategy:
Wait for the retest of the breakout zone for ideal entry.
Entry: 110.5K – 111.2K (on confirmation)
Stop Loss: 108.5K
Targets:
113.5K (minor)
116.8K
122.3K
Expected Move: ~10%–12% upside
BTC continues to show strength, and the breakout confirms bullish momentum. This is the Ideal time to watch for long entries on pullbacks.
DYOR | Not financial advice
BTCUSDT.P trade ideas

BTC Analysis — Long-Term Buy Zone AheadI'm watching $111,000 as a major buy zone on Bitcoin.
If price retraces to that level, I’ll be ready to enter a long position.
This is not a prediction — it’s a scenario.
Smart traders don’t guess, they prepare.
Let price come to your level. No chasing.
📍Set your alerts and stay patient.

BTCUSDT. Current scenario range Current scenario range — can shift depending on how the market reacts next.
This analysis is based on the Initiative Analysis concept (IA).
Wishing you profitable trades!
Can Bitcoin reach new highs?Bitcoin reached around 121722, close to the expected target of 130,000. There are two current expectations:
1. Black line: 5-wave rising structure, currently in the 3rd wave rising, and there will be a 5th wave rising after the correction.
2. Purple line: abc rising structure, currently in the last wave c rising, will end the rise ahead of time.
The rise is not yet complete. If it falls below the lower track of the channel, the rise will end.

BTC Era, continue to create new ATH💎 BTC WEEKLY PLAN UPDATE (14 July )
NOTABLE NEWS ABOUT BTC
Bitcoin (BTC) broke above a key milestone on Friday, setting a new all-time high of $119,999 with no signs of slowing down. The technical outlook supports further gains as momentum indicators remain strong and price action is solidly in price discovery mode, with the next potential target at $135.000
Bitcoin’s Next Stop: $135.000
Bitcoin entered price discovery on July 9, and since then, the king of cryptocurrencies has surged toward the $120,000 target—a key psychological level for traders. Early Monday during the Asian session, BTC climbed to a peak of $119,999, marking a new all-time high and the closest the asset has come to this milestone.
TECHNICAL ANALYSIS PERSPECTIVE
Two key momentum indicators on the daily timeframe signal underlying bullish momentum in Bitcoin, suggesting a potential for further upside. The Relative Strength Index (RSI) reads 76, and the Moving Average Convergence Divergence (MACD) is flashing green histogram bars above the neutral line.
However, if BTC undergoes a correction, it may extend its pullback to find support near the lower boundary of the Fair Value Gap (FVG) around $115,222.
Derivatives market data shows that $76 million was liquidated over the past 24 hours as BTC surged toward its new high. The long/short ratio, which is considered an indicator of bullish or bearish trader sentiment, is above 1—indicating that more derivative traders are optimistic about Bitcoin and are expecting further gains in the king of cryptocurrencies.
Stay tuned to the channel for updates.
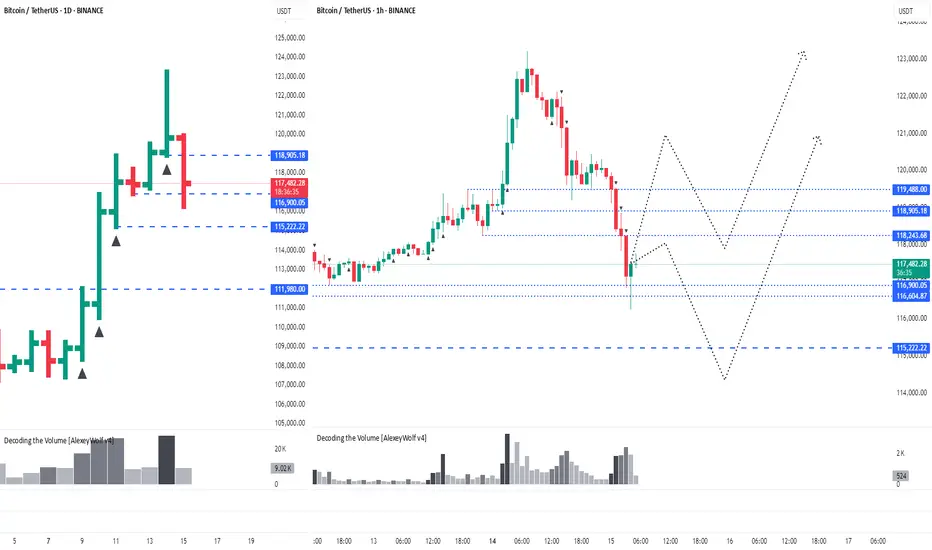
BTC - PATH to 110.5KSOO the Liquid moves or news moves made it ecstatic and so is the top move, close below 107,990 in 1H will nullify this, else yet another squeeze coming!

BTC Short Bitcoin needs a little correction from here for a healthy pump , I am in short postion now

Bitcon Crash Time!!Currently, the price of Bitcoin is at its peak, and it's the best time to exit the market because a major drop is imminent...

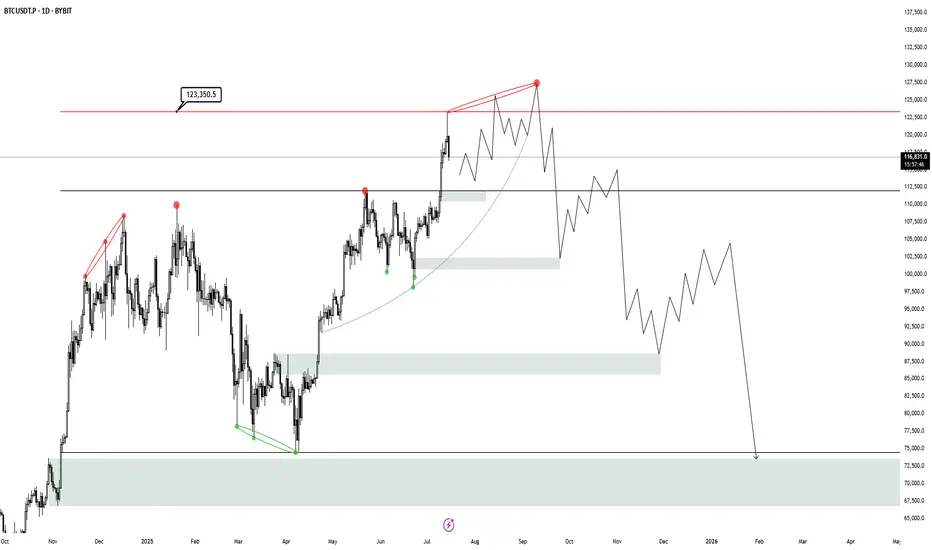
BTC HTF Distribution V3This is my new outlook for BTC if this 250 day old range is intended to be a HTF Distribution Model 1, which has neither been confirmed nor invalidated. A weekly close above 123.350$ will invalidate this model and likely lead to higher prices. Yesterday we had a perfect rejection from the deviation limit, which now probably creates a new range, that then will either reaccumulate or distribute.
Bitcoin & new rallyBitcoin surpassed its previous all-time high of $112,000 and is now approaching $124,700, the third resistance level for July's pivot.

"Bitcoin, after breaking the resistance at $110,000"Bitcoin, after breaking the resistance at $110,000, could target $115,000 and $120,000 in the next steps."

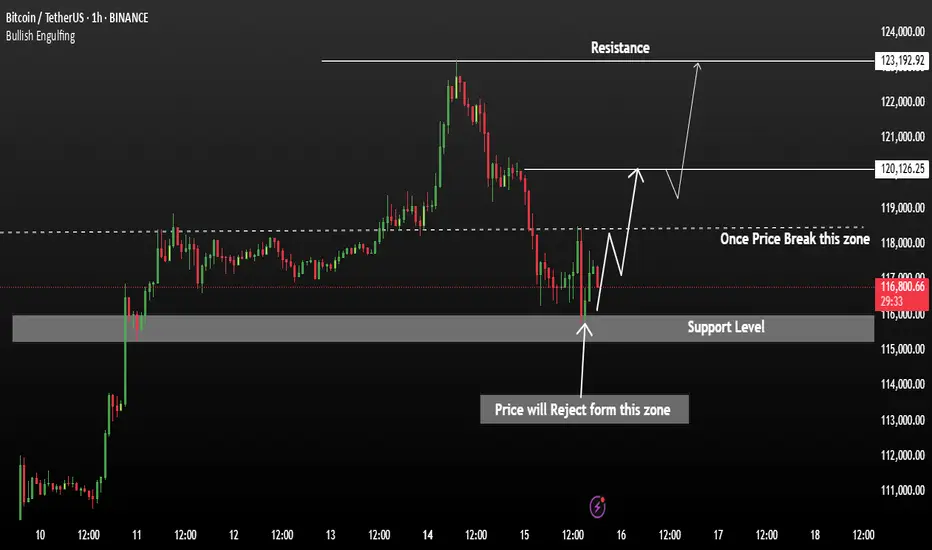
Bitcoin Price in Clear Bullish TrendBTCUSDT has formed a strong support zone around 115,500, where the price recently faced rejection, signalling potential bullish momentum. This zone is acting as a solid base, and any sustained move above the current levels could trigger an aggressive upward move.
Breakout Confirmation: A 1H candle close above 118,500 would confirm bullish continuation Upside Targets: 120,150 and 123,200,
A successful breakout above 118,500 could open the path toward 120K investor needs to monitor our chart.
PS:: Support with like and comments for more better analysis Thanks.
Bitcoin (BTC): Current Neckline Zone is Crucial | Bounce Coming?After a recent push to a new ATH area, the price has cooled down, which led the price back to the local neckline zone, which is our next important zone.
This correction cooled down the Bollinger Bands Channel and RSI, which would mean we are just one MSB (on smaller timeframes) away from another rally towards the upper zones.
Now if for any reason we fall more, then this might turn into a nasty movement, as our target would be then around $110K, where we would be looking for another buy entry (if we fail to get that MSB we are currently looking for).
Swallow Academy

BTC - Falling Correction = Continuation?BTC has been playing by the rules lately!
Every time Bitcoin forms a falling correction, it turns out to be a bullish continuation pattern — and history might be repeating itself 👀
As shown on the chart:
Previous falling channels (flag/wedge structures) have consistently led to strong bullish impulses.
The current correction also appears to be a falling channel, hinting at another potential bullish leg soon.
As long as the structure holds and no major support is broken, the next target could be a new all-time high.
Let’s see if BTC continues to respect this textbook behavior.
📌 Remember: Falling corrections in an uptrend = healthy continuation!
📚 Always follow your trading plan regarding entry, risk management, and trade management.
Good luck!
All Strategies Are Good; If Managed Properly!
~Rich

BITCOIN =140-150kThe X-wave has formed in the form of a neutral triangle pattern, and eventually Bitcoin could once again touch $106,000 and move towards $140,000-150,000 with the completion of wave-e.
Good luck
NEoWave Chart

Bitcoin (BTC): Markets on Fire | Almost at $120K (140K Next?)Markets are going crazy, people are in fear of missing out (FOMO) and we are just chilling; the price moved exactly like we needed it to move.
We are very close to our target of $120K,, where we might see some kind of strong rejection or even stronger bullish volume (we will have to reach this areaa before deciding our next gameplay).
What we see or aim at is $140K to be a local to for this bull run. After that we are expecting more of sideways movement and then a bigger correction to happen.
Swallow Academy

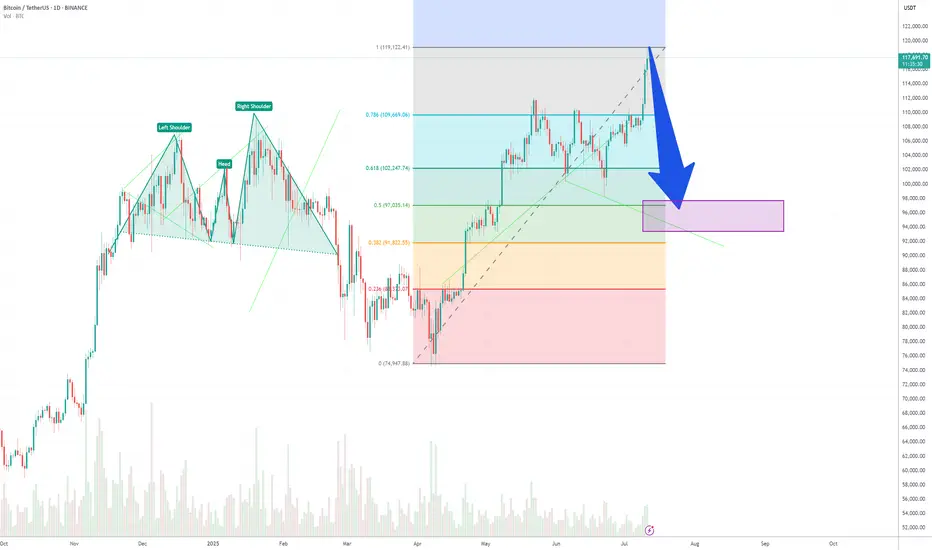
BTCUSD – Is This the Macro Top? Sell?This analysis is based on a convergence of classic technical signals, structural wave counts, and institutional order flow. Together, they strongly suggest that we may be witnessing a macro distribution phase, possibly leading into a larger correction.
1. Elliott Wave Count (Supercycle and Cycle Degree)
-Clear channel from 2018–2025 defining the entire impulsive structure.
-Final wave V is subdivided into five minor waves, with the fifth showing characteristics of an ending diagonal (low momentum, overlapping waves).
-Sructure is consistent with terminal wave exhaustion, including a false breakout and multiple rejections.
2. Volume Profile and Institutional Flow
-High-volume nodes at the top (Coinbase/Binance) align with historical distribution zones, not accumulation.
-Likely OTC activity as smart money exits quietly near all-time highs.
-VPVR shows major support clusters far below current levels (100k–88k), highlighting inefficient price zones above.
3. Weekly Technical Indicators
-RSI (classic and McAfee-based): long-term bearish divergence vs price.
-Stochastic RSI: extended overbought conditions; full cycles often reverse from this zone.
-MFI (Money Flow Index): >80 — historically precedes top formation in BTC.
-MACD: approaching a potential bearish cross in the coming weeks.
-WaveTrend Oscillator: peaking — behavior matches major tops in 2021 and 2017.
4. Moving Averages & Structural Support
-EMA21 (Weekly): ~96k — likely target for wave A of a corrective phase.
-EMA50: ~87k — coincides with cluster of historical buying interest.
-EMA100/200: ~68k and ~50k — long-term value zones if correction deepens.
5. Pivot Levels & Price Structure
-Price reached R1 (112,400) and is showing rejection — classic pivot reversal behavior.
-S1/S2 (~100–92k): probable short-term correction zones.
-S3/S4 (<88k): targets for deeper wave C or end of macro correction.
6. Institutional Behavior & Sentiment
-Large buying volume at the highs does not represent breakout momentum — likely retail absorption of institutional selling.
-Momentum divergence and false breakout behavior reinforce the distribution thesis.
-Sentiment: overly bullish news and euphoria align with classic retail top behavior.
Conclusion
This confluence of Elliott Wave structure, volume profile, indicator exhaustion, and institutional flow activity points to a high-probability macro top in Bitcoin. While no analysis is infallible, the alignment of so many signals is rare and demands attention.
Disclaimer:
This is not a recommendation to sell. This is a technical analysis intended purely for educational and analytical purposes.

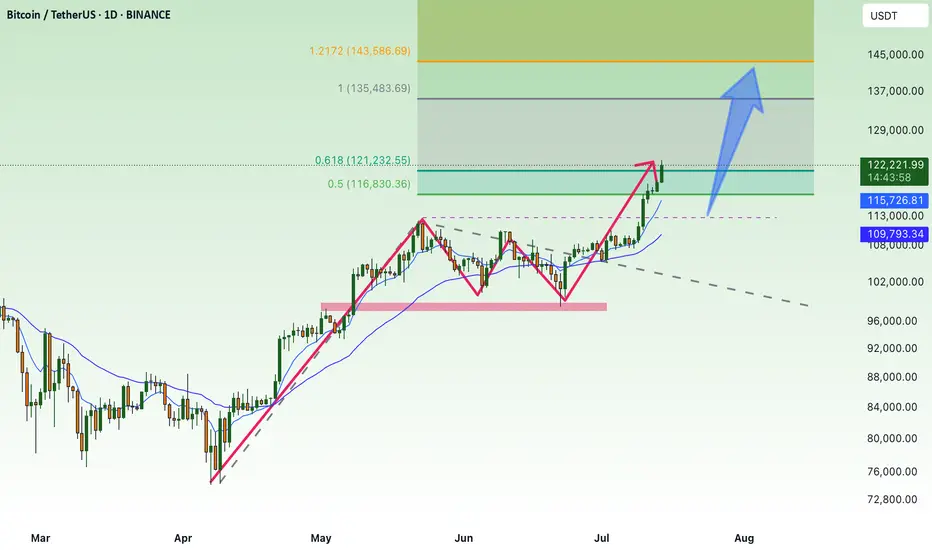
$BTC FLY TOWARDS 141K$ NEXT?CRYPTOCAP:BTC Bull Flag Target Hit – Eyes on 129K & 134.5K Next! 🔥
Bitcoin has overachieved its bull flag target and is now setting up a textbook Break & Retest of the previous All Time High (~$123K).
📌 Key Levels to Watch:
🔄 Retest Zone: $111K–$113K (previous ATH)
🎯 Next Targets:
$129K (0.12 Fib Extension)
$134.5K (Golden Extension Zone)
📉 Invalidation: Below $104K
Volume remains solid, and structure is bullish — expect a healthy dip & bounce before continuation.
This retest could be the final springboard toward $141K.


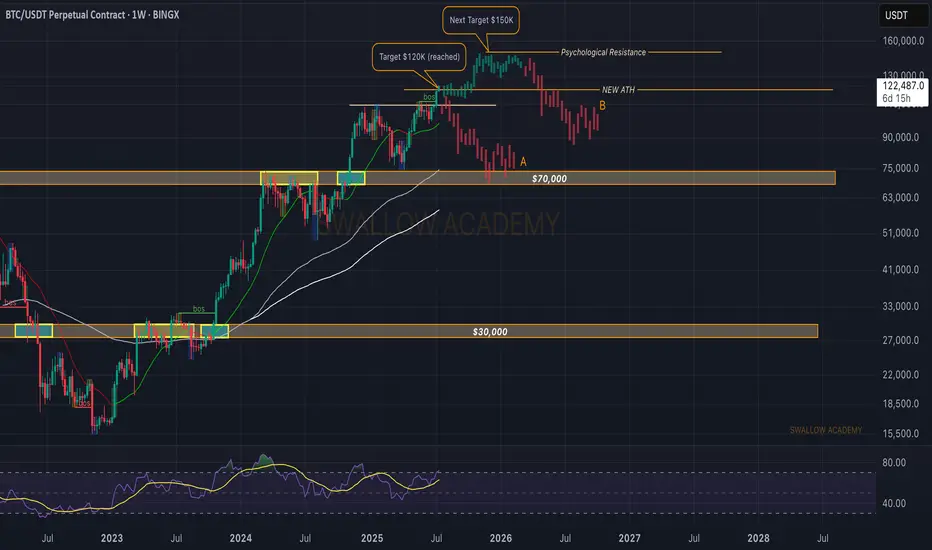
Bitcoin (BTC): Our Target Got Reached, Not Time To Just Watch!Buyers keep on pushing. As a new week starts, we are seeing a strong buy-side dominance and a new ATH to be formed, which broke our major target area of $120K.
Now to give a quick answer, our target is sitting at $140-150K, which we think will be the local top for this bull cycle, and as we recently reached major psychological resistance, we might see some sideways movement from here on, so there are a few things we are going to look for in order to get a potential trade from here.
1) Look for proper BOS (which should give us a good entry for long position)
2) if we see sideways channel, wait out for it to properly form on 30M timeframe, then try to trade inside the channel
3) If we see any kind of MSB (market structure break), we are going to look for a short position, as we might have a quick liquidity hunt there.
Swallow Academy
from 118k $, I expect a correction to the area of 100k$Somewhere from the current levels of 118k $, I expect a correction to the area of 100k$
btc/usdtHello friends, Bitcoin has finally hit another historic high, and as we said in our previous analysis, this time we are definitely going for the $120 and $130 targets. What do you think?

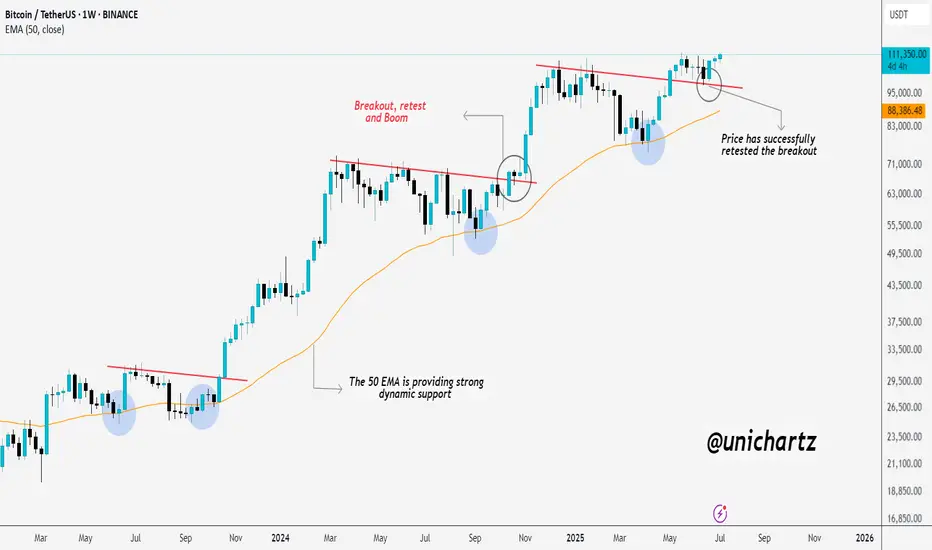
50 EMA Magic: Bitcoin Explodes After Perfect Retest!CRYPTOCAP:BTC just made a new All-Time High (ATH) — exactly as mentioned!
It broke out, retested perfectly, and blasted off.
The 50 EMA is acting like a rocket launchpad, giving price solid support every time.