BTC - Daily Chart - Bull flag route 7/1/2025July 1st, 2025
BTC - Daily Chart
A bull flag route = Two Scenarios
1. Breakout - UP
- Retrace before the $105k area
- Consolidate
- Break out the top line
SL $104k
TP1 @ 108k
TP2 @ 111k
Final TP @ 113k NEW ATH
2. Fail support - DOWN
- 105k fail to support
- Aim for the button of the flag for support
SL $106k
TP @100k
Final TP @96k
BTCUSDT.P trade ideas

Bitcoin (BTC/USDT) – 4H Analysis UpdateBTC is currently holding above the key resistance-turned-support zone of $106,057, after a clean breakout from the symmetrical triangle last week. Price is consolidating just below $107,000, signaling a potential pause or minor pullback before the next leg.
Technical Overview:
Trendline support from May is intact
$106K zone flipped into support — critical for bulls to hold
Price action is compressing under resistance at $107,000
Holding here may lead to a retest of $108,895, then $111,785
Key Levels to Watch:
Support:
$106,057 – Immediate support
$101,409 – Mid-range demand zone
$98,898 – Rising trendline
$93,343 – Strong base zone
Resistance:
$107,000 – Minor resistance
$108,895 – Major resistance
$111,785 – Upper breakout target
Outlook:
Bulls need to defend the $106K zone to maintain momentum. Failure to do so could cause the price to pull back toward $101K. On the flip side, strong volume above $108900 may trigger a rally toward $111K+.
DYOR | Not Financial Advice

Long opportunity in BTC/USDT.PSThe 107963.44 level has already been broken. So we need to wait to retest the same level.
Reasons : -
1. 30 MIN BOS Breakout.
2. it retested the fibonocci 0.611 level.
Entry : 107963.44
TP : 109065.90
SL : 107415.57
Disclaimer : I'm not recommending to take this entry. Do with your analysis too.

do not SHORT Bitcoin with 20XA consolidation range happens when the market trades sideways, in a neutral capacity. This sideways trading is neither bearish nor bullish, thus neutral. The bearish or bullish tendencies can only be defined based on the broader market structure.
If the consolidation range develops coming from a major drop, you can say that the market is bearish and the consolidation a bearish consolidation even if the breakout happens to the upside. Once it happens to the upside we can say that a reversal developed but the tendencies were bearish nonetheless.
If the consolidation range develops coming from a major rise, you can easy say while being correct that the market is bullish and the consolidation phase a bullish one, because of the bigger structure, previous price action and the chart.
Bitcoin is consolidating with bullish tendencies but there is a boundary which we call resistance and another boundary which we call support, this is the trading range. When the market is ranging, this is when margin traders lose the most because the trend remains hidden and money tends to be made when the market is in a clear trend.
Whenever the upper boundary gets challenged we get a retrace and a test of support. Whenever the lower boundary gets tested prices recover and move back up. This process gets repeated for as long as it is needed to remove all the weak hands, most of the signals are pure noise.
This is the situation in which we find Bitcoin today. Ultra-bullish but sideways and anything can happen short-term. Do not SHORT Bitcoin with 20X. You might end up with some fast and easy profits.
Thank you for reading.
Namaste.

Middle East peace/war = Bitcoin’s Explosive Price CoilDo you know why every time tensions rise in the Middle East, Bitcoin springs upward like a compressed coil?
This market reaction isn’t just a coincidence it’s the result of a mix of psychological and economic factors we’ll explore today.
Get ready to understand how these crises can create golden opportunities for the world’s favorite digital currency.
Hello✌
Spend 3 minutes ⏰ reading this educational material.
🎯 Analytical Insight on Bitcoin:
Price is approaching a significant support level that has held strong historically. A potential rebound from this zone could lead to at least a 7% upside move 📈, with the primary target set around $115,000—near a key descending trendline on the daily chart. Watching this level closely for confirmation 🔍.
Now , let's dive into the educational section,
Market Psychology: When War Plays with Fear and Greed 🧠
Middle East crises act like a spring: when released, they trigger intense fear in the market. Many traders react emotionally and start selling their holdings. The key point: this fear often flips into greed.
When Bitcoin’s price drops due to war fears, savvy traders seize the opportunity and enter the market. This cycle of fear and greed causes Bitcoin’s price to surge faster than usual just like a compressed spring suddenly releasing.
If you understand these market emotions and trade without bias, you can maximize gains from such volatility.
Key TradingView Tools for Bitcoin Analysis 📊
When the Middle East conflict heats up, market volatility spikes, affecting Bitcoin as a high-risk asset.
Using essential indicators like RSI , Fibonacci retracements , and volume on TradingView helps you pinpoint precise entry and exit points and better understand market reactions.
Practical Tips for Better Tool Usage ⚙️
To get the most out of TradingView:
Activate several indicators simultaneously and compare price movements with volume.
Draw Fibonacci retracements on previous trends to find key support and resistance levels.
Check RSI to see if Bitcoin is overbought or oversold.
Monitor trading volume to confirm momentum shifts.
This approach turns your analysis from guesswork into a logical, actionable strategy.
How Middle East War Drives Bitcoin Growth: Final Analysis 🚀
As tensions escalate, investors seek safe-haven assets, and Bitcoin, known as digital gold, attracts massive attention. Also, banking restrictions and sanctions push liquidity toward cryptocurrencies.
These condition s, combined with market psychology and the analytical tools we covered, make Bitcoin behave like a compressed spring that suddenly leaps upward, driving significant growth. Traders aware of these trends and skilled in using indicators and sentiment can find better profit opportunities.
Recommendations 📌
Geopolitical tensions in the Middle East act as a powerful trigger for Bitcoin volatility. Understanding market psychology, smart use of TradingView tools, and having a solid risk management strategy are key to success in such times. I recommend keeping an eye not just on technical analysis but also on market sentiment and political news to make the best timely decisions.
✨ Need a little love!
We put so much love and time into bringing you useful content & your support truly keeps us going. don’t be shy—drop a comment below. We’d love to hear from you! 💛
Big thanks,
Mad Whale 🐋
📜 Please remember to do your own research before making any investment decisions. Also, don’t forget to check the disclaimer at the bottom of each post for more details.

Bitcoin BTC price analysis BTC.D and events calendar for JulyToday is the last day of the month and the last day of the second quarter, so there may be some volatility in the markets between 🐂 VS 🐻
💰 The CRYPTOCAP:BTC chart shows an interesting picture — the price has reached the upper limit of the consolidation channel, and now:
1️⃣ The scenario with an upward breakout is quite clear: a breakout from the channel upward and consolidation above $108-110k= a move to $125k during July.
2️⃣ A correction to $99k will mean that buyers have taken control of the OKX:BTCUSDT price, preventing it from updating its lows. This will be a clear signal to buy, because further growth is inevitable.
3️⃣ A deep correction to $91,660 (filling the GAP that formed on the CME BTC chart) or slightly lower. This is the last “unclosed” GAP, which, according to TA rules, should be filled for a full-fledged growth trend to begin.
So which scenario is closer to your heart, which one do you believe in?
Or write your version of events in the comments.
Interesting observations to think about:
◆ Over the past two weeks, the inflow of funds to #BTCETF has exceeded $5 billion, but the price of #BTCUSD on CEX exchanges has not been able to “break out” upward. Is this just ETF "property of numbers", or are spot #Bitcoin sales that strong?
◆ The BTC.D indicator has reached a critical level of 66%, and it will be interesting to see whether it will give altcoins some breathing room next month.
(If there are a lot of likes and comments under the idea, we will additionally describe our thoughts on BTC.D and USDT.D.)
◆ SP 500, by the way, has updated its highs, and the last few months on the stock market are very similar to the beginning and middle of the COVID-19 pandemic in 2020.
◆ And in principle, July promises to be very eventful:
👉 By July 9, Trump is expected to make a statement regarding the tariff wars with the rest of the world, which he has put on hold.
👉 July 18 marks the beginning of Mercury retrograde, which “influences” people's behavior and ‘superstitions’ and forces them to be “more cautious” when making trading decisions (and trading bots don't care about emotions and beliefs)
👉 And on July 30, there will be a FOMC meeting, where Mr. Powell may announce a rate cut, as the US is in a recession, which is time to acknowledge.
If we have forgotten anything, please add it in the comments!

BTC - Falling Correction = Continuation?BTC has been playing by the rules lately!
Every time Bitcoin forms a falling correction, it turns out to be a bullish continuation pattern — and history might be repeating itself 👀
As shown on the chart:
Previous falling channels (flag/wedge structures) have consistently led to strong bullish impulses.
The current correction also appears to be a falling channel, hinting at another potential bullish leg soon.
As long as the structure holds and no major support is broken, the next target could be a new all-time high.
Let’s see if BTC continues to respect this textbook behavior.
📌 Remember: Falling corrections in an uptrend = healthy continuation!
📚 Always follow your trading plan regarding entry, risk management, and trade management.
Good luck!
All Strategies Are Good; If Managed Properly!
~Rich

Bitcoin New ATH Targeting $115K–$120KAfter topping out at the previous ATH, Bitcoin formed a classic diamond top pattern which triggered a drop to the $98,115 level. Now, Bitcoin appears to be forming a second diamond — but this time, the breakout structure suggests a bullish reversal rather than a top.
This second diamond formation indicates consolidation before a strong upward move, potentially driving BTC toward a new all-time high between $115K and $120K.
Watch for confirmation of the breakout. If price holds above key resistance levels post-pattern, the bullish scenario gains strength.

BTCUSDT – Accumulation Confirmed? Wyckoff Blueprint Playing Out Bitcoin continues to compress inside a defined range, resting above both a rising trendline and a former resistance turned support zone. This structure fits cleanly within a Wyckoff-style Accumulation Phase (B-C).
We’re now at a critical moment where smart money may be absorbing supply, preparing for the next phase.
🔍 Key Observations:
Range-bound price action with higher lows and muted volume
Spring-like wick and recovery from the bottom of the range
Support holding at prior breakout zone and ascending trendline
Structure shows signs of stealth accumulation with a possible breakout ahead
Sideways movement with fading volatility
Gradual compression within the range
Strong support defended multiple times (might make the support weaker as well !)
A potential spring/retest event may already be in play
You’ll see fakeouts, wicks, and hesitation in this phase — designed to trap weak hands. But the underlying behavior points to preparation, not distribution.
The quiet before the markup. Let the market reveal its hand. 📈

Bitcoin Approaches PRZ – Will the Falling Wedge Break ?Bitcoin ( BINANCE:BTCUSDT ) failed to break through the Support zone($106,800-$105,820) after attacking it five times , and started to rise again.
Bitcoin is currently moving near the Resistance zone($109,220-$108,280) , Cumulative Short Liquidation Leverage($108,800-$108,085) , Potential Reversal Zone(PRZ) , and Resistance lines .
From a Classical Technical Analysis perspective , Bitcoin's movements over the past two days seem to have formed a Falling Wedge Pattern .
From an Elliott Wave theory perspective , Bitcoin appears to have completed the main wave 4 within the Falling Wedge Pattern. The structure of the main wave 4 was a Double Three Correction(WXY) .
I expect Bitcoin to attack the Resistance lines after breaking the upper line of the Falling Wedge Pattern . If Bitcoin fails to break the Resistance lines before the global markets close , we can expect Bitcoin to fall again. Because entering Saturday and Sunday , the trading volume is generally low , and I think Bitcoin needs a lot of volume to break the resistances .
Do you agree with me?
CME Gap: $106,645-$106,295
Cumulative Long Liquidation Leverage: $106,055-$105,430
Note: If Bitcoin manages to break the Support zone($106,800-$105,820), we should expect further declines.
Please respect each other's ideas and express them politely if you agree or disagree.
Bitcoin Analyze (BTCUSDT), 1-hour time frame.
Be sure to follow the updated ideas.
Do not forget to put a Stop loss for your positions (For every position you want to open).
Please follow your strategy and updates; this is just my Idea, and I will gladly see your ideas in this post.
Please do not forget the ✅' like '✅ button 🙏😊 & Share it with your friends; thanks, and Trade safe.

BTC/USDT 4H – High-Probability Decision Point Ahead Bitcoin is currently retesting a confluence-rich zone — a textbook decision area where structure meets sentiment.
🔻 What’s in play?
🟥 Demand Zone / Bullish Order Block / Breaker Block (visible on 1H)
📈 Third-touch test of the ascending trendline – statistically known to trigger strong moves
⚪ Price sitting just above the 200 EMA acting as dynamic support
🧱 Prior resistance flipped to support — now being validated again
Despite the correction, structure remains intact. This is a healthy retracement unless price starts closing below trendline + zone with volume.
🔀 Possible Outcomes:
Bounce: If buyers step in here, this could mark the next leg in the uptrend.
Breakdown: A strong close below the zone/trendline could shift structure and sentiment bearish.
⚠️ No trade bias here — let price show its hand.
💬 What’s your view — bounce or break? Comment below!
✍️ Chart marked with structure logic only — not financial advice.

BTCUSDT Daily – Bullish Engulfing = Big Move?Whenever we've seen a bullish engulfing candle on the daily timeframe, it’s often followed by a strong upward move. This pattern has repeated consistently throughout the current cycle.
🔹 The recent daily close shows a clean bullish engulfing right off the 50 EMA support.
🔹 Previous purple zones also highlight areas where similar engulfing candles led to sharp rallies.
🔹 Price is once again reclaiming momentum after a liquidity sweep — a classic accumulation signal.
📈 If history repeats, we could be eyeing another leg higher toward the $112K–$115K zone.
Pattern Psychology:
"This bullish engulfing isn’t just a candle — it's a sentiment shift, where buyers overpower sellers completely in one session."
🔹EMA Bounce Strategy:
"Price is using the 50 EMA as a trampoline — a typical smart money support zone."
🔹 Rejection of Breakdown Narrative:
"The fakeout below 100,582 support could be a classic bear trap, setting up for a liquidity-driven rally."
🔹 Pivot Zone Reaction:
"Immediate pivot zone (102,292) reclaimed — price now in a favorable position to target next R1 around 110,000."
🔹 Historical Context:
"This setup mirrors the March bounce, where similar structure and RSI/MACD confluence led to a 12% surge."
⚠️ Disclaimer:
This is not financial advice or a buy/sell recommendation. Analysis is for educational purposes only.
All chart markings and interpretations are original.

BTC Breakdown Escalates Bearish MomentumBitcoin has officially broken below the critical 104K support level, invalidating the recent short-term bullish structure. The price action reflects a clear shift in market sentiment, confirmed by the bearish EMA/SMA crossover and a firm rejection from the strong supply zone between 110K–111.8K.
This rejection formed a clean lower high around 110K, followed by a decisive drop below the weak supply area and failure to hold 104K a key level previously acting as a demand floor. The current structure now favors downside continuation, with the 98K zone as immediate focus.
If bearish momentum persists, attention will shift toward the Weak Potential Reversal Zone and eventually the Recommended Buy Back Zone around the 84K–86K area. This zone aligns with a historical support range and may offer high-probability entries for medium-term accumulation.
Until price reclaims the 104K–105.5K region, rallies are likely to be sold off within the supply zones. Short-term traders may look to trade the breakdown toward the highlighted support levels, while long-term investors should monitor price reaction within the buyback region.

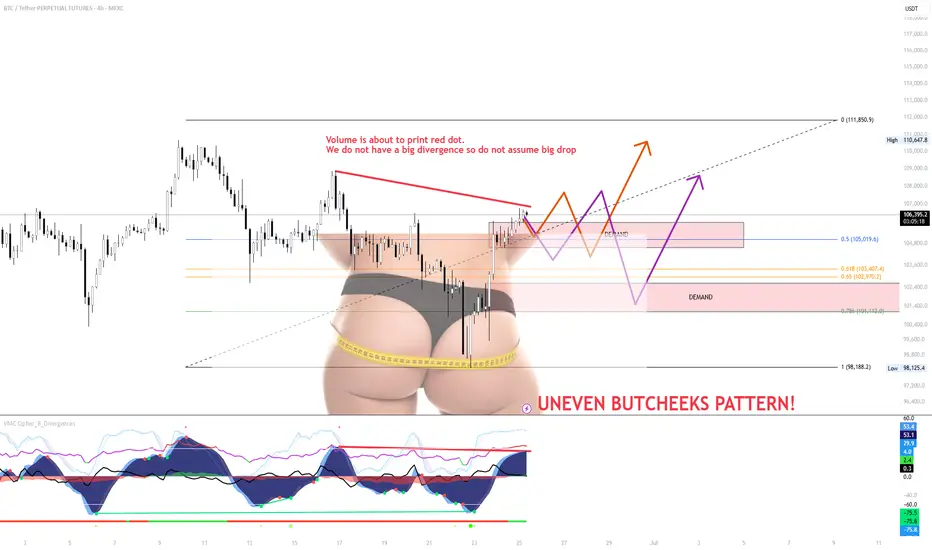
SMALL RETEST on BTC and continuation of BTC TrendThe small range forming just under local resistance is weak and showing signs of exhaustion. Despite a possible red dot printing soon, volume is not confirming a strong bearish divergence, so don’t assume a major drop is guaranteed just yet.
The “Uneven Butcheeks” pattern visually highlights imbalance
A fakeout back into the range, or
A flush to grab liquidity sitting beneath key demand zones.
Key Scenarios
Scenario A (Orange Path)
A breakout through the overhead supply zone could trigger upside continuation toward $111,850.
But unless it’s backed by strong volume and broader BTC strength, I’ll be fading this move.
Right now, this doesn’t look like conviction from bulls — it looks like exhaustion.
Scenario B (Purple Path)
A rejection at current levels or a weak fakeout could break back into the demand zone.
With thin structure below and low buy-side aggression, price could sweep down toward $102.9k–$101.1k, or even lower.
If we get this move, I’ll be watching how buyers behave around the lower demand — that’s where bulls need to prove themselves.
⚠️ Strategy:
Don’t front-run this — let the price confirm or invalidate.
Watch volume. Watch BTC dominance.
Until then, this zone is chop-heavy, and patience = protection.
Bitcoin breakout is very closeBitcoin looks like it wants to break above its resistance and push upwards. My prediction still stands of 150-165k as cycle top.
Resistance levels (based on fib extension)
121.5k (0.618)
136k (1.00)

[SeoVereign] BITCOIN Bearish Outlook – July 9, 2025We are the SeoVereign Trading Team.
With sharp insight and precise analysis, we regularly share trading ideas on Bitcoin and other major assets—always guided by structure, sentiment, and momentum.
🔔 Follow us to never miss a market update.
🚀 Boosts provide strong motivation and drive to the SeoVereign team.
--------------------------------------------------------------------------------------------------------
Hello.
This is SeoVereign.
As of July 9, 2025, I present a bullish outlook on Bitcoin.
This idea is an extension of the analysis posted on July 6.
Therefore, it will be easier to understand this analysis if you first read the July 6 idea.
The position reached the second target price and then showed a downward movement.
In this idea, harmonic 0.382 and 1.618 patterns have been additionally identified, and accordingly, I plan to continue holding the long position entered from the July 6 entry point.
The average target price has been set around 109,150 KRW.
I will continue to track the situation, clarify the rationale, and provide updates through this post.
Wishing you continued good fortune.
Sincerely,
SeoVereign

BITCOIN BITCOIN ,instead of forecasting the price movement, i will follow its price action,
break of the current supply roof on 3hr is a buy confirmation and target will be 115-117k and if we retest and fail to break the descending 3hr supply roof we are selling and target will be 94k (ema+sma ) strategy 4hr demand floor and aggressive sell will be around 90k zone .
NOTE ;everybody is a good trader ,but not everyone is patient enough to wait for a free trade.
trading is 100% educated probability ,don't take it personal.
focus on learning ,rather than how rich you want to become overnight.

BTC — Major Resistance & Long TP Zone1. TP longs in red resistance zone (110k–111k)
2. Watch for rejection: possible short setup on bearish reaction
3. Key support at 105k — monitor for bounce
4. If price holds above red zone, scenario invalid — look for breakout

BTC - Probable SHORT Scenario My main trading principle is that the price always moves from swept liquidity levels to untouched liquidity levels.
In particular case we clearly can see the following context: price swept 1M key liquidity level and left untouched level lower + forming LTF range.
But to take more statistically probable trades we should wait for some type of lower timeframe confirmation, and in this case we should wait for MSB or reaching 0,5 range mean
Your success is determined solely by your ability to consistently follow the same principles.
BTC-USDT Market Analysis for the Last 24 Hours
Hello, crypto enthusiast! 👋 Let’s see what has been happening with Bitcoin over the past 24 hours!
🔍 Price Action
Bitcoin dipped slightly during the day, sliding from ~108,970 USDT to a current price of about 108,166 USDT. That’s a decline of roughly 0.7 %—nothing too dramatic for the crypto market! 😉
📰 Hot News
• John Bollinger (renowned technical analyst) said that “Bitcoin is close to a breakout”; many analysts remain upbeat despite the small pullback.
• South Korea is seeing explosive crypto-market growth: total capitalization has topped $74.8 billion, and daily trading volume has reached $10.7 billion—higher than on the country’s two main stock exchanges!
• Fun fact: Korea’s well-known “kimchi premium” means crypto prices there can run about 10 % above global levels due to strong local demand. 🌶️
📊 Technical View
During the last 24 hours BTC traded between $107,393 and $109,048. Volumes were especially heavy from 21:00 to 22:00 on 7 July, when more than 100 million USDT changed hands.

BTC Price Prediction Price breaks down from inside the channel and turns bullish from a point between 106500 (very high probability) and 102500 (low probability).
Volume Weighted Average Price
Classical Technical Analysis
Rising Wedge Formation
Elliot Wave - Correction Wave
Pitchfan
Harmonic - Potential Bullish Gartley
Smart Money Concept
ICT

Bitcoin Prepares for Upward MoveBitcoin has formed a flag pattern, indicating consolidation at a structural base. A confirmed breakout on the daily chart would strengthen the case for a continued upward trend.

BTCUSDT | 30-min & 4H Outlook🔍 Structure & Price Action
BTC is trading within a rising wedge (blue lines) nearing apex — typical bearish setup.
Price is repeatedly getting rejected near macro trendline (~108.8K–109K).
30-min shows clean breakdown from lower wedge support, retesting the zone now.
On 4H, BTC is still under key resistance zone between 109.6K–110.4K, previously rejected twice.
🔻 Bearish Signals
Multiple Sell signals on both timeframes.
Bearish divergence visible in RSI and MACD on 4H.
Volume spike on the breakdown → confirming sellers in control.
🔑 Key Levels
Support: 107.7K (current zone) → loss opens path to 106.6K, then 104.4K.
Resistance: 108.9K–109.4K = confluence of EMA cluster + macro TL + Fib zone.
📊 Indicators (4H)
RSI dropping from mid-zone (~48), no bullish momentum
DMI shows increasing ADX with -DI over +DI → trend strengthening bearish
TSI & Wave Trend both curling down
Stochastic in overbought, starting to reverse
🎯 Summary
Bias: Bearish below 108.6K
Invalidation: Bullish breakout above 109.6K + volume close
Setup: Watch for retest and rejection at ~108.4K–108.6K = clean short trigger
Next Targets: 107.2K → 106.6K → 104.5K
