HolderStat┆BTCUSD forming the triangleBINANCE:BTCUSDT has reclaimed the $106,000 support and broken out of a triangle structure. The path now leads toward 111K, a major resistance zone. Similar setups have triggered strong rallies before, and bulls are defending levels aggressively.
BTCUSDT.PS trade ideas

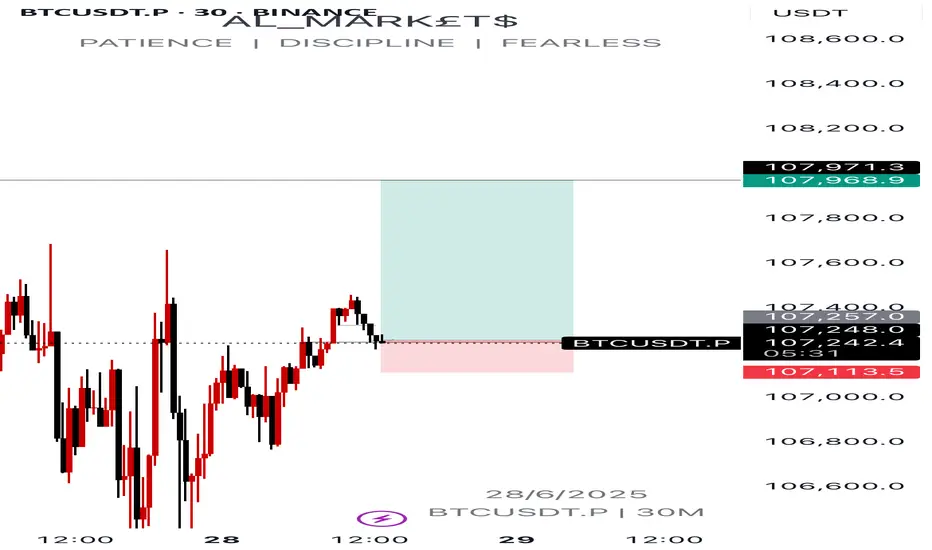
BTC LONG TRADE BTC LONG TRADE
ENTRY : 106398.1
PROFIT : 107512.7
STOP : 106028.8
ALL trading ideas have entry point + stop loss + take profit + Risk level.
hello Traders, here is the full analysis for this pair, let me know in the comment section below if you have any questions, the entry will be taken only if all rules of the strategies will be satisfied. I suggest you keep this pair on your watchlist and see if the rules of your strategy are satisfied. Please also refer to the Important Risk Notice linked below.
Disclaimer

BTCUSDT.P potential short term buysCurrent price action is pointing out to potential short term buys on btc.
BTCUSDTHi snipers. On the one-day timeframe, we are witnessing the formation of a harmonic pattern called a flag. This pattern usually forms in the middle of a trend and then the previous trend continues. The flag consists of two parts: a bar and a flag. In the flag, the price is moving in a channel between two parallel lines. If the price breaks through and crosses the upper ceiling of the channel, we will probably reach new prices. I am practicing and learning. This is not a buy or sell offer.

Called The Bottom GuysThem: "How did you call the start of the Rally?"
Me: ...
#crypto #bitcoin #trading #portfolio
BTCUSDT: Bullish Outlook Following Liquidity Sweepnavigating around pivotal areas defined by Breaker Blocks (BB) and Fair Value Gaps (FVG) on both the 1-hour and 2-hour charts. These zones represent high-probability areas for market reactions, whether as support for continuation or as points for potential short-term retracement before a larger rally.
strongly favors a bullish continuation for BTC. monitor interactions with the identified BB/FVG zones for optimal entry points, anticipating a potential dip to sweep short-term BSL or mitigate imbalances before the next significant leg up.

Bitcoin (BTCUSDT) Market Update – DailyBitcoin remains in a tight range between $110,221.73 (resistance) and $101,546.27 (support). These two levels are the main reference points for initiating high-probability trades.
🔸 Market Context:
The primary trend is bullish, so the priority remains on long setups.
Short positions should only be considered below $101,546.27 with confirmation.
With the prevailing bullish structure, early entries can be taken with a low-risk trigger at $108,746.08.
🔸 Moving Averages & Momentum:
The SMA 7 has caught up with the daily candles, but we haven’t seen a strong reaction yet.
If today's candle wicks above the SMA 7, we can more confidently pursue long setups starting tomorrow.
Otherwise, we may see a pullback toward the SMA 25, especially given the decreasing volume typical of ranging phases.
🔸 Lower Timeframe Setup (1H/4H):
A micro range box can be observed between $108,746 and $106,649.78.
If price approaches $108,746 with increasing volume, that can serve as a valid long trigger on intraday timeframes.
⏳ Final Note: Patience is key while BTC trades inside this range. The bullish structure remains intact, and opportunities for long trades are more favorable for now. Wait for clean breakouts or volume-based confirmations before entering new trades.
#BTCUSDT #BitcoinAnalysis #CryptoUpdate #BTCPrice #CryptoStrategy #BitcoinRange #LongSetup #TechnicalAnalysis #TradingView

MONDAY - TRADE OF THE DAYFew nice plays over the weekend shame I am not active on weekends.
I will be posting a video later today so see you in class!

BTCUSDT 30min Breakout Watch | Micro to Macro AlignmentSummary
Bitcoin is showing a classic multi-timeframe confluence setup. On the weekly chart, BTC is holding above key EMAs with bullish continuation patterns. The daily chart shows a breakout from a descending triangle, while 4H and 30-min charts confirm a narrowing price wedge inside a larger compression zone. Momentum is rising, but volume remains subdued. A confirmed breakout above $108K may trigger a measured move toward $114K–$118K, while a breakdown below $105K could lead to deeper retracements.
BTC 30m chart forming a tight triangle with bull flag structure inside.
Price hugging EMAs, RSI ~52, Kalman flipped green, ADX ~23 = prepping for move. Breakout above $107.6K can push fast to $108.3K+. Breakdown below $106.6K weakens structure.
Scaling out
4H: Descending wedge with bullish RSI divergence, ADX rising, support at $104.5K.
1D: Breakout from falling wedge, reclaiming EMAs, but needs volume.
1W: Bullish flag breakout setup; EMAs aligned; RSI > 57, room to run toward $114K if $108K clears.
Watch volume confirmation across timeframes for trend validation.

HolderStat┆BTCUSD ready to break through the resistanceBINANCE:BTCUSDT has completed another consolidation breakout and is coiling near key resistance. The price action points toward a move to 114,000 if the 102,000 level holds and volume confirms the continuation trend.

BTCUSDT - UniverseMetta - Signal#BTCUSDT - UniverseMetta - Signal
D1 - Formation of the 3rd wave + potential exit from the channel. Stop behind the minimum of the 2nd wave.
Entry: 107481.70
TP: 111110.12 - 115670.15 - 119641.79 - 126457.32
Stop: 104882.98

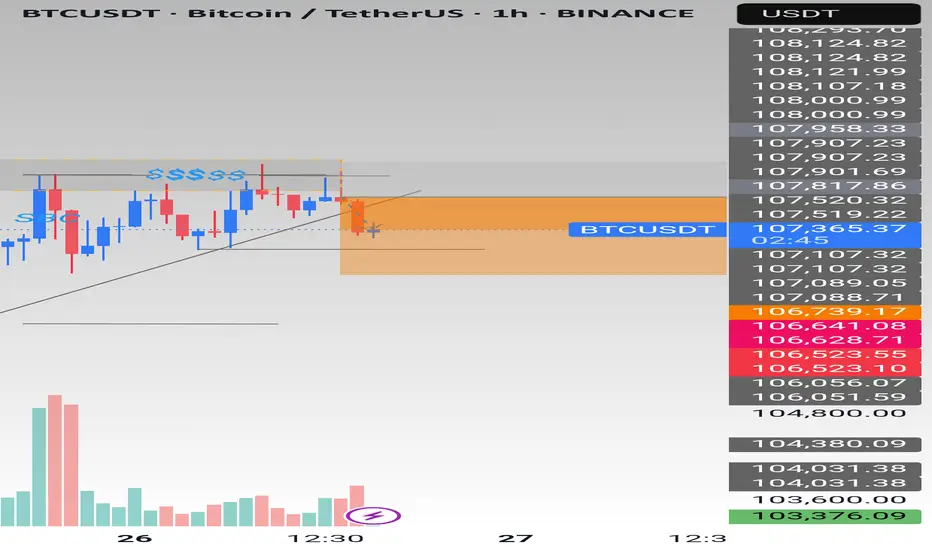
BTCUSDT analysis - 1H FVG and OB SetupsBitcoin has reacted cleanly to all marked zones so far.
Right now, we are waiting for price to reach the green circle area before making a decision. If we get confirmation on lower timeframes, we can look for a potential short setup on BTC.
Key zones are marked on the chart. Always wait for price to reach these levels and take your reactions on lower timeframes for precise entries.
Stay patient and let the chart come to you.
—
📊 ProfitaminFX | Gold, BTC & EUR/USD
📚 Daily setups & educational trades
📱 IG: @profitamin.fx

BTCUSDT Trade SetupBTC Still in sideways no major move, wait for the entries. While on weekly tf still expecting a final shakeout, 95-93k then a final leg up towards to 120k. For now wait for the entries to be filled first then must use sl.

2/1/15I promised to update the idea of what will happen with the graph in the future. At 22 cm, we should now fall down.

Btc usdt 1-3-6-12 mouthAnalysis of Bitcoin's movement for the near future. For 1-3-6 months. Based on candlestick and technical analysis

BTC UP OR NO📈 Bitcoin to Reach $113K, With a Breakout Path to $120K – A Professional Outlook
After analyzing the macro trend, technical structure, market sentiment, and on-chain behavior, I strongly believe that Bitcoin is on a clear trajectory toward $113,000, with a potential extension to $120,000 if key resistance is broken.
---
🔍 1. Technical Analysis Perspective
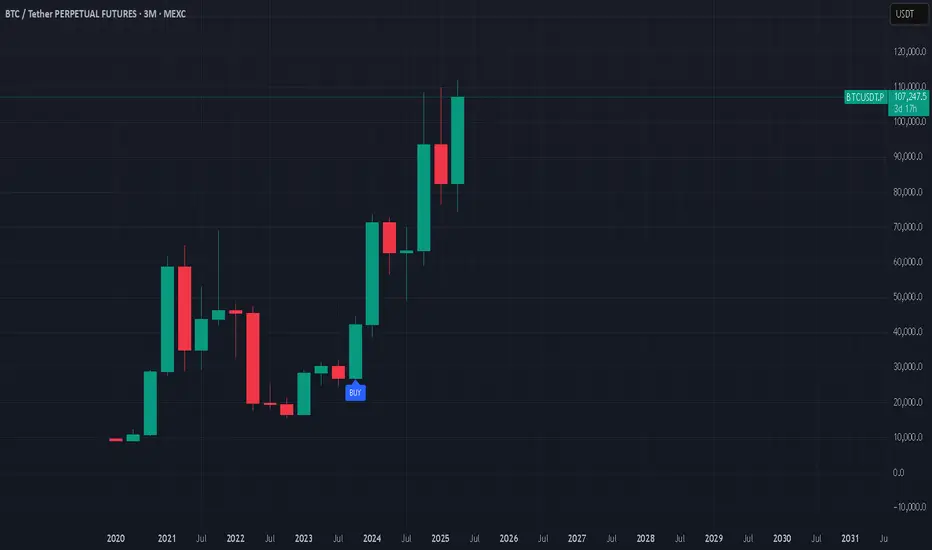
Macro Bullish Structure: Since the 2022 bear market bottom, Bitcoin has maintained a consistent higher highs and higher lows pattern, confirming a long-term uptrend.
Fibonacci Extension: The 1.618 Fibonacci extension from the $15.5K bottom to the $69K peak gives a projected target of around $113K.
Historical Fractal Patterns: In previous cycles, Bitcoin has always broken past previous all-time highs by 1.5x to 1.75x, placing this cycle's peak in the $110K–$120K range.
Ascending Triangle Breakout: On the weekly chart, BTC is forming a bullish ascending triangle with the top resistance at ~$73K. A confirmed breakout targets $113K as the next major supply zone.
---
🧠 2. Market Psychology & Cycle Timing
Halving Effect: Historically, Bitcoin peaks occur 9–12 months post-halving. The most recent halving was in April 2024, aligning a potential peak by Q1 or Q2 of 2025.
Psychological Resistance Zones: The $100K–$113K range is not only a Fibonacci target but also a powerful psychological barrier. Once breached, FOMO and institutional momentum could push BTC rapidly to $120K.
Retail vs Institutional Flows: Data shows increased ETF inflows and long-term holder accumulation — a classic pre-peak indicator.
---
🔗 3. On-Chain and Whale Behavior
Realized Price vs Market Price: BTC market price is well above long-term holder realized price, signaling bull market phase 2 (the steep climb).
Dormant Supply: Over 70% of BTC has not moved in 6+ months, showing strong holder conviction. This reduces sell pressure as price increases.
Whale Accumulation Zones: Whales are heavily positioned around $60K–$65K, and there is minimal sell volume above $100K on major exchanges, opening the path to $113K with low resistance.
---
🚀 Conclusion:
> Based on comprehensive technical patterns, market structure, psychological phases, and on-chain behavior, Bitcoin is highly likely to reach $113,000.
If momentum continues and $113K is breached with volume confirmation, a sharp move toward $120,000 becomes not only possible — but likely.

Sharing the advanced Bollinger Bands strategyHere are the Bollinger Band trading tips: *
📌 If you break above the upper band and then drop back down through it, confirm a short signal!
📌 If you drop below the lower band and then move back up through it, confirm a long signal!
📌 If you continue to drop below the middle band, add to your short position; if you break above the middle band, add to your long position!
Pretty straightforward, right? This means you won’t be waiting for the middle band to signal before acting; you’ll be ahead of the game, capturing market turning points!
Let’s break it down with some examples:
1. When Bitcoin breaks above the upper Bollinger Band, it looks strong, but quickly drops back below:
➡️ That’s a “bull trap”—time to go short!
2. If Bitcoin crashes below the lower band and then pops back up:
➡️ Bears are running out of steam—time to go long and grab that rebound!
3. If the price keeps moving above the middle band:
➡️ Add to your long or short positions to ride the trend without being greedy or hesitant.
Why is this method powerful?
It combines “edge recognition + trend confirmation” for double protection:
1. Edge Recognition—spot the turning point and act early.
2. Trend Confirmation—wait for the middle band breakout and then confidently add positions!
You won’t be reacting after the fact; you’ll be ahead of the curve, increasing your positions in the trend’s middle and locking in profits at the end. This is the rhythm of professional traders and the core logic of systematic profits!
Who is this method for?
- You want precise entry and exit points.
- You’re tired of “chasing highs and cutting losses.”
- You want a clear, executable trading system.
- You want to go from “I see the chart but don’t act” to “I see the signal and take action.”
Follow for more. Make sure to like this if you found it useful.

HolderStat┆BTCUSD broke the trend lineOKX:BTCUSDT on the 3h chart is accelerating from a breakout above $104,000 after several consolidation phases. Price is approaching $109,000 resistance. A breakout above this could trigger a run toward $112K+.

BTC SELLIn higher Time Frame Poi zone Tap and Nd Also Liquidity Swift in that zone I plan to sell here first Target 106000.
$BTCUSD: Bull or bear?Choose your adventure gents...
If price breaks up today, it can ignite a daily timeframe trend signal pointing to a rally towards 114k within a few days.
If it breaks down, it will hit 96k within the next two weeks.
I've taken steps to reduce risk but I still trade futures actively in crypto pairs. There's good alpha in my long/short trading system and screening criteria, so I am comfortable trading it actively.
Current techo/fundamental juncture is risky, the way I see it, so if you haven't, maybe consider taking some profits, getting rid of leverage, trailing stops higher, etc.
Definitely not a time to be complacent with record exposure to US stocks from the public and foreigners, Gold hitting levels where it can purchase the same $ in real estate as in previous tops (1980, 2011), and companies buying into crypto to pump their failing business' stocks...to name a few red flags. There's some merit in long term bullish variables, but we might face some technical difficulties before that can materialize, and I rather be prepared by reducing risk in my long term exposure and max drawdown tolerance variables in my positioning and general strategy.
Best of luck!
Cheers,
Ivan Labrie.

Here is an analysis of the latest Bitcoin market trendBitcoin has surged to around $106,700 at its peak and hovered around $104,800 at its low. Overall, the trend remains relatively stable, continuing to stay at a relatively high level. What is driving the market?
First, institutional funds have flowed in again. Recently, many investors have bought Bitcoin through ETFs, with substantial capital inflows, which has formed support for this price level.
Second, the technical outlook is promising. Various technical indicators suggest that it is still a bullish market, meaning the price may continue to rise.
Third, regarding support and resistance levels: if the price declines, it may first find support near $104,000. If it breaks upward, the next target is roughly between $108,000 and $110,000.
What about the short-term trend? If it can break through $107,000, it may then surge toward $109,000 or even the high of $112,000. If it fails to break through, it may fluctuate repeatedly within the range of $104,000 to $106,000 for a period.
you are currently struggling with losses,or are unsure which of the numerous trading strategies to follow,You have the option to join our VIP program. I will assist you and provide you with accurate trading signals, enabling you to navigate the financial markets with greater confidence and potentially achieve optimal trading results.
Trading Strategy:
buy@104300-104800
TP:107000-107500

BTC massive sell BTC massive sell is about to begin
Wait for confirmation
Buyers are active in the supply zone
Watch out for potential turning points
To the down or upside.
Proper risk management is advised
Happy trading.

BTC Just Breakout! Are we ready for new ATH? BTC just breakout from 4h trendline and anticipate for any retracement soon before sky rocket into new ATH, historically saying my target will be on $148k.
NFA!!
DYOR!!
