Do you think it supports this model?After two weeks away from you, I am back.
Hello friends, as some of you dear ones know, I live in Iran, and due to the two-week war in Iran, I was not in the mood for analysis, nor was the internet helpful.
But I came back to you so that we can identify the profits together.
.
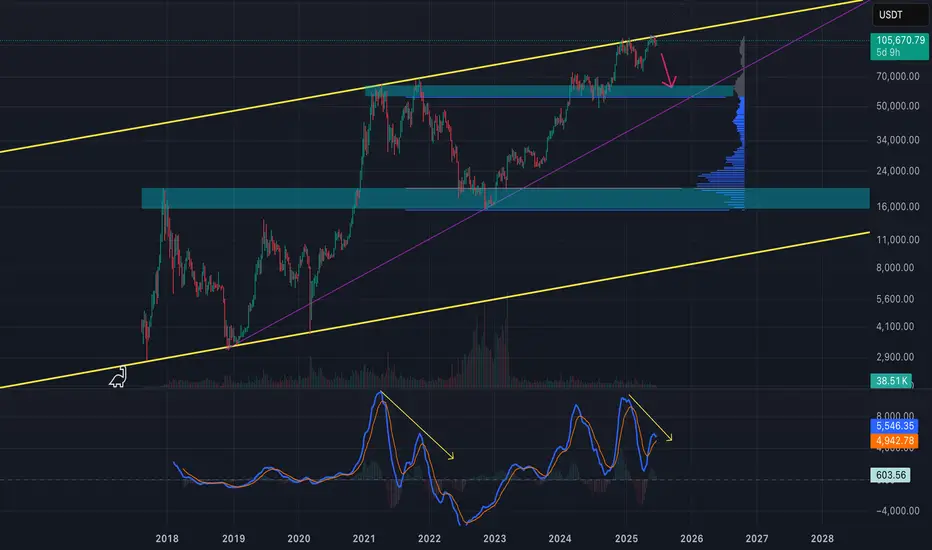
The chart you see has formed an old pattern (flag pattern), and if it breaks out of this pattern from above, we can expect an increase as large as the previous lag.
The target of this increase is the area that we had mentioned in previous Bitcoin analyses. (You can enter the page and look at the analyses)
.
I hope you have used this analysis well.
I wish you complete peace wherever you are.
You can follow the page to see more analyses, hoping for good days.
BTCUSDT.PS trade ideas

Red Alert For Intrday Selling #bitcoinHello trader's
This is your Red Alert level only for today intrday selling...

BTC: One More Leg Down?
I believe the impulse BINANCE:BTCUSDT BITSTAMP:BTCUSD BINANCE:BTCUSDT.P from April to May has been completed, and we are currently in a correction phase, which is likely to continue for some time.
In the base case, I’m considering a simple zigzag pattern:
Wave A – impulsive move down
Wave B – forming a symmetrical triangle
Wave C – expected next
🎯 Target zone: 97,500, where we have a confluence of weekly FVG, 20-week MA, and vWAP.

BTC - Getting 2021 Double Top/Bearish VibesLooking at the weekly chart for BTC, I'm seeing similar price action from when we double topped in 2021. We hit the top of the channel, corrected, and then had a slightly higher high before going down hard. Again we hit the top of the channel, had a strong correction, only to hit it again for a slightly higher high. But the signs of market weakness are showing in the indicators and price action. Not to mention war is looming between Israel and Iran. I'm taking a defensive posture here. I think if the bears take control, we could hit the $60k liquidity area that we missed on the last correction. We can reassess the market better at the time based on the price action and current events.
BTC - Key Level Being TestedRight now BTC is fighting a pivotal level in its current trend. After falling slightly below the $100k level price has seen a strong uptick after a 4H reversal doji was created at the bottom of the trend.
Now price is at the $105k level which has shown lots of volume with flips between support and resistance. What we are watching for now is our red "Upper Resistance Trendline". The level is currently around $109k.
If we see a rejection of that level then it would show the bears are still in control and the momentum to the downside will continue. If we can close candles above the red trendline we could see a swift move back to our white trendline and a break of that could see a strong surge to new all time highs.
If we see the current uptrend start to fade and price close below our 0.236 fib that could be an early indication of lower levels needing to be tested. If we do start to fall rapidly the most important level to hold to keep the macro uptrend intact is the 0.618 fib level. Currently this level is around $88k and if that level would be flipped into new support it would be the best level to create a macro higher low.

BTC at Decision Point: Symmetrical Triangle Breakout Incoming ??BTC is now trading within a symmetrical triangle, bouncing strongly from the trendline support at $98,898, and now faces overhead resistance of around $106,000.
Price is moving between higher lows and lower highs; a breakout in either direction could trigger a significant move.
Key Levels:
Support Zones:
$101,409 – Near-term support
$98,898 – Strong ascending trendline support
$93,343 – Critical structure base
Resistance Zones:
$105,807 – Immediate ceiling
$106,057 – Triangle breakout point
$108,895 – First major upside target
$111,785 – Higher target if bulls take control
Analysis:
The structure shows clear compression, and BTC has already made a sharp bounce off the lower range, suggesting bulls are stepping in. However, a clean breakout above $106K is needed to confirm the momentum shift.
A breakout above this triangle could lead to a fast move toward $111K, while failure could send the price back toward $101K or even lower.
This is a make-or-break zone.
DYOR | Not Financial Advice

Bitcoin (BTC/USDT) – Bearish Breakdown in Play (4H)BTC has lost key support at $103,573 on the 4-hour timeframe, breaking down from the recent consolidation zone. The rejection from the lower highs and weakening RSI suggest more downside pressure ahead.
Technical Breakdown:
Support Broken: $103,573 (now acting as resistance)
Current Price: $102,246
Next Key Support Zones:
$101,410 (short-term bounce zone)
$97,340 – critical horizontal support
$93,343 – potential deeper flush area
Resistance to Watch:
$103,573 (retest = short opportunity)
$105,807 (major rejection zone)
Short Setup (Signal Style):
Short Entry: ~$103,500 (if retested)
Stoploss: Above $105,800
Targets:
TP1: $101,400
TP2: $97,300
TP3: $93,300
Final Note:
Trend remains bearish below $103.5K. Bulls need to reclaim that level fast or further downside becomes likely.
Not financial advice. DYOR.

Bitcoin Hits PRZ — Is This the Perfect Short Entry?Bitcoin ( BINANCE:BTCUSDT ) has entered the Potential Reversal Zone (PRZ) after a strong bullish impulse , testing the confluence of Daily Resistance(3) .
In terms of Elliott Wave analysis , the market seems to have completed a complex WXY corrective structure , with the recent rally likely representing the final wave Y . This makes the current zone highly reactive for potential reversal .
I expect Bitcoin to retrace toward the CME Gap($105,075-$105,055) and possibly continue downward toward the Support zone($104,380-$103,060) and Cumulative Long Liquidation levels if the sellers regain momentum .
Cumulative Short Liquidation Leverage: $107,568-$106,601
Cumulative Long Liquidation Leverage: $105,360-$104,784
Cumulative Long Liquidation Leverage: $103,937-$103,217
Note: It is better to look for short positions at the Potential Reversal Zone (PRZ) or if Bitcoin touches $104,780 before reaching PRZ. That is why I chose to label this analysis as ''Short".
Note: If Bitcoin can touch $107,620 , there is a possibility of breaking the resistance lines and increasing further.
Please respect each other's ideas and express them politely if you agree or disagree.
Bitcoin Analyze (BTCUSDT), 1-hour time frame.
Be sure to follow the updated ideas.
Do not forget to put a Stop loss for your positions (For every position you want to open).
Please follow your strategy and updates; this is just my Idea, and I will gladly see your ideas in this post.
Please do not forget the ✅' like '✅ button 🙏😊 & Share it with your friends; thanks, and Trade safe.

BTC ITS A TRAP Bitcoin is currently facing significant resistance at key technical levels and may be positioning for a potential sharp decline heading into Thursday, particularly as markets close and geopolitical tensions in the Middle East threaten to escalate.
Two key technical confluences support this thesis:
1. Bullish Gartley Harmonic Pattern: This setup is developing with highly precise ratio alignments, targeting a convergence at the Point of Control (POC) alongside multiple anchored VWAP levels. While the pattern typically involves a sharp decline, it often precedes a powerful reversal once liquidity is swept from the lows, making this a potentially attractive risk-reward inflection zone.
2. Failed Auction Structure: Price action has demonstrated an inability to sustain a breakout above the established fair value range, instead reverting back within the bounds of a parallel channel. This failed breakout—confirmed by a rejection at the upper end of the volume profile—suggests heightened probability of a move back toward fair value, marked in blue, which coincides with the POC and represents the market's most accepted / traded price.
We’ll observe how the setup develops from here.

Red or Blue?Hi there!
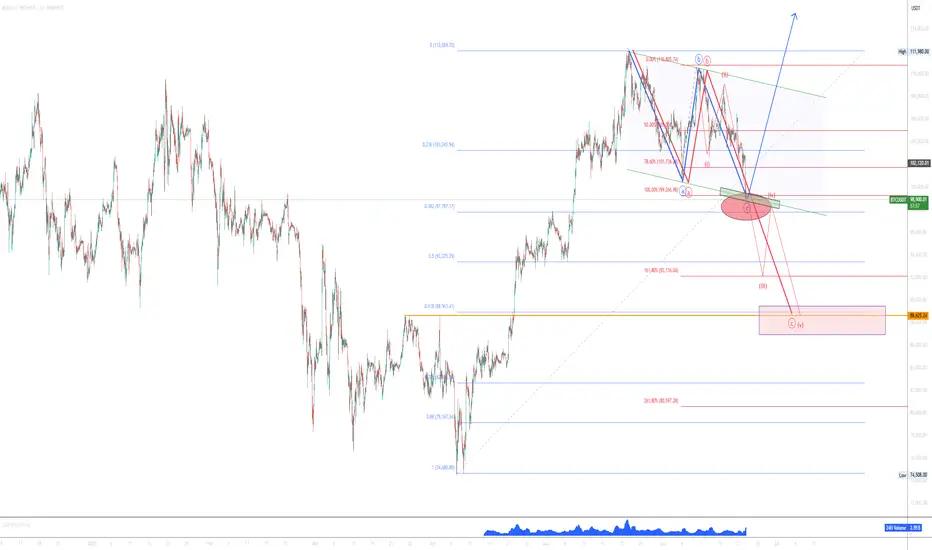
Price is at crucial level, and we have two high probability scenarios.
We have parallel channel and Fibonacci extension 100% now and Clear Blue ABC. Some rejection can happen from here to the upside or this is it and trend continuation can start!
Red scenario is deeper ABC to the cluster level of previous HH and Fibonacci 61.8 level little under Fibonnaci extension 161.8!
Good luck traders
BTC Loses Key Level — Will 100K Hold or Fold?Bitcoin has been locked in a range for the past 45 days, clinging above the critical psychological support at $100K. But cracks are starting to show…
Every bounce from the key level at $102,430 has been weakening — and now, for the first time, we’re breaking cleanly below it. Things are starting to tilt bearish.
So the question is…
⛏️ Will 100K be tested next?
🔍 Key Support Zone: $97.7K–$96.9K
Using the Fibonacci retracement from the swing low at $74.5K to the recent ATH, the 0.382 retracement lands at $97,655 — just below the $100K mark.
But there’s more…
Here’s why the zone between $97.7K and $96.9K is crucial:
0.382 Fibonacci retracement: A common pullback level in strong uptrends.
Anchored VWAP from $74.5K: Currently sitting around $96.9K, tracking cumulative volume-weighted average price — a key level.
Daily Order Block: Sits right at $96,887, aligning with the VWAP and reinforcing the area as demand-rich.
1.272 Fibonacci extension: From the previous move — providing another layer of confluence.
Fair Value Gap (FVG): The imbalance lies right in this zone. Price often fills these before continuing trend.
All of this stacks up to a high-probability long setup.
🕵️♂️ What to Do Now?
Set alerts at $100K and watch for a reaction. If price slices through, shift focus to the 0.382 Fib — monitor price action closely for signs of a reversal.
The first clean test of this zone could present a solid long — but as usual don’t trade blindly. Wait for confirmation.
_________________________________
💬 If you found this helpful, drop a like and comment!
Want breakdowns of other charts? Leave your requests below.

BITCOIN → Possibility of retesting 100K. Buyer weakeningBINANCE:BTCUSDT.P is in consolidation after the rally stalled due to the exhaustion of the bullish driver. The price updates local lows and starts looking at 100K
Bitcoin is under pressure after the escalation of conflict in the middle east and after the FOMC speech. There is also another observation: large companies, politicians, funds and investors have long and aggressively motivate the crowd to buy, verbally confirming that they bought dozens and hundreds of bitcoins at a time for the balance, but bitcoin is standing still and updating lows. At the same time, various services such as "cryptorank" fix bullish sentiment at the lows. The market either lacks liquidity or something more unpredictable is happening (chart drawing????)
Technically, bitcoin is following the behavior of the SP500 quite strongly, which closes Friday's session quite weak and close to key support, which could trigger a continuation of the decline. Bitcoin won't stay on the sidelines and could also follow the index....
Resistance levels: 104K, 105K, 106K
Support levels: 102K, 100.6K, 97.5K
The price is coming out of the “symmetrical triangle” consolidation breaking the support, thus confirming the bearish mood. After a small correction after a false breakdown of 102500 the price may again return to storm (retest) the level under market pressure, which will only strengthen expectations of further decline. The target is liquidity 100600 - 100K. From 100K rebound and growth is possible.
Regards R. Linda!

BTC ALL SET FOR ATH Price is forming a lower high and starting to roll over , this suggests bearish pressure is creeping in, Recent candles are showing smaller bodies and long wicks, indicating indecision and a potential slowdown in bullish momentum. BTC could test support zones 92,000 and show short term pull back but major trend is bullish from 84k zone , buckle up and watch it tightly.
Do you think I'm joking ???The price is currently forming the second corrective wave, and a slight price drop to reach higher levels is normal.
Best regards CobraVanguard.💚

BITCOINBINANCE:BTCUSDT.P Team bearish are not showing any signs of slowing down breaking every barriers. on these post i shared analysis on what i think that BTC is going to do next. All the best.

Everyone Talks Charts — But the Order Book Knows FirstHello, Traders! 🤓
Everyone watches the chart. But not everyone watches the market itself. If you’ve ever wondered why the price suddenly jumps or stalls just below resistance, you’re likely looking at the surface, not the structure underneath. And that’s precisely what DOM in trading helps to reveal.
What Is DOM Trading?
Let’s start with the basics. DOM stands for Depth of Market, which shows real-time limit buy and sell orders at different price levels. Some traders call this the trading DOM. Unlike a candlestick, which tells you what already happened, the DOM trading view shows what participants intend to do. This makes it useful for those trying to understand short-term moves, liquidity pressure, or even the psychology behind a specific level.
So if you’re asking, “What is DOM in trading?” or “How does DOM work in crypto?” – it’s essentially a live x-ray of the market’s limit order book.
Order Book Trading in Crypto
The order book, the live list of buy and sell orders, acts like a constantly updating roadmap of trader intentions. In order book trading, it’s not just the numbers that matter but how they shift. For example, traders often notice thick sell walls near round numbers (e.g., $70,000 BTC), sudden order pulls, which can fake out breakout traders, and absorption, where big buy/sell orders are filled silently, without noticeable price change… When analyzed properly, this behavior gives context to price action, something traditional indicators can’t always offer.
How to Use Crypto Trendlines… and Then Watch DOM
Drawing trendlines in crypto is common. Everyone has their version of a breakout setup.
But what happens when the price reaches that line? That’s where DOM trading shines.
It doesn’t predict whether the line will hold or break, but it shows whether liquidity is building or backing away right at the critical moment. The combination of crypto trendlines and DOM behavior often exposes subtle market dynamics, a large bid appearing just as price touches support, for instance, or offers vanishing before a breakout.
That’s not about strategy. It’s about market structure awareness, watching both the levels and the surrounding behavior.
Chart vs DOM: Two Sides of the Same Story
The crypto psychology chart tells you what’s happened — highs, lows, closes. The DOM, on the other hand, shows live trader psychology. And that’s where the psychology of crypto trading gets interesting.
When everyone’s waiting for BTC to hit $100K, for example, you might already see: Buyers are stacking bids at $95K, hoping for a retrace. Sellers layering offers at $99.9K, defending the level. And the sudden orders near $100K, a possible trap. In this way, round numbers in trading aren’t just emotional, they’re structurally significant. Especially in crypto, where the market cap is still heavily influenced by sentiment.
Final Thought
Some traders find it useful to spend a few sessions just observing the DOM. Psychological numbers in trading, like $10K, $20K, or even the famous 100K BTC milestone, are often surrounded by unusual order book behavior. So, the next time price seems to move “out of nowhere,” ask yourself: Was it really out of nowhere… or did the DOM in trading already whisper it?
You don’t need to trade based on it. But knowing how to draw trendlines in crypto and then pairing that with DOM behavior can offer a sharper view of where the market might hesitate, reverse, or run. Sometimes, seeing how others are placing their bets matters more than where. What do you think?

[SeoVereign] Bitcoin Bearish Outlook – June 22, 2025We are the SeoVereign Trading Team.
With sharp insight and precise analysis, we regularly share trading ideas on Bitcoin and other major assets—always guided by structure, sentiment, and momentum.
🔔 Follow us to never miss a market update.
🚀 Boosts provide strong motivation and drive to the SeoVereign team.
--------------------------------------------------------------------------------------------------------
Currently, Bitcoin appears to have entered a downward phase based on the counting criteria. A movement breaking below the S1 support line has been detected, which I previously mentioned as a signal to consider a mid-to-short term bearish trend.
From a trend perspective, a bullish reversal has not yet occurred. The reason is that on the 20th, when the 105550 level was broken upward, a strong momentum-driven upward move did not follow. If a true trend reversal had occurred at that point, there should have been immediate strong buying pressure without a whipsaw movement after the breakout. However, the market quickly reversed downward, indicating that selling pressure still dominates.
At that point, I was preparing a long idea, but as the bearish trend became clear, I chose not to upload it. At the same time, the 1.414 butterfly pattern I personally developed was confirmed, further supporting the continuation of the downward trend.
As a result, I have continued to hold the Bitcoin short position that began with the idea on the 11th, and I plan to provide further analysis and idea updates as market movements unfold.
I wish you sound judgment in the market and continued good fortune.

BTC - Key Battle Between Bulls and Bears – Symmetrical TriangleBitcoin ( BINANCE:BTCUSDT ) is currently consolidating within a Symmetrical Triangle , showing indecision among Bulls and Bears around the Support zone($104,380-$103,060) and just above the 50_SMA (Daily) .
From an Elliott Wave perspective, the current range may represent a WXY corrective structure . The market seems to be waiting for a breakout direction , potentially aiming to complete wave 5 after this correction.
The Monthly Pivot Point($103,300) and the presence of significant Cumulative Liquidation Leverage Zones (both Long and Short ) are key liquidity magnets to watch in the short term .
I expect Bitcoin to re-attack the Support zone($104,380-$103,060) AFTER breaking the lower line of the Symmetrical Triangle Pattern and decline to the targets I have outlined on the chart.
Note: Stop Loss: $106,703 = Worst Stop Loss(SL)
Please respect each other's ideas and express them politely if you agree or disagree.
Bitcoin Analyze (BTCUSDT), 1-hour time frame.
Be sure to follow the updated ideas.
Do not forget to put a Stop loss for your positions (For every position you want to open).
Please follow your strategy and updates; this is just my Idea, and I will gladly see your ideas in this post.
Please do not forget the ✅' like '✅ button 🙏😊 & Share it with your friends; thanks, and Trade safe.

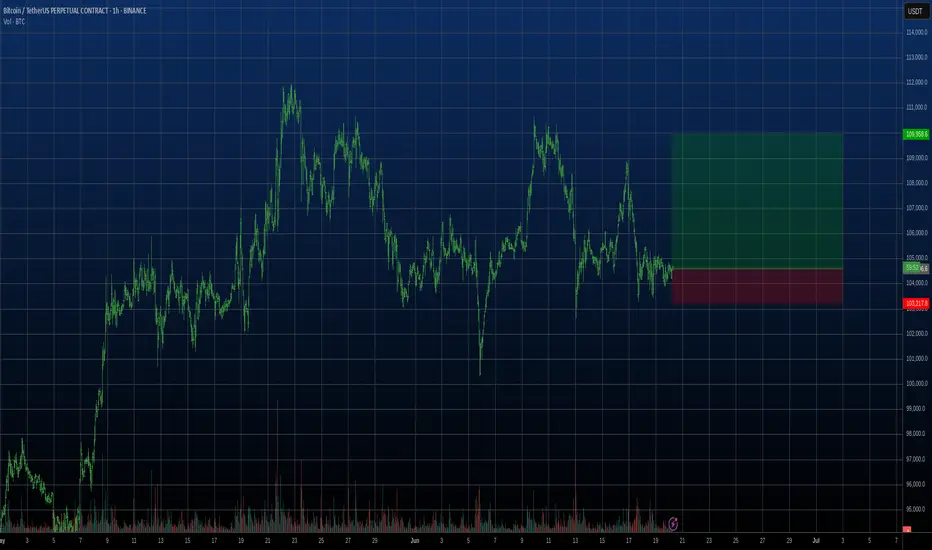
Good moment for try to Buy BTCGood moment for try to Buy BTC. Very good down movement and now we make small step of the up. This point can be point for start to move new up trend with update local highest high. Stop to previous local low bar. Will see...

BTC Flips Bullish Above $104k — 1D 50EMA & OB Cluster HoldCRYPTOCAP:BTC | #4h
Price reclaimed 1D 50EMA & $104k after a clean bounce from 1D FVG ($98k).
As long as $104k and the 4h OB cluster hold, lower targets are off the table.
Maintaining bullish bias toward $106k+.
Lose $104k? Bull plan is invalid, reassess for lower.

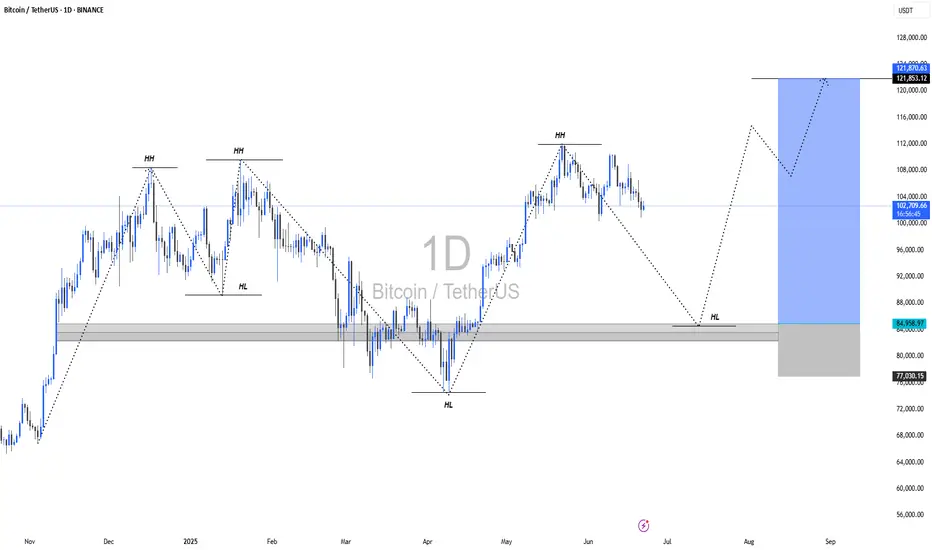
Bitcoin Poised to Reach 111500Bitcoin Poised to Reach 111500
Bitcoin faced a strong support zone for the second time during this month near 104K.
The pattern is taking a complex shape but overall remains supported by the Geopolitical situation as well.
During the last 5 hours BTC bounced from that zone showing a strong momentum and is poised to test the old structure zones again 107855 ; 108710 ;
The other important zones that may have more value are 110230 and 111500
You may find more details in the chart!
Thank you and Good Luck!
❤️PS: Please support with a like or comment if you find this analysis useful for your trading day❤️

Good moment for try to Buy BTCGood moment for try to Buy BTC. A good triangle has formed. There are prerequisites for its upward breakout. Very good risk/reward ratio. Stop below the triangle. Let's see...
BTCUSDT Short Setup Below Major Trendline ResistanceBTCUSDT is currently testing the upper boundary of a descending trendline, which has acted as strong resistance over multiple touches. Price is now at $106,300, a key area aligned with previous rejections and now forming a potential lower high within the structure.
This setup presents a short opportunity, with:
- A clear rejection level at the descending trendline.
- A defined Stop Loss at $108,270, just above recent swing highs and the upper trendline.
- A Take Profit target at $100,559, a level near the bottom channel and prior support.
Trade Parameters:
- Entry: ~$106,300
- Stop Loss: $108,270
- Take Profit: $100,559
- Risk:Reward Ratio: ~1:2.91
A breakdown from this level could trigger continuation to the downside, while a close above the trendline with momentum would invalidate the setup.
Bias: Bearish Rejection from Trendline
Confirmation: Strong wick or bearish engulfing candle near the resistance zone
