BTCUSDT.PS trade ideas

BTC - Isn't it obvious where it will go?BTC shorts not likely here - needs movement to top for further down momemntum!

BTCUSDT: Positive CDV Divergence for Potential Long Setups• Market Overview: Bitcoin currently sits at a pivotal point. Although the price movement has been somewhat indecisive, we’re watching closely for signs of bullish momentum.
• CDV Divergence Focus: Our attention is on a potential positive Cumulative Volume Delta (CDV) divergence. This takes shape when the price makes a lower low but CDV registers a higher low (regular bullish divergence), or when the price posts a higher low and CDV shows a lower low (hidden bullish divergence). These patterns can hint at growing buying interest even if price action hasn’t caught up yet.
• Support Zones (Blue Boxes): The highlighted blue zones on the chart signal potential support levels where buyers may step in. These are mapped from prior demand areas or structural support points.
• Trade Setup: Should a confirmed positive CDV divergence appear near or inside one of these blue zones, it could offer a strong case for a long entry. This would suggest that while the price may look weak, buying strength is quietly building underneath.
• Managing Risk: Any long entry must be accompanied by a well-defined invalidation level—typically just below the blue box support or the lowest point of the divergence.
Disclaimer: This is a technical pattern-based analysis intended for informational purposes only. Trading involves risk. Always perform your own due diligence and assess your risk appetite before entering any trades.

BTC - 4H chart - $105k KEY ZONE, up or we try again7/4
1. As long as price finds support above 105k, the structure remains to go up, breaking the bull flag to ATH.
2. Below 105k, bottom bull flag for support

BTC/USDT 4H Outlook - Bearish Setup playing outAs expected, BTC is now moving toward the 4H liquidity zone.
❗Price is breaking structure from the Daily FVG resistance, showing bearish momentum.
🔍 Current confluences in play:
— Rejection from Daily FVG
— 4H structure shift
— Clean imbalance below
🎯 My next key zone is 104K (4H liquidity)
Reaction there will guide the next move.
Stay tuned for more updates

Long IdeaI'm seeing a possible bullish cypher pattern forming for the mini blow off top for btc. This mimics the SPX500 and currently in lagging state. Ater that, it will go back around 50k - 60k area, probably to eliminate saylor out before going to the 240k - 280k region..

Final move by the bears? Bulls lining up for ATHHi traders and investors!
Buyers have reached the first target at 108,952.
On Binance spot, BTC missed the second target (110,530.17) by just 99 cents.
Is this a setup for a breakout and a run toward a new ATH?
So far, the price action looks like a level manipulation around 108,952: volume in all 3 bars interacting with this level is concentrated above it.
Just below lies a buyer zone (107,500 – 105,100).
I am watching for buyer reaction once the price reaches this area.
This analysis is based on the Initiative Analysis concept (IA).
Wishing you profitable trades!

BTC shorting opportunity comes againBTC climbed above 108000 again, and the short-term bullish power was slightly stronger. According to the current strength, BTC still has room for growth, but it is still under pressure in the 109000-110000 area in the short term; if there is no major positive news, BTC may find it difficult to break through the resistance area in the short term under the current conditions, and may even experience stagflation and retreat again after approaching the resistance area.
Therefore, I think shorting BTC with the help of the resistance area is still the first choice for short-term trading. We can boldly short BTC in the 108500-109500 area and look towards the target area around 106000 again.

BTC Weekly Analysis : Rise or Fall ? Let's SeeBy analyzing the #Bitcoin chart on the weekly timeframe, we can see that last week’s candle closed at $108,350, and BTC is currently trading around $107,500. If the price manages to hold above $105,700, we could expect further upside momentum. The next potential bullish targets are $111,700, $124,000, and $131,800.
So far, this analysis has yielded over 9% return, and we’ll be sharing more updates soon from lower timeframes!
🎥 If you enjoyed this video analysis and found it helpful, please show your support with a LIKE and COMMENT below!
These video-style breakdowns take time and effort, and I’ll only continue them with your support 🙌
Your engagement is my biggest motivation to keep going 💛
Thanks for being part of the journey!

BTCUSDT daily analysisia have shared one hour timeframe analysis and this is daily timeframe and i am following priceaction candle and volume with SMC and more my own personal and private strategies

Bitcoin Prepares for Upward MoveBitcoin has formed a flag pattern, indicating consolidation at a structural base. A confirmed breakout on the daily chart would strengthen the case for a continued upward trend.

Bitcoin long back to $110000Recently opened a long position on bitcoin. Aggressive entry. Soon I anticipate a push back up to 110000
4hr trend is still in tact. 1hr trend is bearish failed to make new LL.
Lets see how it goes.
2RR trade roughly.

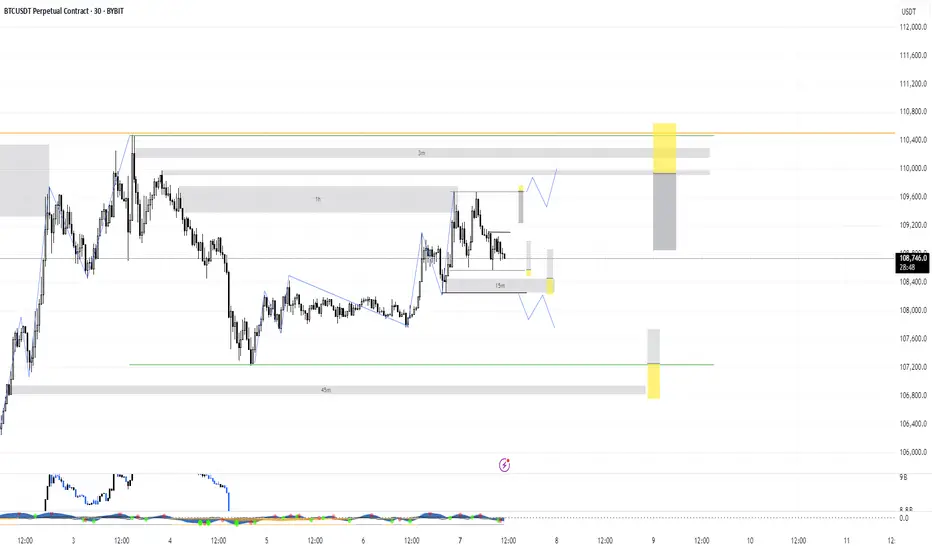
Monday - Trade of the day Hello I took a week off from trading — life got a bit hectic 🌀. Looking back, I actually needed that break from the charts 🧠💆♂️.
But we’re back this week! Let’s see how many X’s we can cream off the market 💸🔥
Here are the immediate levels I’m watching 👀 — mainly some range deviations from both internal and external ranges.
If we break either side of the range, I’ll be looking to enter from the last supply or demand zone for a continuation 🚀📉📈
That said, I’ll stay mindful of any supply and demand zones that could get in the way ⚠️📊
Let’s get it 💪📅
Long opportunity in BTC/USDT.PSThe 107963.44 level has already been broken. So we need to wait to retest the same level.
Reasons : -
1. 30 MIN BOS Breakout.
2. it retested the fibonocci 0.611 level.
Entry : 107963.44
TP : 109065.90
SL : 107415.57
Disclaimer : I'm not recommending to take this entry. Do with your analysis too.

$BTC/USDT daily chart $121K next.CRYPTOCAP:BTC just broke out of a descending wedge on the daily chart, a strong bullish signal.
It’s now holding well above key support and the 50-day moving average, showing buyers are in control.
If BTC stays above $106,400, we could see a move toward $121K next.
DYRO, NFA

Bitcoin is in a downward trend.Hello dear friends.
Considering the trend of Bitcoin, it is expected that this Bitcoin will fall to around $100,000.
❌Please note that this is just a prediction, so be careful with your capital.

BTC - Are you the one who is long?If yes! Book, Looks like a LIQ hump trap here! Wait for 105k smooth, or let it fall to retrace up to 109,860 to initiate!

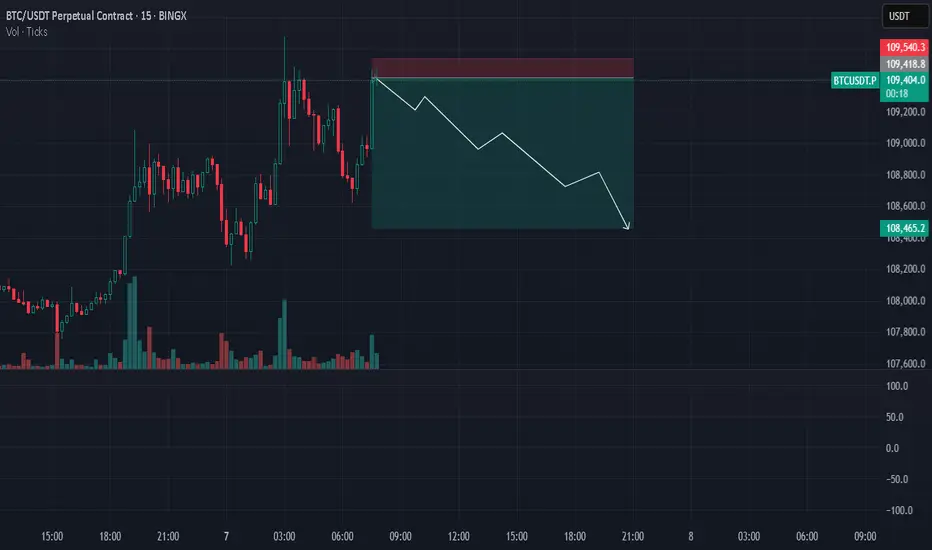
BITCOIN TOUCHED 110K — THEN REJECTEDNot what bulls wanted to see.
With massive gaps below, this kind of price action ain’t it.

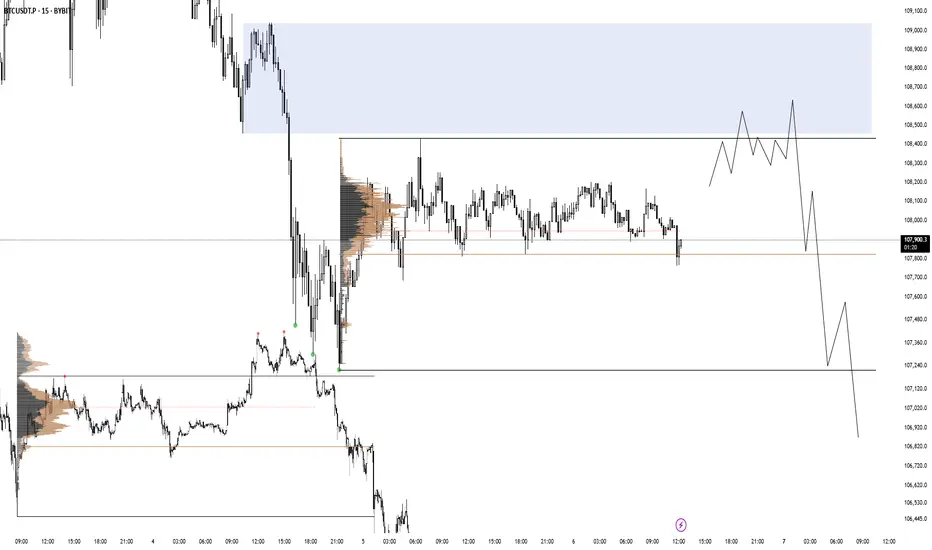
BTC 06.07.25There is a range imbalance with no price action in discount after BTC accumulated on friday afternoon. I am looking for a valid distribution like in the picture on the left.
break, BTC soon reaches new ATH💎 Update Plan BTC after NFP (July 3)
Notable news about BTC:
Bitcoin (BTC) recovered to $ 109,000 on Wednesday when the US agreement with Vietnam and the increase in global M2 supply of M2 money has promoted an increase in open interest rates (OI), soaring to 689.78 thousand BTC worth about $ 75 billion. The cryptocurrency market in general has increased the price along with BTC, with leading altcoins, Ethereum (ETH), XRP and Solana (SOL) increased by 7%, 3%and 4%respectively.
Bitcoin, the market cryptocurrency market increased by the trade agreement with Vietnam and M2 money supply soared
The cryptocurrency market has recovered on Wednesday, an increase of 2% to regain the market capitalization of $ 3.5 trillion.
Technical analysis angle
First, congratulate the investors who follow the plan when we previously traded according to the model and had a short signal at 108k and took profit and then Long in the 106k area.
Currently, BTC is in wave 5 and is trapped in the Fibonanci area of 2,618 golden ratio around the price of 109k, this is also the threshold of the price of investors who are under pressure before the price area goes to 112k
The 112k region is a psychological area of profit and will appear on the 109k sales situation before the BTC price may rise further in the last 6 months of the year.
Please follow the channel to receive accurate scenarios about gold and BTC /-Teart /-heart
==> Comments for trend reference. Wishing investors successfully trading

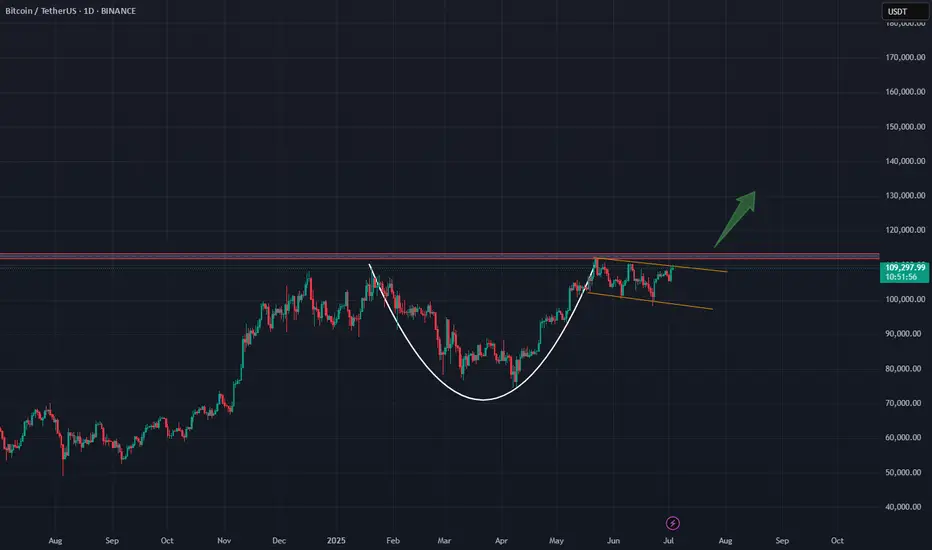
btc usdtbtc usdt
cup patern
I think my eyes are seeing correctly! After the breakout from above and confirmation on the red line, it will move upward.”
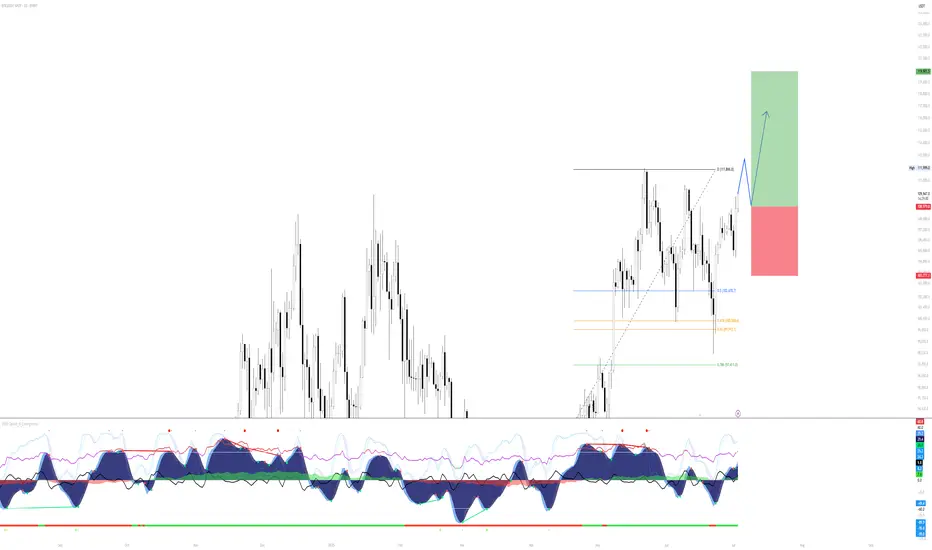
BTC/USDT Long Setup – Daily Bullish Continuation PlayMarket Context:
Bitcoin has reclaimed significant ground after a corrective phase and is now approaching prior highs. The current move suggests strength and potential continuation — but with overhead resistance near 111,866, a retracement or consolidation before continuation is likely.
Setup Idea:
The chart illustrates a bullish continuation scenario: price may push slightly higher into resistance, then retrace into a more favorable entry zone before targeting new highs. The Fibonacci retracement levels between 100,500 and 102,470 align with a high-probability demand zone for a dip buy.
Trade Plan:
Entry Zone: Await retracement into the 0.5–0.618 fib zone (102,400–100,500)
Stop Loss: Below 99,900 (beneath 0.65 fib and invalidation structure)
Target: 119,900 (clean extension above prior high)
Risk/Reward: Favorable multi-R setup based on macro continuation
Notes:
The setup anticipates a pullback before the next impulse. If BTC breaks through 111,900 with momentum and no retrace, the trade idea would shift to chasing on strength or waiting for consolidation above.
Momentum indicators on VMC show bullish pressure building, but overbought conditions suggest temporary cooling may occur.
Let the retrace come to you — and position accordingly on confirmation.