long trade
🟢 BTCUSDT – Buyside Trade
Date: Sunday, 15th June 2025
Session: NY Session PM
Time: 5:00 PM
Entry Timeframe: Precision Intraday Entry
Trade Parameters
Entry: 104,502.89
Take Profit: 105,567.08 (+1.02%)
Stop Loss: 104,377.60 (−0.12%)
Risk-Reward Ratio (RR): 8.49
🧠 Trade Reasoning
BTCUSDT showed a textbook liquidity sweep and recovery during the NY PM session, grabbing lows below 104,400 before swiftly reversing. The entry at 104,502.89 was taken on confirmation of short-term bullish structure reclaiming the range low.
BTCUSDT.PS trade ideas

Bitcoin 100K Support Intact, The Bulls Win!Lately we've seen many cries about volume. Where is the volume? There is no volume! Etc. I tend to agree. My excuse in favor of a bullish Bitcoin was to say that low volume as prices moved higher worked as a continuation signal, things change.
We are now looking at BTCUSDT on the Daily timeframe and what I can notice is trading volume being relatively high. The days with high bull (green-buy) volume, are sometimes two to three times higher than the days with bearish (red) volume. This signal seals the deals. The bulls win.
This is a chart drawing that I used in the past. We have the low 7-April low and a higher low 5-June. Very strong bullish action for two months straight; very little retrace, weak bearish action for several weeks, the bulls win again.
The consolidation zone, the accumulation range, is defined here with blue and green, we know the price to be $100,000 and $110,000, Bitcoin trades at the exact middle, above $105,000. Giving the bulls another win.
Yesterday the action produced a higher low compared to 5-June. Even with very bad geopolitical conditions, a surprise war, Bitcoin remains strong. If not even war can break 100K as support, this simply means that Bitcoin isn't going any lower, Bitcoin is going up.
The most revealing part is the fact that Bitcoin didn't even reach 100K. Not in 5-June, not yesterday. 5-June the low was hit at 100,386. Yesterday, the low was 102,656.
There is lots of demand, supply is limited.
People are buying the dip. Whales are buying, institutions are buying; the world wants Bitcoin. Price action says Bitcoin is going up.
We can extract supporting signals from the Altcoins, Ethereum, XRP and Dogecoin are good examples, all the big projects are strong now when we consider the fact they are trading above MA200 daily and weekly, and this confirms a bullish bias with long-term growth.
$150,000 is not the top, Bitcoin is likely to go higher by the end of the next bullish wave. We can consider prices such as $180,000 and $200,000. This is because nobody is selling. Since people are not willing to sell, prices are sure to increase. Many altcoins are now extremely bullish, small and big.
All market conditions are fully aligned, it is only a matter of time.
Patience is key. Prices will rise.
Namaste.

BTC Drops again ?
**Mastering Zones: Your Quick Trading Guide!**
Remember the core logic:
* **🔵 Blue Zone:**
* **PUMPS FROM BLUE** (Look for buys!)
* **DUMPS IF BREAKS BLUE** (Consider sells/exit longs!)
* **🔴 Red Zone:**
* **DUMPS FROM RED** (Look for sells!)
* **PUMPS IF BREAKS RED** (Consider buys/enter longs!)
Apply this to your charts for clear signals. Stay sharp!


BTC: Scalp Long 14/06/25Scalp Long
Risk is halved because weekend
Then additionally halved because counter HTF Trend =
0.25R Risk
Reason:
0.886 retrace
M5 EQL swept
M5 Ts
M15 Bull Div
H1 Bull Div
Still hoping we get a 106,700 retest. For HTF Higher probability shorts.

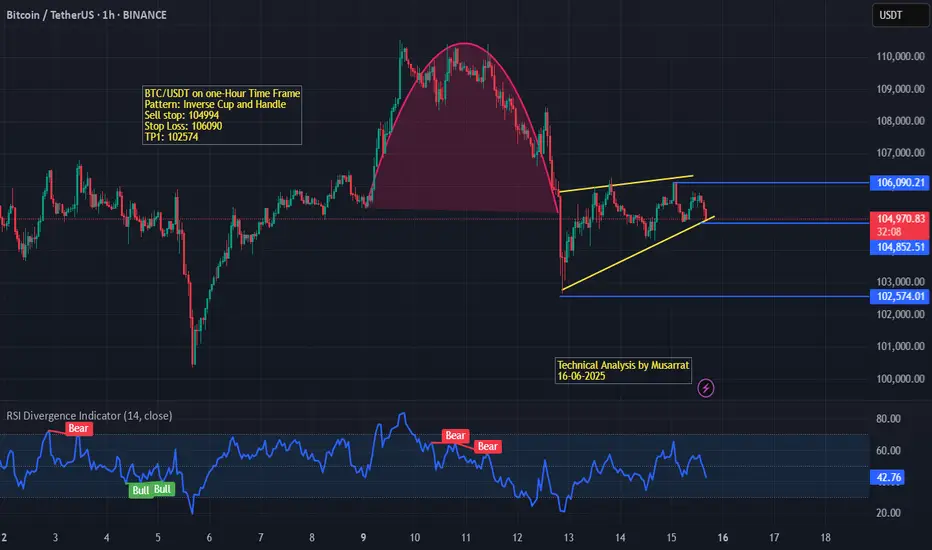
BTC/USDT on one-hour Chart ProjectionsThe chart illustrates a classic Inverse Cup and Handle pattern formation. The cup is clearly marked by a rounded top, indicating a reversal structure forming after a previous uptrend. Following the breakdown from the right rim of the cup, the price action has transitioned into a bearish consolidation, forming a potential rising wedge or weak bear flag – both of which typically indicate continuation to the downside.
Key Levels & Trade Setup:
Sell Stop: 104,494
Stop Loss: 106,090
Take Profit 1 (TP1): 102,574
These levels suggest a short-selling strategy with a favorable risk-to-reward setup targeting the breakdown of the handle portion of the pattern.
Indicators:
RSI (14, close) is currently at 42.95, which lies in the neutral-to-bearish territory.
Multiple Bearish RSI Divergences were signaled before the recent drop, supporting the short thesis.
Minor Bullish RSI signals were observed earlier but failed to sustain momentum above the 50 line.
Conclusion:
The technical structure, along with bearish RSI signals and pattern confirmation, suggests that BTC/USDT is likely to experience further downside, especially if price breaks below the 104,494 support. A breakdown from the current ascending structure could lead to the 102,574 support zone being tested in the near term.
BTC channels chart Here I provide you what I believe to be BTC channels down trend channels in terms of being bullish each dotted channel is median and all darken red are tops and bottoms currently we are at median level and as long as we hold this level we can get a bounce to top channel if not then targets of bottom channel it may not be clear the first time but trying channels can provide extra clarity and here’s my chart to witness the BTC breakouts since 2022


The FVG was the invitation. The OB was the entryBTC delivered exactly where it needed to. It didn’t break down. It rebalanced. The chart isn’t noisy — it’s speaking. And it’s pointing to 108.3k.
The logic:
Price printed clean displacement, returned to mitigate a 1H FVG stacked on top of a refined Order Block, then paused. That pause is structure — not indecision. Volume compression confirms it: absorption, not rejection.
A deeper OB sits below at 102.5k. If we tap it, it’s not invalidation — it’s refinement. But the primary play is already in motion.
The path:
Reclaim 105.7k range high
Break above intraday liquidity
Deliver to 108.3k inefficiency fill
Execution:
Entry: 104.8k–105.1k (current OB zone)
SL: Below 103.9k
TP: 108.3k
Don’t react to the candles. React to what they represent — engineered displacement followed by precision mitigation.
Final thought:
“This isn’t a trade setup. It’s a delivery route — and I’m already onboard.”

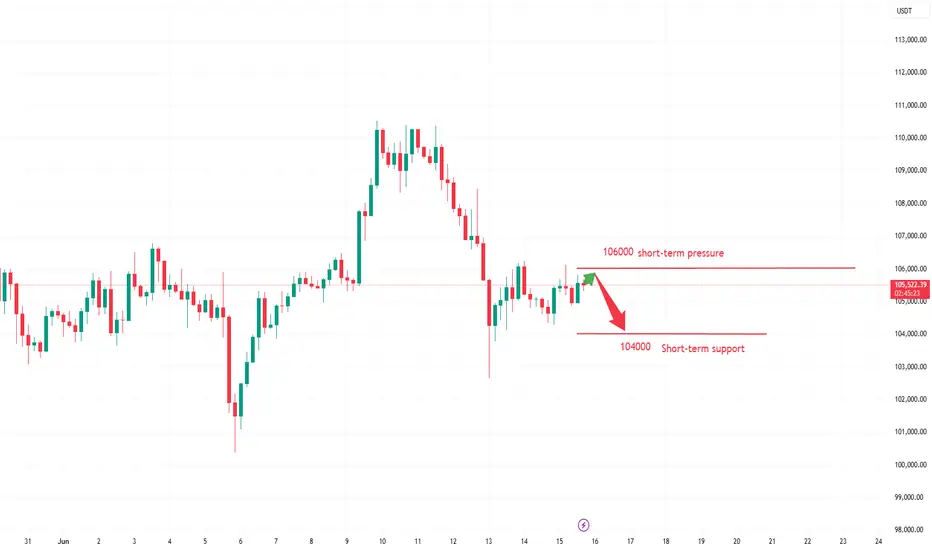
Analysis of Next Week's Market TrendsBitcoin is trading in a narrow range, with an intraday volatility of only 1.7% and trading volume shrinking by 18%, indicating market wait-and-see sentiment after key geopolitical events.
After the Israel-Iran conflict triggered $1 billion in liquidations, market panic has eased. Israel's preemptive strike on Iran on the 13th caused Bitcoin to flash crash to $102,000, but by the 15th, the market had partially digested the risks. The Fear & Greed Index stabilized at 60 (greed zone), showing that funds did not massively flee to safe havens.
Bitcoin is in a critical accumulation phase on the eve of a breakthrough. The digestion of geopolitical risks and institutional buying constitute supporting forces, but short-term attention should be paid to the risk of breakdown in the triangular pattern. It is recommended to strictly guard the defense level of $104,200 and the breakthrough point of $106,300.
Humans need to breathe, and perfect trading is like breathing—maintaining flexibility without needing to trade every market swing. The secret to profitable trading lies in implementing simple rules: repeating simple tasks consistently and enforcing them strictly over the long term.
Trading Strategy:
sell@105900-106000
TP:104000-1045000
My BTC Plan. First Pump, Then Dump?As always, I’m sharing my personal thoughts on what I expect from Bitcoin in the next few days. This is not financial advice just my outlook based on technicals, volume zones, and market behavior.
CME Bitcoin futures closed Friday at $105,715. Historically, CME gaps often get filled. So unless we see new geopolitical escalation between Israel vs. Iran on Sunday, I expect a fake pump on Monday toward the $108,500-$108,600 area.
That would be:
A 0.705 Fibonacci retracement from the recent low
A typical Monday move to trap shorts and create early bullish euphoria
Midweek Expectation: Dump to 4H FVG
After the fake move up, I’m anticipating a strong retracement down toward the 4H Fair Value Gap (FVG) in the $98,632 - $97,378 region. This area:
Contains heavy previous volume zones
Aligns with Previous Day Low, Previous Week Low
Holds multiple imbalances still unfilled
If the market receives negative news or sentiment breaks down quickly, I wouldn’t be surprised to see an even deeper move into the next 4H imbalance at $96,167 - $95,080.
Below that? There’s still a massive amount of untouched liquidity, including the Previous Month Low $93,322.
My Macro View: Scenario of Maximum Pain
I think the bottom of this Bitcoin correction will land somewhere around $87,300 – $86,000.. Why?
This would be a scenario of maximum pain
It’s a level where most investors will capitulate, especially in altcoins
If BTC goes that low, panic selling will trigger across the board
And ironically, this is how altcoin seasons always begin from disbelief.
Stay focused, stay safe. The volatility this week will be high, and smart positioning is key.

Reversal?I have to make a correction to my previous publication. Five waves had already been completed. This potential reversal therefore makes perfect sense at this point.

$BTC - Weekend LTF OutlookBINANCE:BTCUSDT | 4H
We've got a swing point retest here on the 4-hour timeframe.
Immediate resistance at 106k, but I'm eyeing the internal liquidity — the wicks on both sides.
Most likely it’ll fill the upper wick first (107.3k–107.8k). If we reject there again, we could sweep the lower wick around 103.5k–103k.

#BTCUSDTbearish side of the btc is slow, as the volume of sell is not that high...…any strategy doesn't fit the lower low, i am seeing btc to the 132k.
anyone overthere with a new different strategy regarding btc?

BTC is going to brake this lines and I it will go even higher BTC is going to brake this lines and I it will go even higher Then previous higher high . Watch closely for opening market on Monday . Anyways it will be big move long or short . Once it brake this two line .

Bitcoin in Mid-Term Uptrend, But Consolidating in Short-Term Ran📊 Bitcoin in Mid-Term Uptrend, But Consolidating in Short-Term Range
Bitcoin remains in a mid- and long-term uptrend, clearly shown by the white trendline on the chart. However, in the short-term, the price is consolidating inside a sideways range (highlighted in red).
If price bounces from current levels and starts pushing upward, it would confirm a higher low above the range support at $101,429, which increases the probability of an upside breakout. Otherwise, we could see another test of the range bottom.
The levels at $103,884 (support) and $106,258 (resistance) are not particularly strong, but can still be used for aggressive pre-breakout trades. Personally, I won’t enter trades at these levels just yet — I’d like to see more interaction and confirmation.
⚠️ Note:
Breakouts from this range are likely to be sharp and impulsive, regardless of direction.
For short setups, you could either wait for a breakdown of $103,884, or use a sell-stop below $101,429 — but I’m not taking shorts, as the overall trend remains bullish on higher timeframes.
On the long side, I won’t enter on a break of $106,258 unless we see a fakeout below $103,884, which would increase the probability of a successful long breakout.

BTC/USDTWhenever Bitcoin goes above 106k, we can enter a long position at the target I specified on the chart. What do you think? Tell me.

BITCOIN - Price can fall a little and start to move upHi guys, this is my overview for BTCUSDT, feel free to check it and write your feedback in comments👊
Price entered to rising channel, where at once bounced from support line and rose a little, and then corrected.
Next, price continued to move up and soon reached $100500 level, after which broke it and rose to resistance line.
After this movement, BTC corrected and continued to grow in rising channel and later reached $110500 level.
Bitcoin exited from rising channel, made a fake breakout of resistance level, and started to trades inside flat.
In flat, price tried to grow but failed and fell to support level and then grew back again, after which started to decline.
Now, I expect that BTC can repeat as move before, it falls a little and then grows to $110500 resistance level.
If this post is useful to you, you can support me with like/boost and advice in comments❤️

Technical Chart Analysis – BTC/USDT (4H Timeframe)📊 Current Price: ~105,108 USDT
---
🔵 Support Zone (Highlighted in Purple)
Zone Range: ~102,500 – 103,800 USDT
💡 Historical Significance:
This zone has acted as a strong support multiple times (📍June 13 & June 4), marking clear demand and buyer interest.
🛡️ Buyers stepped in strongly, causing sharp price reversals from this level.
---
🔴 Resistance Zone (Highlighted in Blue)
Zone Range: ~109,500 – 111,000 USDT
🔼 Marked with multiple failed breakout attempts (📍May 21 and projected again around June 18-20).
⛔️ Sellers dominate this zone, causing price rejection each time it was tested.
---
🔁 Rounded Bottom Formation (Cup Pattern?) ☕️
⚙️ A smooth rounded recovery pattern is forming, indicating accumulation and potential bullish continuation.
📈 If price sustains and retests the resistance again with momentum, we may see a breakout attempt.
---
🧭 Key Takeaways
Indicator Insight
🟣 Support Well-defined, historically respected zone. Good risk/reward for long entries.
🔵 Resistance Strong sell pressure zone. Needs breakout for bullish confirmation.
☕ Pattern Rounded bottom = bullish setup if volume supports the breakout.
📆 Watch Zone June 17–20 – potential resistance retest.
🔔 Risk Area Failure to hold mid-range (~105K) could lead to a retest of support.
---
🚀 Bullish Scenario
✅ Break and close above 111,000 USDT with volume.
📍 Target: 113,500–115,000 USDT 📈
🐻 Bearish Scenario
❌ Rejection at resistance again.
📍 Retest of support zone ~103,000 USDT or below.

BTC Buy Setup | Sniper Trading System - Reverse Play🚨 BTC Buy Setup | Sniper Trading System™️ Reverse Play Activated
What you’re looking at isn’t luck — it’s Sniper-level execution.
This BTC reversal trade was triggered by my Sniper Trading System™️, which identifies institutional-level liquidity traps, dealer ranges, and timing zones with precision.
🧠 Setup Highlights:
— Liquidity sweep below key support
— RSI confirming reversal from the Fade Zone
— Dealer Range low respected
— Reversal candle + structure shift = high-probability sniper entry
📍 Chart:
This is powered by my Jesus Saves™️ + Fade Reversal Combo, built into the Sniper Trading System Suite™️.

BTC/USDT Bullish Reversal Zone AnalysisSupport Zone:
The horizontal purple box (~104,000 USDT area) has acted as a strong support/resistance flip zone multiple times.
Falling Wedge Breakout:
The price action broke out of a falling wedge pattern earlier, confirming bullish momentum.
Flag Formation (Current):
A smaller bullish flag/pennant appears to be forming, and a breakout above could trigger a strong upward move.
Projected Move:
The black arrow indicates a potential bounce from this support zone, with the price targeting the 111,000–112,000 USDT zone (highlighted in the top purple box).
Volume Spike:
Notable volume spike near the bottom supports the idea of accumulation and possible reversal.
📈 Conclusion:
If the support zone holds and price breaks above the minor flag, a bullish continuation is likely toward the 111,000–112,000 resistance area. Traders should watch for confirmation of a breakout and volume increase for validation.

BTC - Short-Term market updateWe’re currently moving sideways between the ATH and $100K.
We’ve tapped into the short-term trend reversal zone and are now consolidating around it.
The next move will come — whether it breaks up or down.
What matters most now is the $100K Higher low.
As long as we stay above it, the structure remains bullish.
If we break below, momentum will shift accordingly.
I’m not taking any positions right now — just observing,
while the geopolitical noise plays out.
The most important thing in phases like this are to
stay calm, focused, and filter out the noise.

BTCUSDT Trend Analysis and Trading RecommendationsToday's overall BTC market rebounded after hitting a low of 102,614 in the early trading session, with Bitcoin's price maintaining a slow upward trend throughout the day. The intraday high reached 105,912 but encountered resistance. As the weekend approaches, historical market data shows limited volatility during weekends, so range-bound fluctuations are expected for the weekend.
From the current overall market rhythm, the price has rebounded slightly today after the previous decline. The hourly chart shows consecutive upward candles, though the price movement remains relatively slow. As time progresses, the price is expected to sustain an upward trend after pullbacks, and breaking through the short-term resistance level is only a matter of time. In terms of short-term structure and pattern, despite slight resistance and minor pullbacks, the downward momentum has weakened. We can still focus on long positions at lower levels, paying attention to the 106,000 resistance level.
BTCUSD
buy@104000-104500
tp:106000-107000
Investment itself is not the source of risk; it is only when investment behavior escapes rational control that risks lie in wait. In the trading process, always bear in mind that restraining impulsiveness is the primary criterion for success. I share trading signals daily, and all signals have been accurate without error for a full month. Regardless of your past profits or losses, with my assistance, you have the hope to achieve a breakthrough in your investment.
