Bitcoin (BTC): Buyers Are Building Up The Volume | Be ReadyBuyers are still holding strong where price is not showing any signs of weakness. With that being said, we are seeing the volume gathering near the current zone, which might result in a breakout and a strong upwards movement.
A new ATH is coming; this has been seen already once on the BTC, so it is just a repeat of history.
Swallow Academy
BTCUSDT.PS trade ideas

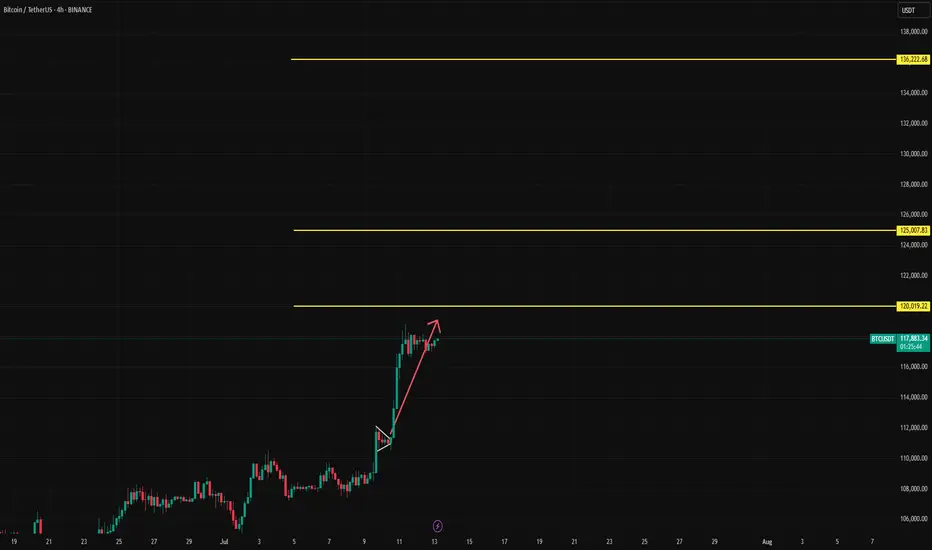
BTCUSDT[BITCOIN]:Price is Likely to be Heading Towards $144,000.Recently, Bitcoin has shown extreme bullish price behaviour, and there’s no sign of bearish influence in the market. After monitoring the price since May 4th, we believe there’s a high possibility of price hitting the 120k region first. This could be followed by a small correction around 105k, where a strong bullish price influence will lead the price to our final target at 140k. Both fundamental and technical factors support this view, but it doesn’t guarantee the price will follow our expectations.
Before investing or trading cryptocurrencies, do your own research as they carry significant financial risk. This chart analysis is for educational or secondary purposes only.
Good luck and trade safely.
If you want to support and encourage us, you can do the following: ❤️
-Like the idea
-Comment the idea
-Share ;)
Team Setupsfx_

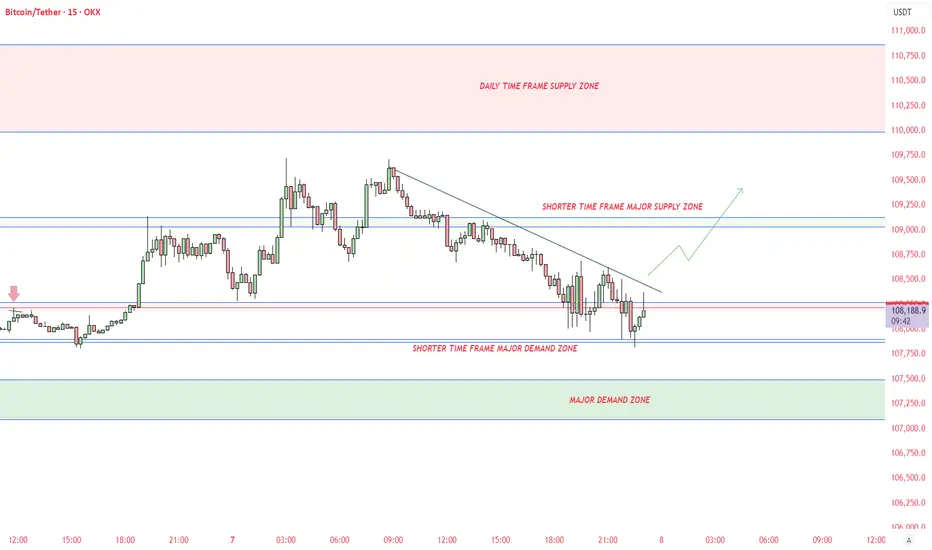
Projected price targets for BitcoinAs long as the $108,400 level holds, the current market outlook remains bullish

Bitcoin Weekly Chart Outlook – Retrace Expected at 125KBased on the Bitcoin weekly chart, I’ve noticed a repeating pattern where Bitcoin tends to reach a short-term top or enters a retracement phase at every $25,000 level — $25K, $50K, $75K, $100K.
If this pattern continues, my projection is that Bitcoin could reach its next significant top or retrace zone around $125,000. This level could act as a psychological and technical barrier, attracting profit-taking and triggering a correction.
While this is not financial advice, it’s a structure I’m closely watching as the market unfolds.
What do you think? Let’s discuss.

#BTCUSDT(BITCOIN): Two Targets First $130,000 And Then $150,000Bitcoin is poised for significant distribution, with a potential price surge to $130,000, followed by a swing target of $150,000. The current accumulation phase is poised to transition into a substantial bullish move. We anticipate a surge in bullish volume in the coming days or weeks. Our analysis anticipates this transition to be completed by the end of the year or sooner.
It is important to note that this analysis does not guarantee a specific price movement and is provided solely for educational purposes.
We extend our best wishes for your successful trading endeavours. If our analysis has been of assistance, we would appreciate it if you could express your gratitude by liking and commenting.
For further insights, please follow our account.
Team Setupsfx_

BTCUSDT[BITCOIN]: $150,000 On The Way In Making!Hey there everyone!
Bitcoin took a bit of a dip around 105k, but it’s right back at a crucial level now. We’re keeping a close eye on the daily volume and expecting it to soar towards $115,000 before it might take another dip if the buying pressure dries up.
We’ve got three targets in mind, and you can set or look at them however you like based on your own analysis and preferences. The crypto market is going to be buzzing with volume, so keep an eye on the news and stay focused on the fundamentals. In the world of cryptocurrencies, fundamentals are more important than technicals, and it’s a whole different ball game compared to forex or gold.
Good luck with your trading, and please like and comment on this idea to show us your support. We really appreciate your support throughout our journey, and we’re excited to see it grow and continue.
If you’d like us to analyse a specific pair, just let us know!
Cheers,
Team Setupsfx_❤️

BTC - Drooling for 110K!So my acc was banned for a day and Im soo back! So i feel if it stays sideways for the orange line what we want, looks really good to take 110k to 110,202! breaks below orange line goes to red, stances - GETS CHANGED!

BTC - Last Chance to be Mindful of Potential Flash CrashBTC is at the top of the zone of this bearish retest.
DXY is currently retesting a major breakdown on the monthly time frame - which projects out a 2-4 year bull run for BTC.
Due to this major macro turning point, it’s possible we see an extreme liquidity grab crash on Bitcoin - recovering liquidity as shown on this chart.
Projected movements marked here.
Be prepared for anything - volatility expected

BTC Daily Chart Analysis
Trend: BTC is currently trading within a short-term descending channel.
Strong Resistance: Zone around $110k–112k, multiple failed retests observed.
Key Support: Around $105k (Ichimoku Cloud upper edge & recent local bottom).
RSI: Clear bearish divergence indicating weakening bullish momentum.
Elliott Wave: Completed 5-wave impulse from $75k up to $112k, now correcting (likely waves 4-5 within the descending channel).
Fibonacci: Breakout above $110k targets approximately $117k (1.414 Fib extension). Failure to break may lead price back down toward $102k.
Probability:
Bullish scenario (35%): Clear breakout above $112k, targeting $117k.
Bearish scenario (65%): Rejection at $112k, potential retest toward $105k → $102k.
⚠️ Recommendation: Closely watch the $110k zone. If BTC fails to clearly breakout, consider defensive actions (reducing position size, risk management).

BTCUSDT - MOSTLY UPTREND DIRECTIONAll supply demand zone identified.
May breach till 110000$. Please do your own research before taking any trades
SPXBank of America expects SPX to close 2025 near 6,300, with a 12‑month projection of 6,600. They note ongoing stagflation risks and do not expect rate cuts this year .

Bitcoin's New All-Time High = Altcoins Market Bull MarketThe shy new all-time high is in and it is good to be Bitcoin today. It is good to be Bitcoin, to be in Bitcoin and profit while trading Bitcoin but the bears got rekt and that's oookkkk. We accept their loss and it is their loss they earned it by being short when the market is good, bullish and strong. Who would short Bitcoin right before a new all-time high? I don't know.
A new all-time high was hit today, the price $112,000 but this is not the end. Not even close. This is the beginning of the next bullish wave.
I know what you are thinking, or might be thinking; Wait, but what about a drop? What about the correction? Will it go lower? Can I buy Bitcoin at 90K? I told you to buy when prices were low... "You would look like a genius for buying below 80K," 100K is already gone. No, no correction! Bitcoin is going up.
When resistance breaks it means higher. When prices move higher it means higher. When a new all-time high hits it means the bulls win. Now that the bulls won, the battle for the rise or the drop, we can expect higher prices. If you have any doubts, look at the altcoins. The altcoins market says we are entering a period of long-term growth.
Bitcoin will continue to hold strong. It will continue to rise surely, slowly, or fast, but long-term. It doesn't matter the speed; Bitcoin for the whales, altcoins for retail.
A small capital will grow faster with the altcoins because they have higher room for growth. The projects being smaller, more volatile makes for a good trading experience. Higher risk but also a higher opportunity to grow in the short- and mid-term. Bitcoin is good to retire now. Bitcoin is great to hold value, to support the market as it continues to grow.
For me and for you, welcome to the altcoins market bull market.
Thanks a lot for your continued support.
Namaste.

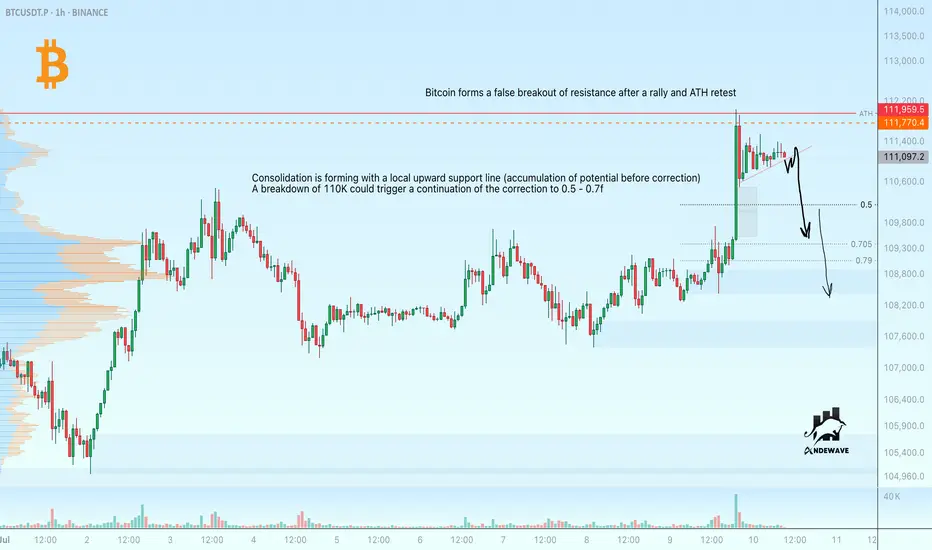
Bitcoin may correct after false ATH breakoutBitcoin is forming a false ATH breakout. There is a possibility of a correction beginning.
Consolidation is forming with a local upward support line (accumulation of potential before correction).
A breakdown of 110K could cause the correction to continue to 0.5 - 0.7f.
Bullish on $BTC🧠 Wyckoff Overview
🔻 This chart follows Accumulation Schematic #1 in Wyckoff theory.
🔻 The Spring phase (Phase C) is confirmed.
🔻 BTC has broken out from the accumulation zone.
🔻 We are now in Phase D, expecting a move into Phase E (new ATH).
📊 Technical Details
🔻 Accumulation zone: Around $72,000 – $88,000.
🔻 Spring (Phase C): A fakeout happened near $68,000, matching Wyckoff structure.
🔻 Breakout is confirmed after price moved above the downtrend line and Ichimoku cloud.
🔻 Main resistance: $95,000 – currently testing the supply zone.
🔻 Target: If breakout continues, BTC could reach a new ATH above $110,000.
📈 RSI and Volume
🔻 RSI at 66.71: Not overbought yet, still has room to go up.
🔻 Volume is increasing along with the breakout → shows strong buying pressure.
🎯 Personal Prediction
🔻 If BTC holds above $92,000 – $95,000 and continues to consolidate:
→ Short-term goal: $100,000
→ Mid-term goal (Wyckoff Phase E): $110,000 – $112,000

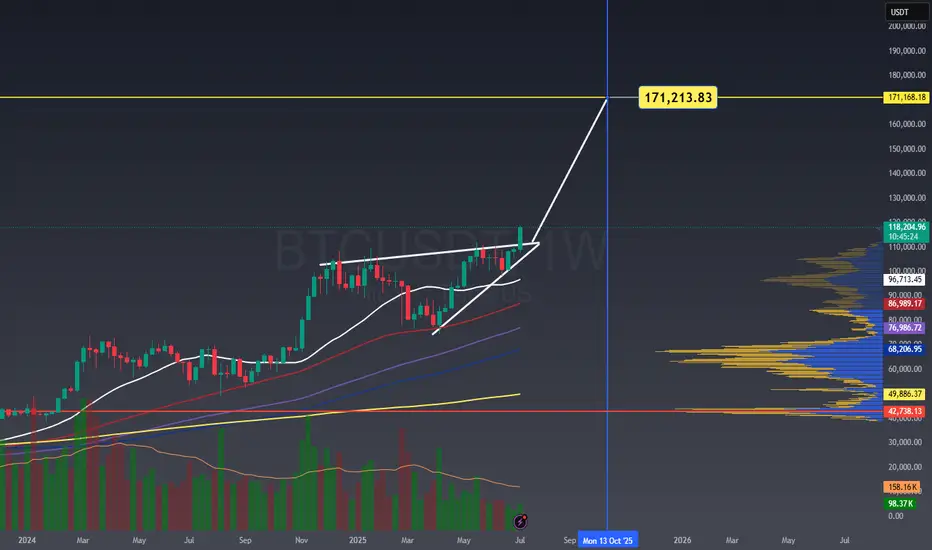
BTC TO 172K BY Oct 13, 2025BTC TO 172K BY Oct 13, 2025
rising wedge inverted head and shoulder measured move to the upside 172k
BITCOIN LONG TRADEWaiting for pullback to 105k region, Might not happen as Bitcoin seems to keep ripping from past experience.

You Haven’t Missed It**⏰ Timeframe: 1H**
**🛠 Tools Used: Dow Theory, Support & Resistance, Volume, RSI**
**📈 Market Overview**
Bitcoin BINANCE:BTCUSDT is currently trading at **110,982**. After hitting a new all-time high at **12K**, the price is undergoing a mild correction. Despite the retracement, price remains supported by both volume and the 25-period moving average.
Yesterday, BTC broke through the **110,267** resistance level with a strong bullish candle, but encountered aggressive selling from market makers and is now consolidating with weak candles below the **12K** mark.
Typically, in such market phases, it’s advisable to close previous positions and consider new entries. However, given the likelihood of **interest rate cuts** and the fact that price is holding near its ATH, keeping previous **long positions** open may be wise, as a **strong upward move** is still on the table.
**⚙️ Technical Analysis**
Yesterday’s breakout above **110,267** was met with seller pressure near **12K**, leading to a shallow correction.
**BTC Dominance (BTC.D)** has broken above **65.04** and **64.69**, moving toward **64.51** resistance. However, a weakening candle structure is visible on both **4H and 1H** timeframes. This indicates that while long opportunities on bullish **BTC pairs** may still exist, we might see a lower high forming above **64.51** and below **64.69**, followed by another move back toward **64.51**.
Meanwhile, **USDT Dominance (USDT.D)** broke below the **4.75** support with a strong candle and is now ranging above **4.63**, suggesting a possible pause or rest phase here.
The **Total Market Cap** shows a similar pattern to **BTCUSDT**, reflecting consolidation with slight bullish bias.
The **Others** chart (excluding BTC & ETH) shows a healthy uptrend and is now facing resistance at **248.68**. A breakout above this level could pave the way for stronger performance among altcoins with bullish BTC pairs.
**🧭 Potential Scenarios**
📗 **Bullish Scenario:**
If BTC forms a **higher low above 110,654**, an entry could be considered above **12,000**, with a stop-loss placed below the higher low (based on the 1H timeframe). Volume confirmation is necessary to support the move.
📕 **Bearish Scenario:**
As long as the price remains **above 109,409**, **short positions are not recommended**.
**💡 Conclusion, Warnings & General Suggestion**
Bitcoin is currently in a **healthy bullish phase**.
The **key resistance at 111K** has been broken, and price is pulling back toward that level.
The structure remains bullish, supported by **sufficient volume** and **no clear bearish divergence**.
If current support holds, there’s potential for continuation toward the **113,500–114,000** range.
⚠️ **Warnings:**
* If the pullback turns into a breakdown (falling below **110,200**, then **109,000**), it would signal **buyer weakness**, and strategy must be reconsidered.
* Watch for **RSI divergences** or **declining volume** during further rallies—they may indicate caution.
* Prolonged consolidation **below broken resistance** could also indicate market weakness.

BTC USDT ANALYSESBitcoin (BTC) is currently forming an ascending triangle, which is typically a bullish continuation pattern. If BTC breaks out of the triangle to the upside, my target would be around $130,000.
However, we also have a long-term ascending trendline that BTC has been respecting for a significant period. If BTC fails to break out of the ascending triangle, we may see a pullback toward this trendline. Notably, there is also a strong demand zone in that area, which could act as support.
On the weekly timeframe, there is a visible regular bearish divergence—a bearish signal that suggests a potential slowdown or correction. If the divergence plays out, a realistic downside target could be around $100,000 to $98,000.

BTC third tap incoming? Recently, BTC has traded for a large amount of time in ranging environments. These ranges have started with a local range high and then an initial 3-tap accumulation (i.e., a local low and then two sweeps of that low) before making a solid attempt at the range highs. The sweeps of the lows are meant to shake people out and provide fuel to try to break higher. The previous two times, that initial attempt failed and the price was sent lower to put in a second 3-tap accumulation at lower prices.
Will the current price move back down to put in the 3rd tap of the current relatively small accumulation? That is my base case. I believe we will see some lower prices locally to put in the 3rd tap. I think the Bitcoin Swing Trade Indicator (BSTI) will fire off green one more time and then we will then make a run to try to break out of this current massive range (that started last year in November). This current range is fairly small, so it is not worth it to me to sell here to try to buy lower.
The bigger question is: Will we have enough fuel to durably break out of this range after the 3rd tap of the current accumulation (green line) or are we destined to repeat the pattern of the last two bigger ranges (red line), one of which we are still in? I personally believe we will break out after the smaller range 3rd tap (the green line) based on the larger context of cycle theory, how long we have been in this range, and how the current small range is part of the larger range starting back in November 2024.
It will be interesting to see what happens.
Da_Prof
Note that TV won't allow publication of a private/unpublished indicator anymore or I would have shown the BSTI, which is now published as invite only. It's implementation is too complicated to publish openly, so I don't feel comfortable doing that. If you want access, please DM me on TradingView. Thanks.

BEst long on Btc is at $104 600CRYPTOCAP:BTC
Our plan is still bullish
But price reached VAH
That's why some pullback is possible
$104 600 is key zone for me. POC + VWAP. I`ll take a long trade in a case of local confirmation.

Where Can Bitcoin Go? Part 9 – Breakout and History in Motion🌋🚀 Where Can Bitcoin Go? Part 9 – Breakout and History in Motion. 🔓💥
The breakout over 114900 has happened.
After 2 rejections, years of preparation, and countless fakeouts… Bitcoin has finally cleared the $114,921 barrier.
We are now officially in price discovery mode within the upper resistance channel.
📍 As long as BTC stays above $114,900 – we are long.
This level is now our trigger line. Lose it? Flip back to short bias. Hold it? There’s only one word: 🚀
🔑 Context:
We’ve tracked this structure since 2023 using a 1-2-3 model based on macro highs. The third test is always the decider — and this time, we broke through.
✅ Test 1: Rejected (2021)
✅ Test 2: Rejected (2025)
✅ Test 3: Breakout confirmed (July 2025)
Now compare that to previous cycles:
2016 halving → ATH in 2017
2020 halving → ATH in 2021
2024 halving → ATH coming by end of 2025?
🧭 Based on this map, BTC’s next structural targets are:
→ $137K
→ $160K
→ $182K+
But there’s a catch: if we fall back below 114,900, the entire breakout thesis is at risk. This is now a binary zone.
⚠️ What to Watch:
📌 Support Retests:
Expect volatility around the 114.9–116K level. This zone will now be stress-tested.
📌 Media Frenzy vs Structure:
As hype increases, stick to levels — not noise.
📌 Ultimate FOMO vs Breakdown:
Hold structure = ATH potential
Lose structure = Down we go, potentially hard.
🎥 Missed the full structural breakdown?
👉 Watch “Where Can Bitcoin Go? Part 8” for the blueprint
👉 This is now Part 9 – The terminal move has begun
We are now playing for cycle maturity – this could be the final leg before topping out in late 2025.
Let’s trade it with clarity, not emotions.
One Love,
The FXPROFESSOR 💙
Disclosure: I am happy to be part of the Trade Nation's Influencer program and receive a monthly fee for using their TradingView charts in my analysis. Awesome broker, where the trader really comes first! 🌟🤝📈
🚨 BITCOIN HAS BROKEN OUT but keep in mind: under 114900 be OUT!

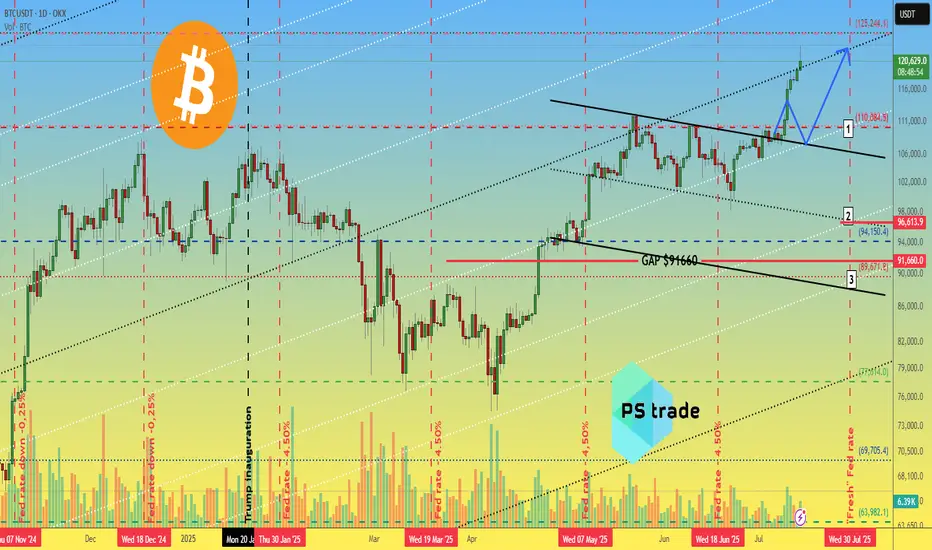
Bitcoin BTC price analysis📈 Two weeks have passed since the previous analysis of the OKX:BTCUSDT chart, and the market has decided to go with the 1️⃣ scenario.
Less than 3% remains to reach $125,000, and the price could easily get there by inertia, but that's a minor detail.
CRYPTOCAP:BTC is updating its ATH, and total liquidations on the crypto market over the past 24 hours are “only” $750 million, of which almost $450 million is accounted for by #Bitcoin.
Weak, very weak... Previously, longs were liquidated for $2+ billion, and it was reported that the actual amount of liquidations was significantly higher due to the fact that the exchanges' data was not fully disclosed. (For the sake of objectivity, at that time, the lion's share of liquidations was accounted for by altcoins, but now this is not the case).
◆ During this time, Trump introduced new tariffs — the market was “on a roll” — it swallowed it and didn't even notice the news.
◆ Tomorrow, July 15, the US CPI will be announced — the forecast is for inflation to rise from 2.4% to 2.6% (although there are rumors that the situation in the US economy is much worse and this may "come to light" tomorrow).
◆ July 16 - PII announcement - these indicators may act as a “cold shower” to bring the market out of its euphoria.
◆ From July 14 to July 18, the US Congress is considering three key crypto laws, including the GENIUS Act. Major players consider this a powerful driver. Perhaps the current growth has already “played out” and priced in expectations for news.
🪐 And this trading week will end on 18.07 with the start of Mercury retrograde, even the US Congress is postponing all important matters, and you still don't believe in it ))
🖐 Long positions are certainly beneficial, appropriate, and in line with the trend at present, but it is advisable to hedge them with stops, because as mentioned above: the price is rising, and there are few liquidations. During the previous decline in the cryptocurrency market, there were significantly more liquidations of long positions, and they may wish to repeat this.
And with the #BTCUSD price correction, there will be a fixation: some will have profits, and some will have losses in stablecoins, which would then be logical to reinvest as capital in altcoins. First in something more voluminous and less risky, and in the last stage, they will pump everything in a row)
But until then, we still need to survive and preserve our deposits.
So, in your opinion: correction to one of the levels:
1️⃣-$110k 2️⃣-$97k 3️⃣-$90k
or
is everything written above complete nonsense, and the market growth has only just begun to “take off”?