Mastering the ICT Power of 3 concept - How to use it in trading!The financial markets often appear chaotic and unpredictable, but behind the scenes, institutional players operate with clear strategies that shape price action. One such strategy is the ICT (Inner Circle Trader) "Power of 3" model, a framework used to understand and anticipate market cycles through three key phases: accumulation, manipulation, and distribution. This guide will break down each of these phases in detail, explaining how smart money operates and how retail traders can align themselves with the true direction of the market.
What will be discussed?
- The 3 phases
- Examples of the PO3
- How to trade the PO3
- Tips for trading the PO3
The 3 phases
Accumulation
The Accumulation Phase in the ICT "Power of 3" model refers to the initial stage of a market cycle where institutional or "smart money" participants quietly build their positions. During this time, price typically moves sideways within a tight range, often showing little to no clear direction. This is intentional. The market appears quiet or indecisive, which is designed to confuse retail traders and keep them out of alignment with the real intentions of the market's larger players.
In this phase, smart money is not looking to move the market dramatically. Instead, they are focused on accumulating long or short positions without drawing attention. They do this by keeping price contained within a consolidation zone. The idea is to gather enough liquidity, often from unsuspecting retail traders entering early breakout trades or trying to trade the range, before making a more aggressive move.
Manipulation
The Manipulation Phase in the ICT "Power of 3" model is the second stage that follows accumulation. This phase is where smart money deliberately moves the market in the opposite direction of their intended move to trigger retail stop losses, induce emotional decisions, and create liquidity.
After price has consolidated during accumulation, many retail traders are either already positioned or have orders waiting just outside the range, either stop losses from those trading the range or breakout orders from those anticipating a directional move. The manipulation phase exploits this positioning. Price will often break out of the accumulation range in one direction, appearing to confirm a new trend. This move is designed to look convincing, it might even come with a spike in volume or momentum to draw traders in.
However, this breakout is a false move. It doesn’t represent the true intention of smart money. Instead, it's meant to sweep liquidity, triggering stop losses above or below the range, and then reverse sharply. This stop run provides the liquidity needed for large players to finalize their positions at optimal prices. Once enough liquidity is collected, and retail traders are caught offside, the real move begins.
Distribution
The Distribution Phase in the ICT "Power of 3" model is the final stage of the cycle, following accumulation and manipulation. This is where the true intention of smart money is revealed, and the market makes a sustained, directional move, either bullish or bearish. Unlike the earlier phases, distribution is marked by clear price expansion, increased volatility, and decisive momentum.
After smart money has accumulated positions and shaken out retail traders through manipulation, they have the liquidity and positioning needed to drive the market in their desired direction. The distribution phase is where these positions are "distributed" into the broader market, meaning, institutions begin to offload their positions into the retail flow that is now chasing the move. Retail traders, seeing the strong trend, often jump in late, providing the liquidity for smart money to exit profitably.
This phase is typically what retail traders perceive as the real trend, and in a sense, it is. However, by the time the trend is obvious, smart money has already entered during accumulation and profited from the manipulation. What appears to be a breakout or trend continuation to most retail participants is actually the final leg of the smart money’s strategy. They are now unloading their positions while price continues to expand.
Examples of the Power of 3
How to trade the PO3?
Start by identifying a clear accumulation range. This typically happens during the Asian session or the early part of the London session. Price moves sideways, forming a consolidation zone. Your job here isn’t to trade, but to observe. Draw horizontal lines marking the high and low of the range. These become your key liquidity zones.
Next, anticipate the manipulation phase, which usually occurs during the London session or at the NY open. Price will often break out of the range, triggering stop losses above the high or below the low of the accumulation zone. This move is deceptive, it is not the real trend. Do not chase it. Instead, wait for signs of rejection, such as a sharp reversal after the liquidity grab, imbalance filling, or a shift in market structure on a lower timeframe (like a 1- or 5-minute chart).
Once manipulation has swept liquidity and price starts showing signs of reversing back inside the range or beyond, you now look for a confirmation of the true move, this begins the distribution phase. You enter in the direction opposite of the manipulation move, ideally once price breaks a structure level confirming that smart money has taken control.
For example, if price consolidates overnight, fakes a move to the downside (running sell stops), and then quickly reverses and breaks above a key swing high, that's your signal that the true move is likely up. Enter after the break and retest of structure, using a tight stop loss below the recent low. Your target should be based on liquidity pools, fair value gaps, or higher-timeframe imbalances.
The key to trading the Power of 3 is patience and precision. You're not trying to catch every move, but to wait for the market to complete its cycle of deception and then ride the clean expansion. Ideally, your entry comes just after manipulation, and you hold through the distribution/expansion phase, taking partials at key liquidity levels along the way.
Tips for trading the PO3
1. Learn price movements
Before you can effectively apply the ICT Power of 3 strategy, it’s crucial to have a deep understanding of how price behaves. This means being comfortable identifying market structure, recognizing trend direction, and interpreting candlestick dynamics. Since the Power of 3 is deeply rooted in how price moves in real time, a strong grasp of these basics will give you the confidence to read the market correctly as each phase develops.
2. Analyse multiple timeframes
Although the Power of 3 pattern shows up on lower timeframes, relying on just one can lead to misreads. You’ll gain a clearer picture when you align the short-term view with higher timeframe structure. For example, what appears to be accumulation on the 15-minute chart may simply be a retracement in a larger trend on the 1-hour or daily. By examining multiple timeframes together, you can better identify the true setup and avoid being tricked by noise.
3. Exercise patience
A key part of trading the Power of 3 is knowing when to act, and more importantly, when not to. It’s easy to get impatient during the accumulation or manipulation phases, but entering too early often leads to frustration or losses. True discipline comes from waiting for the expansion or distribution phase, when the market reveals its real direction. This is where the most favorable risk-to-reward setups occur.
Thanks for your support.
- Make sure to follow me so you don't miss out on the next analysis!
- Drop a like and leave a comment!
BTCUSDT trade ideas

Fair Value Gap (FVG) in Crypto: The Complete Guide🔸Introduction:
In financial markets in general—and the crypto market in particular—understanding market liquidity and imbalance zones is essential for building successful trading strategies. One of the most prominent modern price analysis concepts, especially within the Smart Money Concepts (SMC) framework, is the Fair Value Gap (FVG). This refers to a price imbalance between buyers and sellers.
🔸What is the Fair Value Gap (FVG)?
A Fair Value Gap is an area on the price chart that shows an imbalance between supply and demand. It occurs when the price moves rapidly in one direction without being fairly traded within a balanced price range. This usually happens due to the entry of large players or “smart money,” creating a gap between three consecutive candlesticks on the chart.
Classic Bullish FVG Setup:
Candle 1: A bearish or neutral candle.
Candle 2: A strong bullish candle (usually large).
Candle 3: A bullish or neutral candle.
🔸Where is the Gap?
The gap lies between the high of candle 1 and the low of candle 3.
If candle 3 does not touch the high of candle 1, an unfilled price gap (FVG) is present.
🔸How is FVG Used in Market Analysis?
Traders use Fair Value Gaps as potential areas for:
Entering trades when the price returns to retest the gap.
Identifying zones of institutional interest.
Setting potential targets for price movement.
🔸Common Scenario:
If a strong bullish candle creates a Fair Value Gap, the price often returns later to retest that gap before continuing its upward movement.
The gap can be considered "delayed demand" or "delayed supply".
🔸🔸Types of FVG:🔸🔸
🔸Bullish FVG:
Indicates strong buying pressure.
The price is expected to return to the gap, then bounce upwards.
🔸Bearish FVG:
Indicates strong selling pressure.
The price is expected to return to the gap, then continue downward.
🔸Relationship Between FVG and Liquidity:
Fair Value Gaps are often linked to untapped liquidity zones, where buy or sell orders have not yet been fulfilled. When the price returns to these areas:
Institutional orders are activated.
The price is pushed again in the primary direction.
🔸How to Trade Using FVG (Simple Entry Plan):
Steps:
Identify the overall trend (bullish or bearish).
Observe the formation of an FVG in the same direction.
Wait for the price to return and test the gap.
Look for entry confirmation (like a reversal candle or a supporting indicator).
Set your stop loss below or above the gap.
Take profit at a previous structure level or the next FVG.
🔸🔸Real-World Examples (Simplified):🔸🔸
🔸Bullish Example:
A strong bullish candle appears on BTC/USD.
A gap forms between $74K and $80K.
The price rises to $108K, then returns to 74K$ (inside the gap).
From there, it begins to rise again.
🔸Important Tips When Using FVG:
Don’t rely on FVGs alone—combine them with:
-Market Structure.
-Support and resistance zones.
-Confirmation indicators like RSI or Volume Profile.
-Best used on higher timeframes (15m, 1H, 4H, Daily).
-The gap can be filled the same day or after days/weeks.
🔸Conclusion
The Fair Value Gap is a powerful analytical tool used to identify zones of institutional interest. It plays a key role in the toolset of professional traders who follow smart money principles. By mastering this concept, traders can improve entry and exit timing, reduce risk, and increase their chances of success.
Best regards Ceciliones🎯

TradeCityPro | Bitcoin Daily Analysis #104👋 Welcome to TradeCity Pro!
Let’s dive into Bitcoin and key crypto indices. As usual, in this analysis I’ll walk you through the triggers for the New York futures session.
⏳ 1-Hour Timeframe
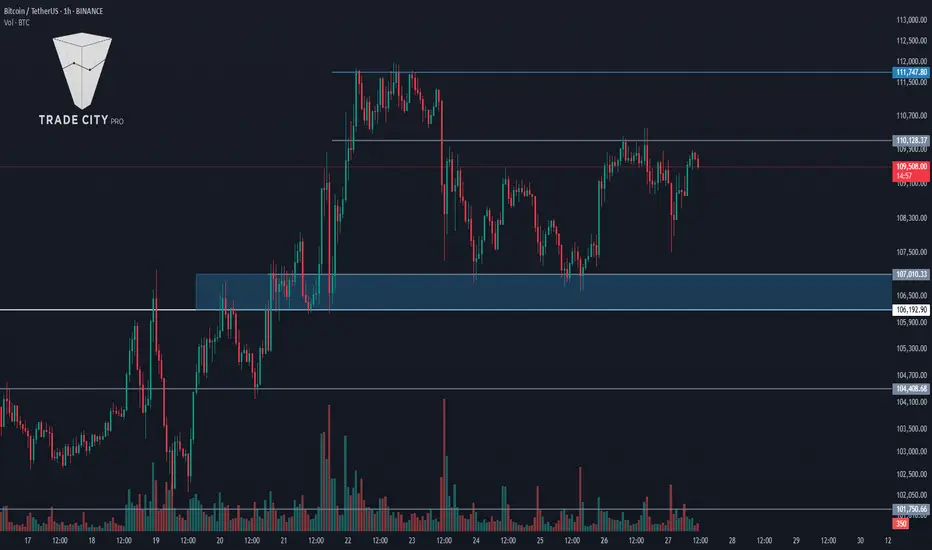
On the 1-hour chart, as you can see, Bitcoin was once again rejected from the 110128 level yesterday and is now hovering near 108237.
✔️ At the moment, price hasn’t yet touched the 108237 support. If it manages to stay above this level without breaking below, the chances of retesting 110128—and even breaking above it—increase.
🔍 If 108237 is broken, a short position could be considered. However, keep in mind that this setup goes against the current uptrend. As mentioned in previous analyses, the 106192–107010 range is a major support zone, and as long as price remains above it, the trend remains bullish.
📉 The main short trigger would be a break below this key support. If that occurs, it could introduce strong bearish momentum. An RSI break below 38.57 would serve as a momentum confirmation.
✨ During this pullback from 110128, market volume has been decreasing, which indicates the strength of the ongoing uptrend.
💥 If 110128 is broken, and considering the strong trend, a long position could be initiated. An RSI break above 50 would provide additional confirmation. The primary long trigger remains a break above 111747.
👑 BTC.D Analysis
Bitcoin Dominance continued to fall yesterday, reaching as low as 63.87. It has shown a slight bounce from that level and is currently in a mild upward correction.
⭐ If a lower high forms below 64.18, the chances of breaking below 63.87 increase. However, if the correction goes beyond 64.18, the probability of resuming the uptrend will grow.
📅 Total2 Analysis
Yesterday, Total2 was rejected from 1.24 and corrected down to 1.21. If price bounces from here and heads back toward 1.24, the chances of breaking that resistance will rise.
📊 If 1.21 fails to hold, a deeper correction toward 1.18 could follow.
📅 USDT.D Analysis
USDT Dominance is forming a lower high compared to 4.56. If this plays out and 4.49 is broken, it would confirm a bearish move.
⚡️ On the other hand, if 4.56 is broken to the upside, the move could extend toward 4.62.
❌ Disclaimer ❌
Trading futures is highly risky and dangerous. If you're not an expert, these triggers may not be suitable for you. You should first learn risk and capital management. You can also use the educational content from this channel.
Finally, these triggers reflect my personal opinions on price action, and the market may move completely against this analysis. So, do your own research before opening any position.

BTCUSDTHello Traders! 👋
What are your thoughts on BITCOIN?
Bitcoin entered a corrective phase after a liquidity hunt above the recent highs and is currently in a short-term pullback.
We expect this correction to extend toward the identified support levels, after which a new bullish wave may begin, potentially leading to fresh all-time highs.
The broader trend remains bullish, and the current correction could offer a buy-the-dip opportunity in line with the ongoing uptrend.
Don’t forget to like and share your thoughts in the comments! ❤️

BTC: First Bearish Signs of a Deeper CorrectionBTC: First Bearish Signs of a Deeper Correction
All these days, BTC has only been rallying and has a clear bullish structure.
Today we can see a complete transformation showing the first signs of a downward correction.
It is too early to talk about a downtrend.
Yesterday, the pattern transformed from bullish to bearish by falling below 106730, which corresponds to a strong support structure area.
Considering that this area was important, it has a chance to continue to 102000 and maybe even lower to 98000.
It could be a false bearish breakout to the downside, however, as long as it shows this bearish pattern, we should be careful and take this into consideration.
You may find more details in the chart!
Thank you and Good Luck!
❤️PS: Please support with a like or comment if you find this analysis useful for your trading day❤️

Is It Time to Enter, or time to escape?One green candle is all it takes to trigger thousands of minds into thinking
Should I jump in now?
But is this truly a good entry point, or are you just afraid of missing the move?
Let’s break down how psychology tricks us into bad trades—and how to fight back with real chart data.
Hello✌
Spend 3 minutes ⏰ reading this educational material.
🎯 Analytical Insight on Bitcoin:
📈 Bitcoin is currently respecting a well-structured ascending channel, with price action aligning closely with a key Fibonacci retracement level and a major daily support zone—both acting as strong technical confluence. Given the strength of this setup, a potential short-term move of at least +6% seems likely, while the broader structure remains supportive of an extended bullish scenario toward the $116K target. 🚀
Now, let's dive into the educational section ,
📉 Why Do We Buy More When Markets Are High?
It’s a simple question—but the answer runs deep into our psychology. When a crypto pumps, and we’re not in it, our brain doesn’t analyze—it rationalizes:
"If I don’t buy now, I’ll miss out."
But most people who think like this enter at the top—and exit with regret .
🧠 The Psychology of FOMO and Poor Timing
In every rally, a large chunk of entries are triggered by FOMO (Fear of Missing Out).
But buying high means you're buying from those who bought lower.
And here's the trick: your brain loves the green candles—but ignores volume drops, RSI spikes, or exhaustion signals.
🛠 TradingView Tools to Spot Smart Entry Points
When it comes to entering a position, emotions are your worst advisor. Fortunately, TradingView offers powerful tools to help you act based on evidence, not instinct. Here’s how to use them:
🔹 Trend-Based Fib Extension: One of the best tools to estimate how much room a move still has. Plot it on the previous wave to identify realistic targets.
🔹 RSI (Relative Strength Index): When RSI is over 70 or under 30, you’re in emotional territory. Be careful—buying during peak RSI often means you're entering late.
🔹 MACD: Look for crossovers between lines and histogram patterns. Use it as confirmation—not a solo trigger—for entries.
🔹 Volume Profile: This hidden gem on TradingView shows you where most trading volume has occurred. Buying at volume-supported levels is way safer.
🔹 Alerts & Watchlists: Don’t glue yourself to the chart. Set alerts for your conditions and build smart watchlists to stay updated.
🔹 Replay Mode: Want to master entries without risking real capital? Use Replay Mode to test strategies and train your eyes.
If you want to replace "guessing" with "planning," these tools should be your daily companions.
🔍 5-Point Checklist Before You Hit "Buy"
Ask yourself these five questions before entering a trade:
Is the broader trend actually bullish—or is this just a short-lived bounce?
What does RSI or other indicators say about overbuying?
Are there major support/resistance zones nearby?
Is the volume confirming the move—or fading out?
Do you have a target and stop in place—or just a “need to be in”?
📊 No Plan Entry = Planned Loss
If you jump in without a clear plan, your only focus becomes: “Am I in profit yet?”
Not “Is my strategy playing out?”
And that’s the trap.
A solid entry means you have a signal, a plan, and controlled risk.
🧲 How to Avoid Getting Pulled Into Fake Rallies
Always check higher timeframes for confirmation
Don’t enter without volume agreement
Plan entries after pullbacks, not mid-hype
Think in probabilities, not dreams
🧭 Final Takeaway & Recommendation
Opportunities never end in the market.
Opportunities never end in the market.
Opportunities never end in the market.
Opportunities never end in the market.
Opportunities never end in the market.
Opportunities never end in the market.
Opportunities never end in the market.
i should write this thousand of time ☝️
But rushing in only guarantees missed ones.
Use your tools and stay calm.
The trader who plans always beats the one who panics.
always conduct your own research before making investment decisions. That being said, please take note of the disclaimer section at the bottom of each post for further details 📜✅.
Give me some energy !!
✨We invest countless hours researching opportunities and crafting valuable ideas. Your support means the world to us! If you have any questions, feel free to drop them in the comment box.
Cheers, Mad Whale. 🐋

$BTC Liquidity Squeeze Incoming – Breakout or Breakdown?#Bitcoin
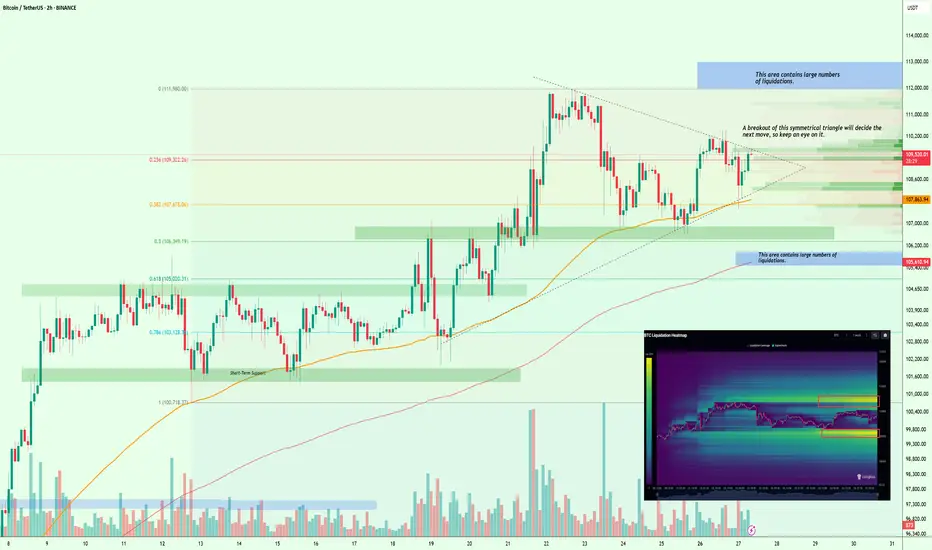
According to the liquidation heat map, CRYPTOCAP:BTC is building a large cluster of liquidations on both the upside and downside, creating some confusion in the market. However, the nearest major liquidation zone is around $112K–$113K, which increases the chances of a move toward that range.
Technically, BTC is forming a symmetrical triangle, and the breakout from this pattern will likely determine the next major move.
So keep a close eye on it.
I’ll keep you posted as things unfold.
If you find my updates helpful, don’t forget to like and follow for more!
Bitcoin – Possible 4h Sweep at 106.5kBitcoin recently printed a sharp rejection after revisiting a key supply area formed by a 4H fair value gap, overlapping perfectly with the golden pocket zone from the most recent down move. This confluence provided a strong technical ceiling, causing a clear reaction and shifting short-term sentiment to the downside. The rejection was sharp and clean, leaving behind an upper wick that signals strong selling interest. From here, price appears to be in search of support, and our eyes are now locked on the 4H imbalance around the 108.2k level, which could serve as a key pivot for the next directional move.
Consolidation and Confluence Structure
This recent move isn’t just a random drop. We’ve built a range around this resistance zone, with multiple failed attempts to break higher, followed by a clear rejection from inside the 4H FVG and golden pocket. This kind of structure usually tells us two things: first, buyers are struggling to break through strong institutional resistance, and second, there’s still liquidity left below that the market may want to sweep before any continuation higher. This is where the FVG at 108.2k and the PDL around 106.5k come into play. Both zones are clean, visible, and highly likely to draw price if the current level doesn’t hold.
Fair Value Gap Reaction Potential
The 108.2k zone is where the first major reaction could occur. It marks a fresh 4H imbalance created during the impulsive move upward, and price is now backfilling that inefficiency. If buyers step in here, respecting this imbalance as a demand zone, we could easily see a rotation back up toward 110.2k and eventually a retest of the upper resistance band near 111k. This would be a typical FVG play: price rebalances into the gap, finds demand, and continues higher.
Failure Scenario and Liquidity Sweep Setup
If the 108.2k FVG fails to hold as support, the next target becomes much more obvious, the previous day’s low at 106.5k. That level is also a 4H swing low, making it a prime liquidity draw. A move below that low would allow price to collect sell-side liquidity, sweep out late longs, and potentially trap breakout traders expecting further downside. If this level is swept cleanly and followed by bullish displacement, it could offer a high-probability long entry from the discount zone. The risk-reward from this setup would be ideal, especially if we reclaim 108.2k afterward.
Market Context and Higher Timeframe Bias
Zooming out, the structure remains bullish on higher timeframes, but this local rejection is a necessary reset. It’s a shakeout that allows price to reprice into demand and generate momentum for the next leg up. This kind of behavior is typical in trending markets, corrective moves that dig into inefficiencies, hunt liquidity, and then reestablish the trend. As long as we don’t see sustained closes below 106k, the bias remains tilted toward continuation to the upside, with current price action offering a potential entry opportunity.
Price Target and Expectations
If we hold the 108.2k zone, my first short-term target is the 110.2k structure high, followed by the upper resistance area around 111k where the initial rejection occurred. A reclaim of that zone opens the door to expansion toward 112k. If instead we sweep the PDL and bounce from 106.5k, the first target would be a retrace into the 108.2k imbalance, with the next leg aiming for the same resistance range. Either path sets up a long opportunity from areas of value.
Conclusion
Bitcoin is at an important decision point. The rejection from the 4H FVG and golden pocket confirms strong resistance, and price is now seeking support lower. The 108.2k FVG is a critical zone, a hold here gives us a clean continuation setup, while a failure could lead to a deeper liquidity sweep toward 106.5k. Either scenario offers high-quality trade potential as long as we stay disciplined and wait for confirmation from price action. Patience is key, but both levels present opportunities to position long from areas where smart money typically steps in.
___________________________________
Thanks for your support!
If you found this idea helpful or learned something new, drop a like 👍 and leave a comment, I’d love to hear your thoughts! 🚀

TradeCityPro | Bitcoin Daily Analysis #103👋 Welcome to TradeCity Pro!
Let’s dive into Bitcoin and key crypto indices. As usual, in this analysis I’ll walk you through the triggers for the New York futures session.
⏳ 1-Hour Timeframe
As you can see on the 1-hour chart, Bitcoin was rejected from the 110128 resistance yesterday and began a pullback, but it didn't reach the support at 107010 — instead, it formed a higher low and is now moving back toward 110128.
📊 Buy volume during this bullish leg has been relatively low, which isn’t ideal for a strong uptrend and indicates potential weakness.
📈 If the 110128 resistance breaks, a long position can be considered. However, if you take this trade, I suggest not setting your target at 111747 — instead, aim for higher targets and hold the position longer.
💥 The main long trigger remains at 111747. So if you missed or don’t want to trade the 110128 breakout, you can wait for this higher confirmation.
🔽 As for short setups, just like yesterday, it's still better to wait for a trend reversal. As long as the price remains above the support zone, the uptrend remains intact.
👑 BTC.D Analysis
Bitcoin Dominance broke above 64.32 yesterday but failed to hold and fell back below it, also breaking the 64.18 support. It’s now moving toward 63.97.
⭐ Currently, there is strong bearish momentum in BTC.D, and if 63.97 is broken, this downward move is likely to continue.
📅 Total2 Analysis
Total2 printed a higher low above 1.18 and has now broken above the 1.22 resistance.
✨ If it can hold above this level, we could see an upward move toward 1.26. For bearish confirmation and short positions, a break below 1.18 would be the key trigger.
📅 USDT.D Analysis
USDT Dominance printed a lower high compared to 4.62 and is now sitting on support at 4.49. A break below this level could push the dominance down to 4.38.
🎲 To confirm a bullish reversal in USDT.D, we would need to see a break above 4.62.
❌ Disclaimer ❌
Trading futures is highly risky and dangerous. If you're not an expert, these triggers may not be suitable for you. You should first learn risk and capital management. You can also use the educational content from this channel.
Finally, these triggers reflect my personal opinions on price action, and the market may move completely against this analysis. So, do your own research before opening any position.
Bitcoin - Will we go back to $99k?Bitcoin is showing its first real signs of weakness after an extended bullish run. The current price action around $106,700 suggests a loss of momentum, with price hovering just above a key daily low that could act as a pivot point. If this low gets taken out, it would likely mark a short-term shift in sentiment from bullish to bearish, opening the door for a deeper retracement toward key inefficiency zones that remain unfilled.
Consolidation and Liquidity Structure
After the sharp breakout in early May, price rallied aggressively with minimal pullbacks, leaving behind several imbalance zones that now act as downside magnets. The previous range high around $99,000, which acted as a strong resistance level earlier this year, has not yet been properly retested. This area aligns with a large daily imbalance, making it a highly probable target in the event of a breakdown. Currently, price is consolidating just above this previous resistance-turned-support zone, and pressure is building.
Bearish Breakdown Potential
If the current daily low breaks, it would likely trigger a flush into the $99,000 to $95,000 range, where we find that unfilled imbalance waiting to be closed. A break and acceptance below the $99,000 level could suggest deeper trouble for the bulls. In that case, the next major downside target sits around $92,000, where an even larger inefficiency from earlier in the year remains open. This level also coincides with a significant accumulation zone that could provide the next strong base of support if the market continues correcting.
Bullish Recovery Conditions
On the flip side, if Bitcoin holds this low and finds demand stepping in at current levels, we could see a local bottom form. A recovery and push back toward $108,000 or even a reattempt of the $112,000 highs would be back on the table. But for this bullish case to stay alive, the current daily low must hold. A sweep and reclaim could trap late sellers and fuel a quick reversal. However, right now, the pressure is clearly leaning to the downside unless buyers show strong intent soon.
Imbalance Zones and Key Price Areas
The most critical area to watch is the $99,000 level. It’s the confluence of an old resistance, an unfilled imbalance, and psychological round number support. If price tags this zone, we’ll need to monitor reaction closely. Weakness below $99,000 opens the door to $92,000, which is where the next higher timeframe imbalance sits. If we start accepting below $92,000, that would confirm a much more extended corrective phase is underway.
Price Target and Expectations
The primary expectation is a move into the $99,000 imbalance zone, assuming we get a clean daily low break. A bounce there would offer the first chance for a bullish reaction, but if sellers dominate, $92,000 becomes the secondary and more extreme downside target. A reclaim of $108,000 would invalidate this short-term bearish thesis and shift the focus back toward the highs.
Conclusion
All eyes are on the daily low. A clean break below it would change the tone of this market and likely initiate a short-term bearish cycle, targeting inefficiencies left behind during the rally. $99,000 is the key zone to watch first. If it holds, bulls may step back in. If not, $92,000 becomes the next target in line. For now, caution is warranted as the risk of deeper downside continues to grow.
___________________________________
Thanks for your support!
If you found this idea helpful or learned something new, drop a like 👍 and leave a comment, I’d love to hear your thoughts! 🚀

Bitcoin – Entering a distribution phase after a bull trap?Since the second week of May, Bitcoin (BTC) has exhibited a textbook accumulation phase, with a well-defined trading range forming just below the previous all-time high. Beginning around May 12, price action became increasingly compressed, marked by a series of higher lows and relatively flat resistance, indicating growing demand and waning selling pressure. This consolidation structure persisted for more than a week, suggesting that larger players were accumulating positions in anticipation of a breakout. Now it could be making the Power of 3. Accumulation, manipulation and distribution.
Accumulation, manipulation and distribution
Eventually, this coiled energy resolved to the upside. BTC broke through the upper boundary of the accumulation zone with increasing volume and momentum, triggering a sharp rally and leading to the formation of a new all-time high. At that point, market sentiment turned decidedly bullish, with breakout traders entering the market, expecting continuation. However, the price failed to sustain above the previous ATH for long. Despite the breakout’s initial strength, Bitcoin was unable to establish a solid foothold above the critical psychological and technical level, which has now proven to be a key inflection point.
Soon after setting a new high, BTC began to reverse, shedding gains and retracing back below the former resistance level, which had temporarily acted as support. The breakdown below the $106,000 mark, previously the ceiling of the accumulation range, signaled a notable shift in market structure. What was initially viewed as a healthy continuation pattern evolved into what now appears to be a classic bull trap. This type of failed breakout often leaves market participants vulnerable, as late buyers are caught in drawdowns and early longs may be incentivized to exit positions.
Given this context, the recent price action carries the hallmarks of a Power of 3, where market makers and institutions may be offloading positions to less informed participants. This phase is often mistaken for continued accumulation by retail traders due to its structural similarity; however, the key difference lies in the failure to maintain new highs and the emergence of lower highs on any attempted bounce. The rejection above the ATH and the subsequent breakdown below $106K has introduced significant overhead supply, which may act as resistance in the near term.
Target levels
As BTC continues to trade below this critical level, the likelihood of a further retracement grows. The market appears to be transitioning into a phase of redistribution or distribution proper, where price is likely to be capped on rallies and pressured lower over time. It is reasonable to expect that Bitcoin could revisit $100.000 to mid-$90,000s, an area that may serve as a magnet for liquidity and a potential staging ground for the next major move. This region could represent a "Last Point of Supply" (LPSY) within the Wyckoff framework, typically the final area where smart money distributes before initiating a more decisive markdown phase.
Nevertheless, this potential pullback should not be viewed solely as a sign of weakness. In many bull cycles, such corrections and shakeouts serve to flush out over-leveraged positions and reset sentiment, ultimately laying the groundwork for renewed upward momentum. Should BTC find stability and demand re-emerge in the $95K–$100K range, it could mark the beginning of a new re-accumulation phase, leading to a healthier and more sustainable advance.
Conclusion
In summary, the recent breakout above ATH followed by a sharp reversal and loss of key support paints a cautionary picture in the short term. Bitcoin may currently be navigating a distribution zone, with downside pressure likely to persist as the market digests recent gains. However, such corrections are typical in broader uptrends and often present opportunities for strategic entries once the next accumulation structure becomes clear. Patience and disciplined observation will be essential as the market defines its next directional bias.
Thanks for your support.
- Make sure to follow me so you don't miss out on the next analysis!
- Drop a like and leave a comment!

BITCOIN → Correction or trend reversal? Why is 101K important?BINANCE:BTCUSDT.P is exiting the upward channel after a false breakout of the key resistance level of 110K (previous ATH). Liquidation?
Quite an interesting situation with James Wynn. As they say, money loves silence, especially when it comes to a highly manipulated market... A week after the whale's actions, Trump decided to play the market again by creating emotional swings: he announced tariffs on the EU, canceled them, then made claims against China and is now ready to reintroduce tariffs on the EU. Things didn't end well with James... Liquidation before the rally?
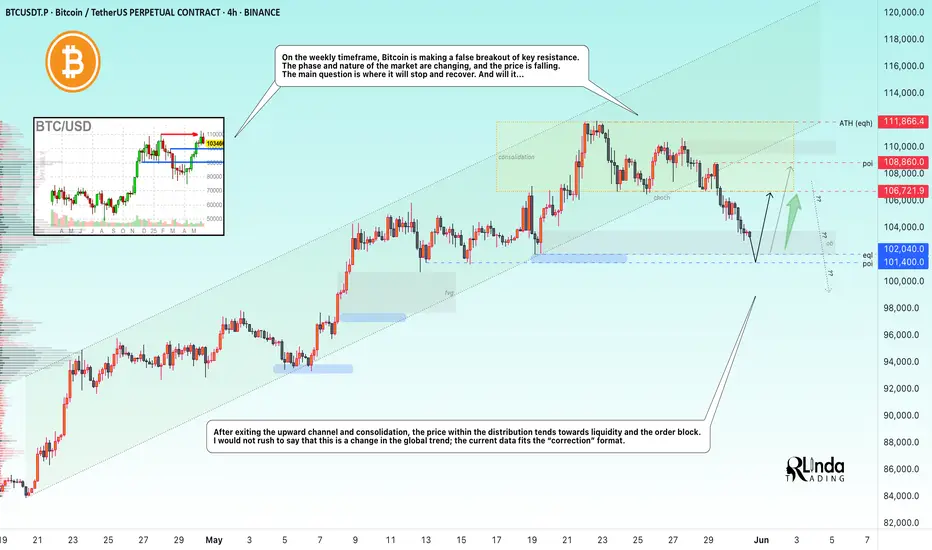
On the weekly timeframe, Bitcoin is making a false breakout of the key resistance level of 110K. The phase and nature of the market are changing, the price is falling, breaking the structural support of 106500. The main question is where the stop and recovery will be. And will there be one...
After exiting consolidation and the upward channel, the price within the distribution is moving towards liquidity and the order block. I would not rush to say that this is a change in the global trend; the current data fits the “correction” format.
Support levels: 102000, 101400
Resistance levels: 106700, 108800
102-100K is a fairly important zone for the market; a breakout in this area could open the way to a (local) bottom. Bulls may not be able to hold the market, in which case a global sell-off could form. Therefore, I believe that retesting the 102000 level will end with a liquidity grab and a correction along the trend, during which the price may test the 106K - 108K level, which will determine the future of the market: consolidation, growth, or decline...
Best regards, R. Linda!
SHORT Bitcoin 10X Lev. Full PREMIUM Trade-Numbers (PP: 175.6%)For experts only. This is not for beginners.
Leveraged trading is ultra-high risk and it is even harder when it comes to shorting.
This is not medical advice. This is not spiritual advice.
This is definitely not financial advice. This is just a chart and some numbers.
How you decide to use these numbers is completely up to you.
I am wishing you tons of luck and success; profits 100%.
This is a strong chart setup. It looks great.
_____
SHORT BTCUSDT
Leverage: 10X
Entry levels:
1) $111,111
2) $109,255
3) $108,000
4) $107,000
Targets:
1) $103,149
2) $101,012
3) $98,790
4) $94.239
5) $89,999
11) $88,888
Stop-loss:
Close weekly above $115,000
Potential profits: 175%
Capital allocation: 4%
_____
Thank you for reading.
If you enjoy the content make sure to follow.
(Leave a comment with your toughts.)
Namaste.

Bitcoin - 97,665 soon! Big drop on altcoins... (Buy here)I hope you sold in May and went away, as I recommended in my previous posts! If not, you probably wonder why Bitcoin is going down.
From a technical point of view, Bitcoin is breaking down out of the ascending parallel channel of the main uptrend from 74k to 112k. This is huge! Altcoins are already bleeding hard, and Bitcoin will go to 97,665 in the immediate short term. Why is this level so important? First of all, it's the 0.382 FIB level of the previous uptrend, and there is also an unfilled FVG (Fair Value Gap). This is a great level to buy Bitcoin for the next major wave to the upside.
The next strong level would be the 0.618 FIB and FVG2. These 2 Fibonacci levels are the strongest of all of them because of the golden ratio pattern and 0.618 + 0.382 = 1.000.
What we can also see on the chart is a symmetrical triangle inside this ascending channel. Usually the price wants to take liquidity above and below triangles, so be careful. There is an extremely high chance of sweeping liquidity below this symmetrical triangle. From the Elliott Wave perspective, we have finished the impulse wave 12345, and we are starting a huge ABC corrective pattern. Usually we want to look for a buying opportunity at the 0.382, 0.500, or 0.618 FIB levels.
Write a comment with your altcoin + hit the like button, and I will make an analysis for you in response. Trading is not hard if you have a good coach! This is not a trade setup, as there is no stop-loss or profit target. I share my trades privately. Thank you, and I wish you successful trades!

Bitcoin - This time different ?In 2021-22 bitcoin formed a higher high on weekly chart and then bear run of 2022 started, if we look at the bitcoin current chart the same pattern being formed.
Do you think bitcoin will form the similar pattern ? In my opinion it is highly unlikely that bitcoin will see similar pattern, in 2022 the second push was due to overall market euphoria which pushed the price to new high even though bear market was already on (Bitcoin hit new ATH after crashing 55% which is unusual)
If we look at the current pattern bitcoin had -30% crash, which is normal between bull runs, so its highly unlikely that bitcoin will similar fate as 2021.
Follow Our TradingView Account for More Technical Analysis Updates, | Like, Share and Comment Your thoughts.
Cheers
GreenCrypto

Bitcoin - Bulls in Control $113k Next targetBitcoin just delivered a textbook bullish reaction following a decisive liquidity sweep beneath the 4H range lows. Instead of continuing lower or entering a consolidation phase, price responded with immediate strength, snapping back with velocity, reclaiming structural levels, and rejecting decisively from a key Fair Value Gap (FVG). This kind of aggressive post-sweep price action usually signals the end of a stop hunt and the beginning of a new directional leg, which, given the current structure, is leaning heavily to the upside.
This is not just a random bounce, it’s a clear shift in intent. The behavior we’re seeing reflects a strategic move by smart money: first clear out liquidity from trapped longs and eager breakout sellers, then reverse and defend key zones that align with institutional discount pricing. The result? A bullish narrative that looks ready to drive price significantly higher.
Liquidity Sweep and FVG Reclaim
The initial sharp drive lower ran through the 4H lows, which had built up significant liquidity from both early long entries and breakout traders looking for continuation. This kind of move is engineered, designed to clean the board before a major shift. Price wicked deep into a 4H Fair Value Gap and immediately snapped back above it, closing strong and leaving behind a long lower wick. That reaction tells a story: there was demand waiting, and it stepped in with authority.
The Fair Value Gap wasn't just tested, it was respected. The fact that price closed back above the gap, after wicking through it, confirms it wasn't simply a liquidity grab but also a moment of rebalancing. The imbalance created earlier was filled efficiently, and the market moved on. That combination of liquidity sweep, deep FVG test, and bullish close is often what marks the end of manipulation and the beginning of a true move. It's a clear signal of smart money stepping in and defending value.
Structural Shift and Accumulation Signal
Following the sweep, the structure shifted rapidly. Price reclaimed the previous 4H support base that had been broken during the stop hunt, invalidating the bearish continuation thesis and instead suggesting accumulation. This is classic behavior after a manipulation low, price doesn’t hesitate or consolidate much, it simply turns with strength.
We’re also seeing signs of absorption and accumulation, particularly in the way price rejected cleanly from discount levels and stabilized within the FVG range. Multiple attempts to break down have failed, and the bounce wasn’t just reactive, it came with commitment. With each retest of the 110.3K resistance, that level weakens structurally. What began as resistance is now showing signs of turning into a launchpad.
If this is indeed the final leg of an accumulation phase, we should expect a marked expansion soon. The setup aligns with smart money accumulation logic: sweep liquidity, shift structure, trap shorts, and then displace with force.
Price Targets and Expectations
The 110.3K level remains the most immediate point of interest. It has acted as resistance multiple times, but each rejection has grown weaker. If price clears this level with conviction, ideally through a sharp displacement candle, the breakout has legs. Above that, we enter clean air with little resistance overhead.
The next logical target becomes 113K, which aligns both psychologically and technically with the next liquidity cluster. It’s an untested zone and represents the next area where sellers might appear. However, given the strength of the reversal and lack of major supply between 110.3K and 113K, price could move swiftly once the breakout is confirmed.
Longer-term, if momentum holds and Bitcoin maintains strength above 110.3K, we could see a retest of the all-time highs come into focus sooner than expected. But for now, the priority is to monitor how price interacts with 110.3K and look for signs of breakout strength or failed move traps.
Conclusion
Bitcoin isn’t in a boring range or slow grind, it just executed a classic liquidity play: sweep, react, reclaim. The reaction off the 1H Fair Value Gap that followed the 4H sweep is a strong signal that the market has shifted gears. With clear signs of demand stepping in and structure now favoring the bulls, the 110.3K level looks increasingly vulnerable. If that breaks, the path toward higher prices, including 113K and beyond, opens up fast.
The overall context has shifted from consolidation to directional expansion, and everything about the recent move points toward the bulls regaining control. Keep your eyes on the structure, the volume, and the displacement above key levels, the next leg could be explosive.
___________________________________
Thanks for your support!
If you found this idea helpful or learned something new, drop a like 👍 and leave a comment, I’d love to hear your thoughts! 🚀

TradeCityPro | Bitcoin Daily Analysis #102👋 Welcome to TradeCity Pro!
Let’s dive into Bitcoin and key crypto indices. As usual, in this analysis I’ll walk you through the triggers for the New York futures session.
⏳ 1-Hour Timeframe
As you can see in the 1-hour timeframe, yesterday we saw a bullish move that pushed the price up to and beyond the 109229 level.
🔍 In the previous analysis, I mentioned that if the price finds support before reaching 106192 and breaks above 109229, we could draw a support zone between the recent low and 106192. That’s exactly what happened — I’ve now marked the support range between 106192 and 107010.
💥 This is a critical support area, and if price revisits it later, it could act as a strong support. For now, the price is moving upward, and after breaking 109229, the next resistance is at 111747.
✔️ If you didn’t open a long position on yesterday’s trigger, you’ll need to wait for the break of 111747. If you already have an open position, you can hold it for now, as Bitcoin’s long-term trend is bullish and the move may continue.
📊 If buying volume increases and RSI breaks above 70 and enters the Overbought zone, bullish momentum will strengthen significantly, and the chances of breaking 111747 will increase.
📉 As for short positions or trend reversal — it's better not to consider them yet, as long as the price remains above the support zone. The uptrend is strong and offers better setups.
👑 BTC.D Analysis
Bitcoin dominance is still oscillating below the 64.32 level and hasn’t broken it yet. A local low has formed around 64.18.
🔔 A break above 64.32 would confirm the start of the next bullish leg in dominance. Conversely, breaking 64.18 could lead to a deeper correction toward 63.97 or even 63.50.
📅 Total2 Analysis
Yesterday, the descending trendline I highlighted was broken, and price moved up to 1.22.
✨ Breaking 1.22 would confirm the start of a larger bullish leg toward 1.26. If Total2 declines instead, we could enter on a break below 1.118.
📅 USDT.D Analysis
Yesterday, Tether dominance was rejected from the 4.62 resistance and also broke through 4.51.
🎲 If price moves toward 4.38 again, the probability of breaking this level will rise significantly — especially since a lower high has formed at 4.72, indicating that bearish momentum could be entering the market.
❌ Disclaimer ❌
Trading futures is highly risky and dangerous. If you're not an expert, these triggers may not be suitable for you. You should first learn risk and capital management. You can also use the educational content from this channel.
Finally, these triggers reflect my personal opinions on price action, and the market may move completely against this analysis. So, do your own research before opening any position.

Bitcoin Correction or Trap? Watch This Support Zone CloselyExclusive #Bitcoin Update
I got lots of DMs, people are asking:
Do you think the bull trend is finished, or is it just a correction and pullback?
Guys, first stop panicking.
This is exactly what the shark wants you to do. Don’t let them shake you out.
Let’s get to the chart:
My previous chart got invalidated, and the current situation is that CRYPTOCAP:BTC is defending strongly around the $104.8K to $104.3K support zone.
According to the FIB level, we’re currently at the 0.383 level. This area has previously served as strong resistance, so it can now function as effective support.
If bulls manage to bounce from this area and push above $107K, we could trigger a sharp move toward the $112K–$113K liquidation zone,
where we have almost $12B in short liquidations acting as a strong magnet!
Let's talk about the worst-case scenario, in case we break down below this supportive area, then we have
200 EMA and a strong support around $101.4k to $101.8k.
I’ll keep you posted as things unfold. If you find my updates helpful, don’t forget to like and follow for more! #Bitcoin2025
CRYPTOCAP:BTC BITSTAMP:BTCUSD BINANCE:BTCUSDT

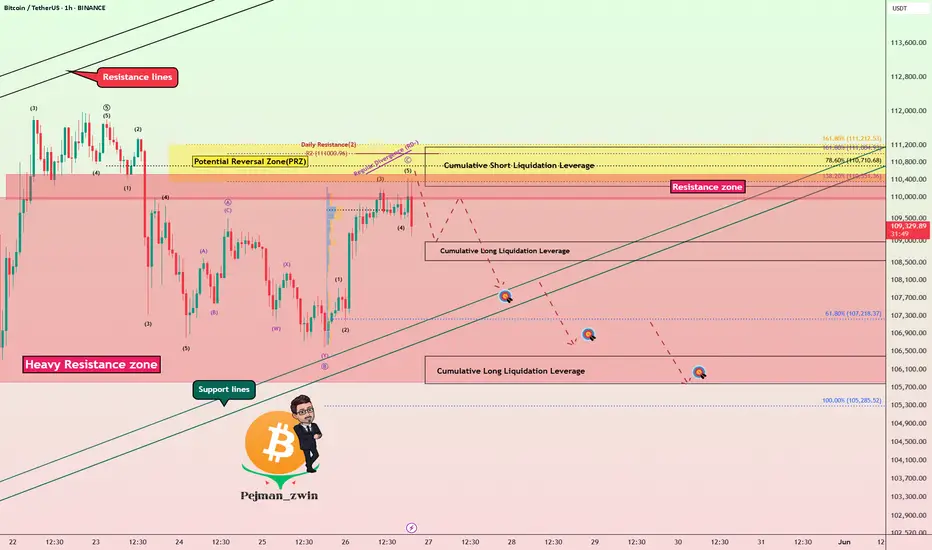
Bitcoin Bounce on Trump Tariff Delay – Short Setup Still Valid!Bitcoin ( BINANCE:BTCUSDT ) started to fall as I expected in the previous idea , and declined near the Support lines .
Bitcoin started pumping after the news that " US President Trump agreed to postpone 50% EU tariffs until July 9th ." Do you think this pumping of Bitcoin will continue?
Bitcoin is trading in a Heavy Resistance zone($110,000-$105,800) near the Potential Reversal Zone(PRZ) .
From the Elliott Wave theory perspective , Bitcoin appears to be in corrective waves , which is why I am labeling this idea as a ''Short''. The corrective waves structure is of the Expanding Flat(ABC/3-3-5) type.
I expect Bitcoin to attack the Support lines once again, and if these lines are broken, it will decline to the Targets I have indicated on the chart.
Notes :
MicroStrategy bought another 4,020 Bitcoins, but it didn't have much of an impact on the market.
If the Bitcoin price falls back below $109,000, about $185 million in long Bitcoin positions will be liquidated . = Attractive for exchanges
Bitcoin 2025 Conference to be Held in Las Vegas, Tuesday-Thursday = Could Cause Market Excitement .
Note: If Bitcoin touches $112,080, we should expect more pumping.
Please respect each other's ideas and express them politely if you agree or disagree.
Bitcoin Analyze (BTCUSDT), 1-hour time frame.
Be sure to follow the updated ideas.
Do not forget to put a Stop loss for your positions (For every position you want to open).
Please follow your strategy and updates; this is just my Idea, and I will gladly see your ideas in this post.
Please do not forget the ✅' like '✅ button 🙏😊 & Share it with your friends; thanks, and Trade safe.
BTC Correction's 📉 Significant Bitcoin Correction During Uptrend
After a strong bullish rally, Bitcoin has entered a correction phase, retracing nearly 25% of its recent gains. Interestingly, this correction aligns exactly with the 200-period moving average on the 4-hour chart, marking a potential key support level.
🔍 Is Bitcoin’s Correction Over or Just Beginning?
The overlap with the 200 MA could signal the end of the correction, but if this zone fails to hold, deeper targets between the 35% and 75% retracement levels may come into play.
🛡️ Potential Support Levels for Bitcoin if the Correction Continues:
First support: 102,200 USD – 25% correction
Second support: 93,200 USD – 35% correction
Third support: 84,100 USD – 50% correction
Fourth support: 74,600 USD – 75% correction

BTC Roadmap Still Intact Bullish Momentum Building Toward 120KBitcoin Price action continues to validate the bullish roadmap shared in our last BTC post. The market respected the Immediate Buy Back Zone, springing from a demand backed structure into a fresh impulsive leg.
Notably, price has carved a clean 5-wave structure supported by recurring bullish pennants and continuation patterns each breakout driving momentum higher. Our target at 120,151 remains firmly intact, with price action showing healthy structure and controlled pullbacks.
The current setup remains valid as long as price holds above 106,655 and especially 100,941, which now act as structural pivot zones. Any deeper correction into the Demand Area would only serve as a re-accumulation window before the next leg.
Let’s see how price behaves into June. Momentum is aligning with structure.
Share your thoughts, like the post, and drop your setup confirmations on the comment section.

Bitcoin (BTC/USDT) – Flag Breakout Points to $114KHello guys!
Bitcoin continues to respect the bullish structure within its ascending channel, and we just got a clean breakout from a textbook bull flag.
After a solid move higher earlier this month, BTC cooled off inside a tight flag pattern, consolidating above $106K. That pullback helped reset momentum, and now we’ve broken out with conviction.
You can read about it here:
We’re currently hovering around $ 109.8 K. A short-term retest of the breakout zone near $108K–$108.5K wouldn’t be surprising. it could even offer a great entry opportunity before the next leg up.
If momentum holds, the projected target from this flag pattern lands in the $113.5K–$114K zone.
watch these:
Support: $107.5K–$108.5K
Target: $114K
Invalidation: Break below $107K
Bias remains bullish unless we lose the channel structure.

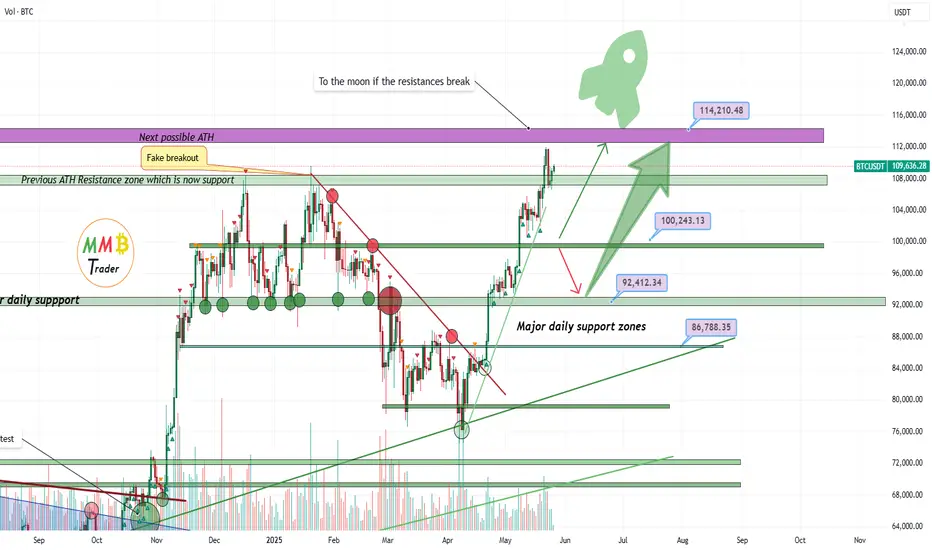
Bitcoin soon above 114K and market there would be nonstop pumpAs we can see price is near our possible ATH resistance zone which soon can break and any breakout there cause a bullish market which Alts will pump hard after a years of sleep.
Major supports are also mentioned on the chart too and previous ATH resistance zone now is strong support which retest also completed.
DISCLAIMER: ((trade based on your own decision))
<<press like👍 if you enjoy💚