4RRI Think the likelihood that we may have finished moving down on bitcoin is over, however, even if that is not the case, This may be a nice trade!
BTCUSDT trade ideas

BTC | Short Bias — Targeting $113kPrice rejected perfectly off the 0.5 retracement and is now filling the previous imbalance.
Yesterday's daily close was decisively bearish, confirming downside momentum.
There’s a lack of convincing reversal signals at current levels.
Plan:
Main expectation is continued downside toward the $113k support.
Not interested in longs until price stabilizes at or below that level.

BTC ~ will it make new lows!?Ideally its following the pattern i drew, and latter after NY session, it would claim the lows ideally after the buying activity I am antiiipating now!

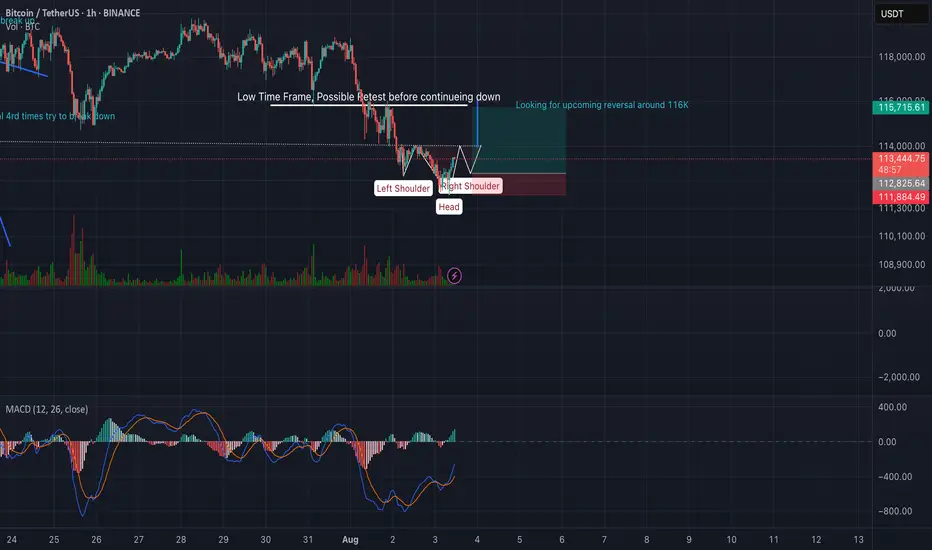
Low Time Frame Possible HnSThis chart illustrates a potential inverse head and shoulders pattern forming on a low time frame, signaling a possible short-term bullish reversal. The pattern is clearly marked with a Left Shoulder, Head, and Right Shoulder, suggesting a setup as shown.
The neckline area is labeled as a possible retest zone, where price may briefly revisit before either confirming the reversal or continuing the downtrend. A clean breakout and hold above this neckline would validate the pattern, with a projected upside target around 116K, as noted on the chart.
Risk management is visualized with a favorable risk-to-reward setup. However, a breakdown below the head would invalidate the pattern and imply further downside to the 110K 109K area.
This setup is ideal for traders watching for a short-term reversal, provided there is volume confirmation and alignment with broader market structure.
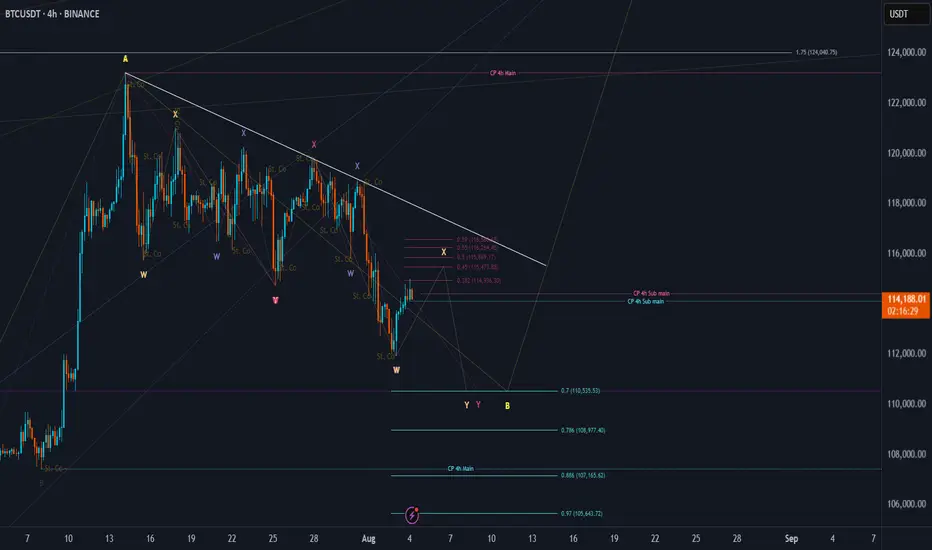
BTCUSDT: Elliot Wave AnalysisAs you can see in the chart, the fourth wave has ended and there is a possibility of an increase in the next stage to the level between 128,000 and 131,000, followed by a correction for a larger fourth wave and finally the last leg of the increase to the fifth wave, which has the possibility of reaching 139,000 to 140,000.

BTC PA📊 Price Action Analysis
Rejection at Major Supply Zone ($120K)
Price reached a strong supply/sell zone between $120K and $123K, marked in red.
$120,000: Psychological round number — major supply area.
Price got rejected after multiple days of consolidation under this level.
Support, Resistance Levels and Trendlines
$116,010: Horizontal S/R — acted as temporary support, now resistance.
$111,999.79: Key horizontal support.
Blue PA (D)s trendline has been broken bearishly — indicating a change in short-term market structure.
Momentum is currently in a pullback/retracement phase after strong rally from late June to mid-July.
Volume Analysis
Volume is declining during the pullback — typical of retracements and not full-blown reversals.
No major volume spike indicating panic selling.
Fibonacci Retracement Analysis (Recent Swing High to Swing Low)
Key levels:
0.786: $117,820.25 — Rejected here.
0.618: $113,626.61 — Currently testing this level, price slightly above.
0.5: $110,681.08 — Next support if rejection at 0.618 persists.
0.382: $107,735.54
0.236: $104,091.07
0%: $98,200.00 — Full retracement base.
Price is showing hesitation at the 0.618, which is a crucial level in Fibonacci theory. A break and hold below this could accelerate the drop toward $110.6K and beyond.
RSI Analysis (Daily)
RSI is around 46.46 — moving below midline (50), showing weakening momentum.
Bearish divergence confirmed: price made a higher high while RSI made a lower high → bearish reversal signal.
Bullish if:
BTC reclaims $116K, closes above $120K — invalidates rejection.
RSI bounces from current level with volume support.
Bearish Bias:
Currently, structure broke down.
Testing 0.618 Fib level; failure here likely brings price to: $110,681

Bitcoin Traps Bulls and Bears – Real Move Next?Bitcoin is trading in a descending channel on the 4H chart, with two recent fakeouts — one above resistance and one below support — trapping traders on both sides. After reclaiming support, BTC is pushing toward the upper boundary with rising volume, hinting at strong demand. A breakout above $119K could drive a rally toward $125K–$135K.
Cheers
Hexa
BINANCE:BTCUSDT BITSTAMP:BTCUSD

BTC Price Prediction and Elliott Wave AnalysisHello friends,
>> Thank you for joining me in my analysis. I think we need to extend the pink wave Y as wxy in purple counting => W, and then XY as orange counting. This all happened after getting the green D with not preferred closing as I mentioned yesterday.
Keep liking and supporting me to continue. See you soon!
Thanks, bros
BTC Trade Plan 03/08/2025 - where to buy BTC?Dear Trader,
Bitcoin's price is currently moving within a double channel, with the midline of the channel around 108,000. The first scenario is that the price reaches the midline of the channel and then starts an upward movement. The second scenario involves a sharp downward move towards a stop hunt target around 97,000-100,000. In both cases, as long as the price remains above the 100822 level(Daily Close), the bullish trend will continue.
Regards,
Alireza!

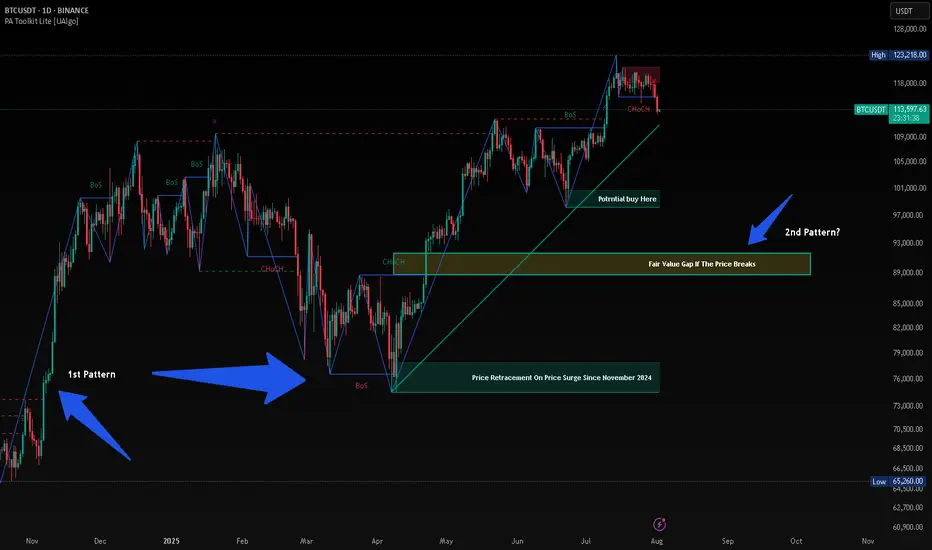
BTC HUNTS LIQUIDITYThis is just my opinion, BTC will hunt liquidity before taking new High. Since November 2024 after President Trump was elected, the price of BTC surge from $74,000 and retrace almost the same price on April 2025 after taking its new High. History will repeat itself and when history failed, there will be a long Bearish at least 90%.
$BTC Retest Before Takeoff?Back on July 27, I shared a path 120K → 114K → 127K
Price has followed this playbook closely and now we’re at a critical zone again.
On daily timeframe, structure is still in an uptrend, but momentum is fading.
Price is consolidating between 119.9K–120.1K (Fib 61.8–65%) and 117.8K–116.6K (Fib 38.2–23.6%). MACD bearish crossover and histogram is still growing. RSI is neutral at 51 but definitely losing bullish energy.
If 117.8K breaks cleanly, we may revisit 114.7K (demand zone + full Fib retracement) before bulls reclaim control.
If we look at lower timeframe (4H). It is forming a tight range, but a lower high + weakening MACD suggests a bit more downside short term. Also, RSI at 46 confirms that consolidation with mild bearish tilt.
Key levels that I am currently looking are 118.8K–117.8K for the short-term intraday range play. And 116.6K & 114.7K for the support & potential bounce zone.
The scenario is still in play
- Rejection at 120K
- Retest 114K–116K zone
🚀 Then potential launch toward 127K (measured move + channel top)
Only a daily close above 120.1K with volume invalidates this retrace idea.
TL;DR
🟥 Resistance: 119.9K–120.1K
🟧 Neutral zone: 117.8K–118.9K
🟩 Support: 116.6K - 114.7K
🟦 Target: 127K if bulls reclaim the high ground
Still playing the patient game. Let’s see if 114K gets tagged one more time. What do you guys think?

BTCUSDT – 1H Chart Analysis |Critical Retest at Broken trendline
📅 \ Date:\ August 5, 2025
⏰ \ Timeframe:\ 1H
📍 \ Exchange:\ MEXC
💱 \ Pair:\ BTC/USDT Perpetual Futures
---
\ 📉 Trendline Breakdown and Retest\
BTC has broken below the ascending trendline and is now retesting it from the underside. This setup often signals a \ bearish retest\ , especially when momentum is weak and rejection wicks appear near previous support turned resistance.
Last rejection came around \ \$114,800\ , right at the underside of the broken trendline.
---
\ 🔍 Key Technical Levels\
* \ Resistance:\ \$114,800–\$115,000 (confluence of trendline + supply zone)
* \ Support:\ \$113,300 (horizontal green zone, strong historical demand)
Failure to reclaim the trendline might open the path toward \ \$113,300\ . A strong breakout above the trendline may flip bias short-term bullish.
---
\ 📊 Indicators Overview\
\ MACD\ :
• Bearish momentum is fading
• Bullish crossover is forming but not yet confirmed
• Needs clearer separation and histogram recovery for confirmation
\ RSI:\
• Currently at \ 49.43\ , struggling to cross the midline
• Facing resistance near \ 53.14\
• Neutral to slightly bearish momentum
---
\ ⚠️ What to Watch\
🔺 \ Bullish Scenario:\ Break and close above \$115,000 → continuation toward \$116,200
🔻 \ Bearish Scenario:\ Rejection at trendline → decline toward \$113,300
---
\ 🧭 Conclusion\
BTC is at a decision point. The next few candles will likely confirm whether this is a failed breakdown or a clean rejection. Watch volume and candle closes carefully.
\ Patience is key – confirmation is everything.\
---
\ #Bitcoin #BTCUSDT #TechnicalAnalysis #Trendline #MACD #RSI #SupportResistance #CryptoTrading\

BTCUSD NEW OUTLOOK Btcusd buy from 115,000
Target1 116,000
Target2 117,000
Target3 118,000
Stope lose 113,500
TRADE AT YOUR OWN RISK

Bitcoin (BTC): Bullish Start of Week | Eyes on $110KOur attentions are currently at $110K on BTC, where we maintain the bullish plan as long as we are above that zone.
This zone is marked as the BOS area for us, where currently we are seeing the price has retested it and bounced right off again, leading the price back to upper zones here.
So once again, as long as we maintain that area, we are bullish; if we break it, we are going to look for that Bollinger Bands middle line!
Swallow Academy

BITCOIN BULLISH POSSIBLE VIEW🧠 Key Observations (Smart Money Concepts - SMC Style)
🔄 Market Structure:
MSS (Market Structure Shift): Price recently made a MSS after a BOS (Break of Structure), indicating a shift to bullish structure.
BOS (Break of Structure): Seen on the move up from the demand zone.
SSL (Sell-side Liquidity) taken before the recent bullish move — classic liquidity sweep behavior.
📦 Zones:
Demand Zone: Between ~$111,000 and ~$113,000
4HR Supply Zone: Around ~$115,000 to ~$116,000 — where price is currently reacting.
Golden Zone (Entry/POI): Near the origin of the move that caused the BOS.
📍 Entry & TP/SL Setup:
Buy Limit: Placed at 111,931.32, right at the edge of the demand block.
Stop Loss (SL): Set just below at 110,453.42
Take Profit (TP): Targeting 113,676.39, right before the next resistance.
📊 Volume Analysis:
Large bullish volume spike aligns with the most recent BOS.
Diminishing sell volume during retracement suggests exhaustion of bearish momentum.
✅ Trade Idea (Based on Chart Setup):
Bias: Bullish
Entry: 111,931.32 USDT
Stop Loss: 110,453.42 USDT
Take Profit: 113,676.39 USDT
Risk/Reward: ~1:1.5 to 1:2
🔍 Additional Notes:
Liquidity Sweep: SSL cleared → indicates potential for long setups.
BOS + MSS Confluence: Bullish intent confirmed.
BB (Break of Block): Indicates intent to move higher if resistance is broken.
ERL Target: Final target is shown far above current price, near 123,280.88, could be a longer-term swing target if price holds structure.
🔄 Next Steps (as per typical TradingView publish ideas):
Set alerts at the demand zone.
Monitor price action when it taps into the Buy Limit level.
Watch for confirmation candle or volume spike before manual execution (if not using limit orders)

BTC Price Prediction and Elliott Wave AnalysisHello friends,
>> Thank you for joining me in my analysis. We finished the pink Y wave as wxy in purple counting. Now we are moving into creating a confirmation for starting the Big Yellow C wave.
>> our confirmations:
* 4Hr TF: I need to close above the 113420 level.
* 1D TF: I will prefer to close below 113297 and above its opening 112550, and the next double days break today's high.
Keep liking and supporting me to continue. See you soon!
Thanks, Bros

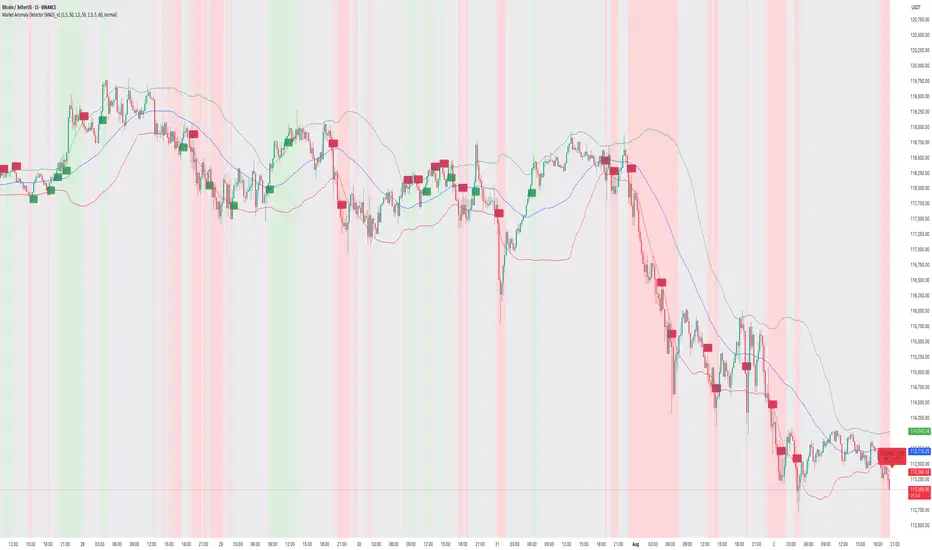
How to Capture Reversals/Breakouts with MAD IndicatorBTC/USDT 15M – Market Anomaly Detector (MAD) Captures Reversals & Breakouts
⸻
Description:
On this BTC/USDT 15-minute chart, the Market Anomaly Detector (MAD) is actively highlighting high-probability market turning points and anomaly zones.
Key Observations from the Chart:
1. Green & Red Zones = Expected Price Range
• Green Line (Upper Band): Expected top of the range.
• Red Line (Lower Band): Expected bottom of the range.
• Price usually travels green → red → green, forming a natural oscillation.
2. Buy/Sell Signals = Breakout + Reversal Detection
• Buy Signal: Triggered when price closes above the green line or recovers from below the red line.
• Sell Signal: Triggered when price closes below the red line or rejects from the green line.
• This reverse psychology logic helps catch false breakouts and stop-loss hunts.
3. Performance on This Chart:
• Signals aligned with key reversals during the sideways-to-downtrend transition.
• The strong downtrend in the second half of the chart shows multiple accurate sell signals, confirming trend continuation.
• Sideways movements had minimal false signals due to cooldown + volume filter.
4. Unique Advantage (USP):
• Statistical approach using Z-Score & Standard Deviation.
• Multi-filter confirmation with RSI, volume, and higher timeframe trend.
• Visually clear anomaly zones:
• Green background = Bullish anomaly
• Red background = Bearish anomaly
• Gray background = Neutral range
Takeaway:
MAD helps traders anticipate anomalies rather than react late, offering high-probability trade entries and reversals in trending and volatile conditions.
BTCUSDT 1D – Retesting Key Support, Will Bulls Hold the Line?Bitcoin is retesting a crucial structural support level around $112K after its recent local top near $120K. This zone previously acted as resistance and is now being tested as support — a textbook bullish continuation signal if it holds.
Historically, these flips (from resistance to support) have triggered strong upside momentum, as seen after the $78K breakout earlier this cycle. However, failure to hold this level could open the door for a deeper correction toward $100K or even the $90K region.
This chart outlines the major structural zones:
Long-term accumulation base near $70–78K
Resistance flip zone at $110–112K
Local resistance near $120K
📌 If bulls defend this zone and reclaim momentum, we could see another push toward cycle highs. If not, patience is key — the next high-conviction entry may come lower.
How are you positioning around this zone? Let me know in the comments 👇

#BTC Update #14 – Aug 02, 2025#BTC Update #14 – Aug 02, 2025
Unfortunately, Bitcoin has closed below its current channel and now appears to be retesting that level. If this retest confirms, I expect a pullback down to the $110,000 zone. However, if Bitcoin manages to re-enter the channel, its first target will be $118,800. Although it’s a descending channel, moving within it suggests a relatively stable market. Closing below it may not end well and could deepen the retracement. That's why I recommend caution with all coins right now.
Even though it seems like a distant possibility at the moment, don’t forget there’s also an imbalance zone around the $103,500 level. A sharp wick or a significant drop could bring Bitcoin back to revisit that area. The probability is currently low, but it can’t be ruled out completely. I don’t recommend rushing into any long or short positions at this stage.

BTC Next Move Toward $150K?Bitcoin recently broke out above a long-standing resistance zone ($110K–$115K), supported by a clean move through the volume profile high node. After testing local highs, BTC is now pulling back to retest the breakout area, a critical level that could act as new support.
Key Points:
Breakout Retest: Price has pulled back into the breakout zone around $114K, aligning with strong previous resistance that may now flip to support.
Volume Profile: A strong high-volume node is visible below ($105K–$110K), which reinforces this area as a major demand zone.
EMA Confluence: The 50-day and 100-day EMAs are trending upward and aligning near the retest area, providing additional support.
If this level holds, BTC could resume its bullish leg toward the $150K level.
Cheers
Hexa

BTC/USDT Analysis: Testing Strong Support
Hello everyone! This is the daily analysis from CryptoRobotics' trader-analyst.
Yesterday, we tested the local support zones previously marked and moved into a decline. At 21:00 (GMT+3), the U.S. Federal Reserve released its monetary policy statement, which included hawkish comments regarding inflation risks. The interest rate remained unchanged. The market reacted negatively to this news, and Bitcoin accelerated its drop.
At one point, a key buyer zone at $116,200–$115,000 (volume anomalies) was tested. Then, between 21:30 and 22:00 (GMT+3), a report from the White House on digital assets was released, shifting focus toward a more positive regulatory outlook. Bitcoin bounced from the mentioned zone and has since fully recovered the drop.
Currently, there are no immediate resistance levels, so in the near term, we’re likely to see a test of the ~$120,000 level. There, it's important to watch for any signs of selling pressure.
Buy Zones:
• $116,200–$115,000 (volume anomalies)
• $110,000–$107,000 (accumulated volume)
This publication does not constitute financial advice.

#BTC Update #12 – July 31, 2025#BTC Update #12 – July 31, 2025
Bitcoin is currently at the upper boundary of the channel it has been following. It may experience a pullback from this upper boundary. This pullback is estimated to reach the $116,800 level. If it wants to go lower, it could drop as far as the $114,500 level.
There is a significant amount of liquidity between $121,000 and $117,000. Bitcoin may also try to sweep this area. However, despite 4 or 5 attempts, it still hasn’t managed to break above the upper resistance zone. Therefore, a pullback should always be taken into account.
Overall, Bitcoin is still in a correction within a correction. That means no impulsive move has occurred yet. It’s not at a suitable point for either long or short positions. You may choose to trade within this range, but keep in mind that it's quite risky.

BTC 4H – Retest Holding, But Golden Pocket BelowBitcoin’s 4H chart is at a key decision point. After a strong breakout in early July, price has been consolidating just above the prior resistance zone — now acting as support. This white box represents a major reclaim level that has held multiple times, but buyers are starting to look fatigued.
Below this support lies a clean Fibonacci retracement zone:
0.5 at 110,971
0.618 (Golden Pocket) at 108,072
0.786 deeper pullback at 103,945
The structure remains intact for now, but a loss of the current level could trigger a deeper sweep into one of these fib levels — especially with momentum (Stoch RSI) resetting from oversold.
A potential bounce here keeps the uptrend alive. However, if the zone breaks, the .618 area may be the magnet.
📊 Watching for:
Strong reaction or absorption at this support
Bullish divergence forming
Sweep into golden pocket followed by reversal structure
This setup blends price action, key S/R levels, and Fib confluence — a great chart for anticipating the next move, not reacting to the last one.
