Bearish sign on BTC targeting 97kmy idea on btc as per the chart watch 110 level if broken then 102k then 97k
BTCUSDT trade ideas

BTCUSDT – Diametric G-Leg Underway?⏱ Timeframe: 4H / 1H
🔍 Method: NeoWave + Smart Money Concepts (SMC)
📍Posted by: CryptoPilot
⸻
🧠 NeoWave Progression Update
As outlined in our previous analysis, we are tracking a potential Contracting Diametric structure (A–G) originating from the March 2025 highs.
🚨 The G-Leg may now be actively unfolding.
Here’s what just happened:
• Price rejected sharply from the supply zone near 119,000–119,500, exactly where Wave F was expected to end.
• After a drop to 115,780 (minor trendline), price bounced, but failed to make a new high, stalling at 118,700, forming a lower high → classic signature of a developing G-Leg.
• This G-wave likely aims to break below Wave E low, seeking imbalance fills and structural resets.
⸻
📊 Smart Money Confluence (SMC / ICT)
• 🟥 Bearish Market Structure confirmed via MSS on 1H: Lower Highs + Internal BOS
• 🟨 Buy-side Liquidity above 120k was already swept
• 🔻 Price failed to reclaim OB block around 119.5k
• 🧩 FVGs remain open between 114.5k–113k, acting as magnet zones
• 📉 Expectation: Price may now break the ascending minor trendline and accelerate toward the major structure low
📌 Primary Scenario:
• Wave G of Diametric in motion
• Potential structure: Zigzag or Complex Combination
• Expectation: Bearish continuation to break below 113k
📌 Alternative Scenario:
• If price closes above 120.5k, diametric structure may be invalidated
• Watch for triangle/flat development instead
⸻
⚠️ Risk Management Note:
Price action near 118.7k–119.5k is crucial. Reclaiming that zone with strength changes the bias. Until then, sellers remain in control.
💬 Final Thought:
We’re tracking the final stages of a multi-month complex correction. The rejection at supply, combined with SMC signals and NeoWave symmetry, suggests sellers may push price into deeper demand zones soon.
⸻
📌 Follow CryptoPilot for advanced wave structure updates, market geometry insights, and ICT-style smart money traps.
💬 Share your views or alternate wave counts in the comments!

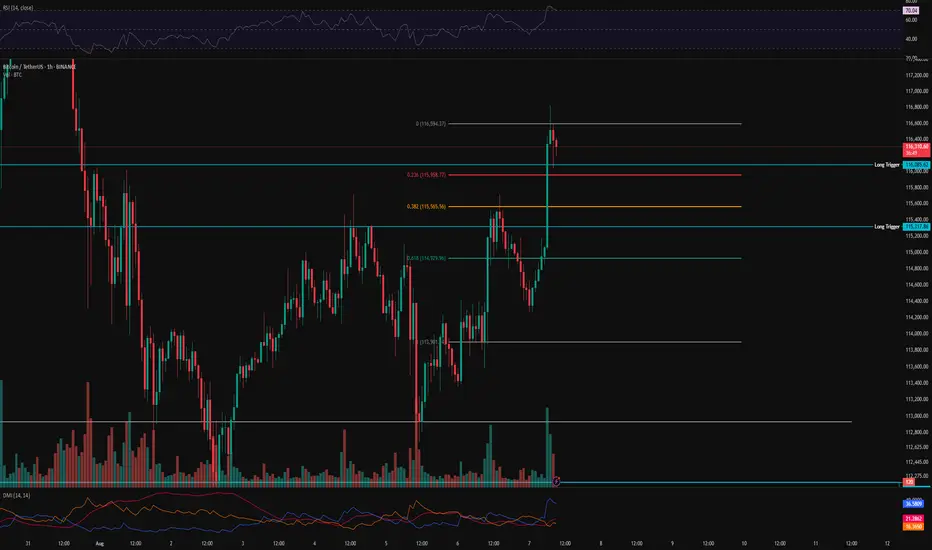
BTC 1H Analysis – Key Triggers Ahead | Day 4💀 Hey , how's it going ? Come over here — Satoshi got something for you !
⏰ We’re analyzing BTC on the 1-hour timeframe .
👀 After triggering our long entry levels , Bitcoin faced increased buying volume , and the U.S . unemployment claims came in higher than expected, which was interpreted positively for the crypto market .
🔼 With rising buying volume, Bitcoin may continue moving toward higher levels and could even aim for a new local high. Our key support zones are the same trigger levels we've been watching—these are also our ideal long entry points .
⚡️ There is a strong resistance around $117,000, where taker sellers are actively selling their Bitcoin at premium prices. In order to break through this area, we’ll need solid volume inflow from both market makers and retail buyers .
⚙️ There’s no clear RSI support zone at the moment, since on the 1-hour chart RSI is already in the Overbought area and oscillating there .
📈 Long position : Be a bit patient here . Wait for Bitcoin to pull back to key Fibonacci levels , preferably around 0.236 and 0.382, and then bounce back up . Once we break above the pullback, you can consider entering a long trade .
📉 Short position : A short setup could form only if both of our marked trigger levels get stop -hunted, combined with increased selling pressure , support breakouts , and confirmation from bearish candlestick patterns.
That said — we are not looking to short right now, as there are better opportunities to catch strong long entries .
❤️ Disclaimer : This analysis is purely based on my personal opinion and I only trade if the stated triggers are activated .
BTC Hourly Analysis – Day 1 | Trend Structure & Key Reactions⏱️ We’re analyzing Bitcoin on the 1-hour timeframe.
👀 After breaking below its support zone at 107,402, Bitcoin experienced a correction along with increasing sell pressure. The price then moved toward the 112,200 support area, where it formed a V-pattern — which has now been broken to the upside.
🎮 We’re using Fibonacci levels to identify key resistance zones and long-entry triggers. A higher low has formed above the 112,217 support and above the 0.382 Fib level, which could serve as a strong confirmation of the breakout .
⚙️ The RSI oscillator on the 1H chart is currently above 50. If buying volume increases, RSI may enter the Overbought zone. The critical level here is 70 — breaking above it can act as a confirmation for a long position .
☄️ A specific Fibonacci-based zone, linked to market maker sellers and supply pressure, was touched, triggering a reaction — around 177 BTC were sold following that touch .
🖥 Summary : As long as Bitcoin stays above its previous high, there’s no immediate concern for long positions. Based on the confirmations above, you may consider entering a long position upon a resistance breakout and taker-seller zone clearance .
📉 No short positions are planned until the 110,000 support level is clearly broken .
Important Volatility Period: August 2nd - 5th
Hello, fellow traders!
Follow us for quick updates.
Have a great day!
-------------------------------------
(BTCUSDT 1M Chart)
Let's take a moment to check the trend before the new month begins.
There have been two major declines so far, and a third major decline is expected next year.
For the reason, please refer to the "3-Year Bull Market, 1-Year Bear Market Pattern" section below.
-
My target point for 2025 is around the Fibonacci ratio of 2.618 (133889.92).
However, if the price surges further, it could touch the Fibonacci range of 3 (151018.77) to 3.14 (157296.36).
If it rises above 133K, it's expected that prices will never fall below 43823.59 again.
Since the HA-Low indicator hasn't yet been created on the 1M chart, we need to monitor whether it appears when a downtrend begins.
Based on the current trend, the HA-Low indicator is expected to form around 73499.86.
More details will likely be available once the movement begins.
-
The basic trading strategy involves buying in the DOM(-60) ~ HA-Low range and selling in the HA-High ~ DOM(60) range.
However, if the price rises above the HA-High ~ DOM(60) range, a step-up trend is likely, while if the price falls below the DOM(-60) ~ HA-Low range, a step-down trend is likely.
Therefore, the basic trading strategy should be a segmented trading approach.
The further away from the HA-High indicator, the more likely it is that the DOM(60) indicator will act as a strong resistance when it forms.
Therefore, if the current price and the HA-High indicator are trading far apart, and the DOM(60) indicator forms, it is expected to face significant resistance.
-
Looking at the current trend formation, the high trend line is drawn correctly, but the low trend line is not.
This is because the StochRSI indicator failed to enter the oversold zone.
Therefore, the low trend line is marked with a dotted line, not a solid line.
Therefore, what we should pay attention to is the high trend line.
We need to see if the uptrend can continue along the high trend line.
-
(1D chart)
If we use the trend lines drawn on the 1M, 1W, and 1D charts to predict periods of volatility, the periods around August 5th and August 13th are significant periods of volatility.
By breaking this down further, the volatility periods are around July 31st, August 2nd-5th, and August 13th.
Therefore, trading strategies should be developed based on the assumption that the volatility period extends from July 30th to August 14th.
The current price is moving sideways in the 115,854.56-119,177.56 range.
This range, the HA-High ~ DOM (60), is a crucial area to consider for support.
This will determine whether the price will continue its upward trend by rising above 119,177.56, or whether it will turn downward by falling below 115,854.56.
If the price falls below 115854.56, it is expected to meet the M-Signal indicator on the 1W chart and reestablish the trend.
The HA-High indicator on the 1W chart is forming at 99705.62, and the DOM (60) indicator on the 1W chart is forming at 119086.64.
Therefore, when the price declines, it is important to check where the HA-High indicator on the 1W chart forms and determine whether there is support near that point.
-
The On-Board Value (OBV) indicator within the Low Line ~ High Line channel is showing a downward trend.
If the OBV falls below the Low Line, the price is expected to plummet.
Therefore, it is necessary to closely monitor the movements of the OBV indicator.
The Trend Check indicator is a comprehensive evaluation of the StochRSI, PVT-MACD Oscillator, and On-Board Value (OBV) indicator.
The TC (Trend Check) indicator interprets a rise from the 0 point as a buying trend, while a decline indicates a selling trend.
In other words, a rise from the 0 point is likely to indicate an uptrend, while a decline is likely to indicate a downtrend.
Currently, the TC (Trend Check) indicator is below the 0 point, suggesting a high probability of a downtrend.
However, if the TC (Trend Check) indicator touches a high or low, the trend may reverse.
In other words, touching a high increases the likelihood of a reversal from an uptrend to a downtrend, while touching a low increases the likelihood of a reversal from a downtrend to an uptrend.
When such movements occur, it's important to consider the support and resistance levels formed around the price level to determine a response.
In other words, consider the support and resistance levels formed at the current price level.
As a significant period of volatility approaches, prepare to transition from box trading to trend trading.
-
Thank you for reading to the end.
I wish you successful trading.
--------------------------------------------------
- Here's an explanation of the big picture.
(3-year bull market, 1-year bear market pattern)
I'll explain more in detail when the bear market begins.
------------------------------------------------------

BITCOIN → Correction within a downward channel. 112K or 125K?BINANCE:BTCUSDT is consolidating. However, a local downward trading range is forming relative to the current setup. What is the probability of a correction continuing to 112K or growth to 125K?
Daily structure: a local correctional channel within a global bullish trend. We have cascading resistance at 119.2, 119.6, 120, and 120.8. It will be quite difficult to break through this zone on the first attempt, but MM can use it to form traps and collect liquidity.
At the bottom, everything is simpler — a breakdown of the local bullish structure, the formation of an intermediate minimum, below which there is a void down to 112K.
Yesterday, relative to 115-116K, mm staged a massacre (trap) on both sides of the market.
Liquidity collection, return to the range, and growth. The reaction to the false breakdown of support is quite strong. Since the opening of the session, Bitcoin has been heading towards resistance, but there may not be enough potential to break through the upper resistance conglomerate, so I expect to see a pullback or decline to 116-115-114.
Resistance levels: 119.2, 120.1, 120.85
Support levels: 116.37, 115.67, 112
Technically and fundamentally, I do not see any drivers that could support the market (I am talking about Bitcoin, since the driver for altcoins is the decline in Bitcoin's dominance). It is possible that this may appear later. In the current situation, I am considering a false breakout and correction, as the market has not yet finished consolidating or correcting, and the current downward trading range may be extended.
PS: As the price moves towards resistance, it is necessary to monitor the reaction. The market itself will show what it is preparing for...
Best regards, R. Linda!

#BTC enters neckline resistance zone📊#BTC enters neckline resistance zone⚠️
🧠From a structural perspective, we hit the daily neckline support and began to rebound. Unfortunately, it's about $170 away from the overlapping support zone I'm focused on, and the rebound didn't establish a 1-hour bullish structure. This suggests a high probability of encountering resistance and a pullback after this rebound. Therefore, don't chase the rally at the neckline resistance zone! Only if we can break through the neckline resistance zone and stabilize for a day or so should we actively consider a bullish move.
➡️Support is clearly around 120,000. Even if it falls below this level, as long as the 4-hour closing price is above it, this support level will remain valid. Extreme support is still around 110,000!
🤜If you like my analysis, please like 💖 and share 💬
BITGET:BTCUSDT.P

BTCUSDT | Cup & Handle Breakout Forming – Key Resistance Ahead!Bitcoin is forming a classic Cup and Handle pattern on the 4H chart, indicating potential for a bullish breakout.
🔹 Key Highlights:
Clear bullish momentum after a confirmed ChoCH (Change of Character)
Bearish trendline has been broken, shifting market structure
Price approaching the resistance area near $120,000, which aligns with a strong high
Watch for breakout above the target zone for potential continuation
MACD shows bullish divergence supporting momentum
📌 A clean break and close above the resistance zone could trigger the next leg up. However, a rejection here may retest the $112,000–$114,000 demand zone (handle support).
🧠 Not financial advice. Always do your own research before trading.

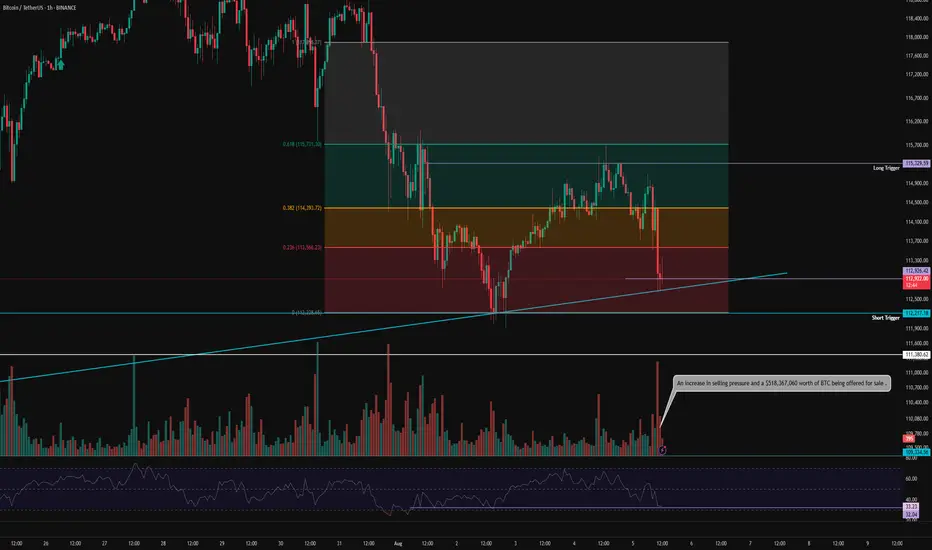
BTC 1H Analysis – Key Triggers Ahead | Day 2💀 Hey , how's it going ? Come over here — Satoshi got something for you !
⏰ We’re analyzing BTC on the 1-hour timeframe .
👀 After the strengthening of the US dollar , Bitcoin experienced a drop and formed a short-term support bottom around the $113,000 level . It is currently completing a pullback to the levels of this recent decline .
🎮 Our Fibonacci retracement is drawn from the breakout zone to the $112,200 bottom . Bitcoin broke below the 0.236 level and then found support . The best potential entry trigger, based on Fibonacci, is at the 0.382 level, or around $115,000 . If Bitcoin breaks above this level , it could form a higher high and a higher low in this timeframe .
⚙️ The RSI is showing a support level around 32 , which is currently preventing Bitcoin from entering the oversold zone . However , if this support is lost , Bitcoin could move into oversold territory .
📈 Our long position trigger is at the 0.382 Fibonacci level . A confirmed breakout of this level , combined with RSI overbuying and increased volume , would be our entry signal .
📉 Our short position trigger is around $113,000 . If this support breaks , we may open a short position . However, the main short trigger is at the 0 Fibonacci level ( support at $112,200 ) . If selling pressure increases and RSI enters the oversold zone , we will consider entering a short position with confirmation .
❤️ Disclaimer : This analysis is purely based on my personal opinion and I only trade if the stated triggers are activated .

BTC_TRADING IDEA 08/01/25So we had a nice retracement. I’m now patiently waiting in a discount zone, aiming for a MTF LQ.
I have plenty of reasons to wait here:
– FVG
– OB
– OTE
If it doesn’t play out, I’ll look for another PD Array.
Let’s see!

Is the current Bitcoin price a good place to buy?Bitcoin has been falling since last night towards $112,000. I don't think it will go below that. I think $113,000 is a good price to buy. Of course, with a stop loss of 111,500. This is not a financial offer. Don't get into futures trading because you might lose all your money.

BTCUSDT: A Bullish Foundation Meets Fibonacci FirepowerBTCUSDT: A Bullish Foundation Meets Fibonacci Firepower
BTCUSDT is currently at a critical juncture, navigating a significant upward trendline and a key Fibonacci retracement level. The chart highlights the ongoing battle between buyers and sellers following a strong multi-month rally. Price action is testing a major confluence zone, which will likely determine the immediate future direction of the market.
1. The Bullish Foundation (Late March - July):
• Long-Term Uptrend Line (White): A prominent upward-sloping trendline originating from the late March lows has defined the bullish narrative. Price has consistently found support on this line, demonstrating a strong underlying buying interest and a disciplined ascent. This trendline has been a reliable gauge of the market's health and a key area for bulls to defend.
• Fibonacci Retracement Levels: When we apply the Fibonacci retracement tool from the recent swing low to the all-time high, several potential support areas are identified. These levels are critical for understanding potential pullbacks and market structure.
2. The Current Inflection Point (Late July - August):
• Confluence Zone: The market is currently engaging with a high-stakes confluence zone. This area is defined by two key technical indicators:
o The Long-Term Uptrend Line: Price is testing this foundational support line for the first time since the July peak. A bounce from this level would reinforce the long-term bullish bias.
o The 0.236 Fibonacci Level (~$111,804): This is the first level of support in the Fibonacci sequence. The market is finding temporary footing here, and a decisive break below this level would be a bearish signal, suggesting a deeper retracement is likely.
3. Potential Scenarios:
• Bullish Continuation : The most optimistic scenario involves a successful defense of the current confluence zone. A strong bounce from the white uptrend line and the 0.236 Fibonacci level, backed by increased buying volume, would signal that the bulls are still in control. In this case, a re-test of the recent all-time highs would be the next logical target.
• Bearish Retracement : If the confluence zone fails to hold, and BTCUSDT breaks decisively below the trendline and the 0.236 Fibonacci level, it would suggest a deeper correction is underway. The next major support zone to monitor would be:
o The 0.382 Fibonacci Level (~$104,666) : This level has historically acted as both support and resistance, making it a critical psychological and technical area. A drop to this zone would likely be met with renewed buying interest.
o The 0.5 Fibonacci Level (~$98,897) : A move to this level would signal a more significant correction, potentially testing the psychological $100,000 mark.
Conclusion:
BTCUSDT is at a pivotal moment. The market's reaction to the current confluence of the long-term uptrend line and the 0.236 Fibonacci retracement level will dictate the short-to-medium-term direction. A bounce from here would confirm the strength of the uptrend, while a break lower would open the door for a deeper retracement toward the next key Fibonacci levels. Traders should closely monitor price action and volume at these critical levels for confirmation of the next directional move.
Disclaimer:
The information provided in this chart is for educational and informational purposes only and should not be considered as investment advice. Trading and investing involve substantial risk and are not suitable for every investor. You should carefully consider your financial situation and consult with a financial advisor before making any investment decisions. The creator of this chart does not guarantee any specific outcome or profit and is not responsible for any losses incurred as a result of using this information. Past performance is not indicative of future results. Use this information at your own risk. This chart has been created for my own improvement in Trading and Investment Analysis. Please do your own analysis before any investments.

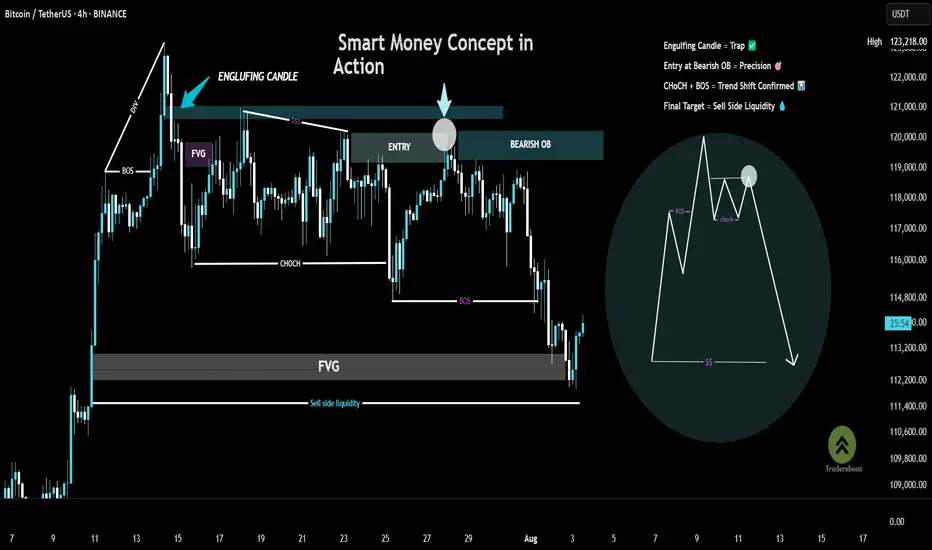
Chart Breakdown – Smart Money Concept in ActionThis chart showcases a textbook example of a bearish setup based on Smart Money Concepts (SMC):
BOS (Break of Structure) at the left confirms a shift in momentum.
A strong engulfing candle pierces into a supply zone, setting the stage for a potential reversal.
Price forms an FVG (Fair Value Gap) and returns to fill the imbalance, offering a high-probability entry within the Bearish Order Block (OB).
A clear CHoCH (Change of Character) signals a bearish trend shift, validated by the second BOS.
The trade targets Sell Side Liquidity, resting below the recent lows—just where smart money aims.
🎯 This setup combines precision, patience, and the power of understanding institutional moves.
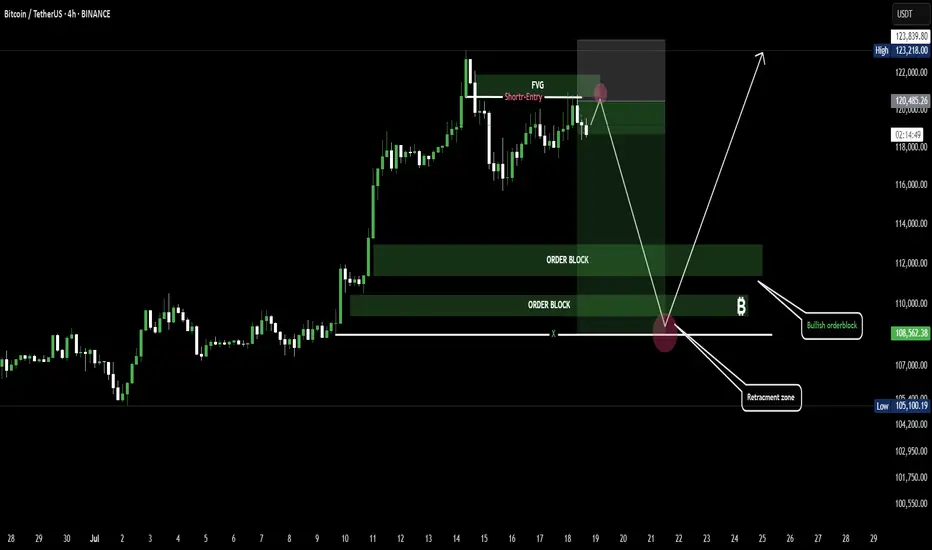
BTC Retracement Loading.....Bullish Bounce Ahead?Bitcoin is showing signs of a short-term pullback after tapping into a Fair Value Gap (FVG) zone, triggering a potential short setup. Price is likely to retrace toward the bullish order block and retracement zone around 105,000–110,000. If that area holds, we could see a strong bounce back toward the 123,000 level.
BTC NEW LOOKBtcusd sell from 115,000
Target1 114,000
Target2 112,000
Target3 110,000
Stope Lose 116,500
TRADE AT YOUR OWN RISK

BITCOINTHE daily structure of the bitcoin shows a break out of the daily ascending trendline ,but on 4hrs we are protected by 4hr ascending trendline line ,the daily sr/rs level holds superior opinion of price action than any intraday time frame .so trade with care and know that any key level on 4r/3r can fail while contesting with daily TF and weekly structure.
#bitcoin #btc
BITCOIN THE daily structure of the bitcoin shows a break out of the daily ascending trendline ,but on 4hrs we are protected by 4hr ascending trendline line ,the daily sr/rs level holds superior opinion of price action than any intraday timie frame .so trade with care and know that any key level on 4r/3r can fail while contesting with daily TF and weekly structure.
#bitcoin #btc

BTC Price Prediction and Elliott Wave AnalysisHello friends,
>> Thank you for joining me in my analysis.
* For the biger imagination of the BTC path, we are still moving into the Orange wave A of the final Green C for ABC from its begining.
* For the smaller imagination of the BTC path, we are still moving into the Blue wave C of the final Green C for the upper Orange wave A.
* For the tighter imagination of the BTC path, I think we are still moving into the correction wave B for the upper Blue wave C.
>> Now we are moving in this Pink wave C for this correction B wave.
Keep liking and supporting me to continue. See you soon!
Thanks, bros

BTC-Stay Sharp. Self RegulateBTC Update
👀All Eyes on These Levels 👇
We’re back in A zone.
The level? 115,727.
This isn’t just any line on the chart — this is the same trendline that flipped from major resistance to support back to resistance on the same date of the infamous #bUCKmOON pump.
📈 If BTC breaks this level with strength and volume — I’m in long.🟢
No volume? No conviction. No entry.
But let’s not get carried away — resistance lurks right above at 117,000 — the former Exhaustion Zone Support now turned resistance.
A classic case of "what once held you up now wants to drag you down."
And if the bulls somehow clear that hurdle?
They'll run headfirst into the Exhaustion Zone Resistance — the real boss fight.
These are stacked walls — one after the other. No easy wins here.
🧠 As a chartist, I’m not here to write about what happens if we break through every ceiling like it’s some fanboy fantasy. That’s not analysis — that’s hopium.
🥂 Yeah yeah but— it’s fun to daydream about all the champagne showers, yacht parties, laser eyes, and the sudden urge to start a DAO that changes the world.
We all picture it.
We all love it.
And sure, when BTC rips through all resistance like butter, we’ll act like we "knew all along."
But anyways — snap back to reality...
There’s another level we can’t ignore:
112,388
👀 Even a 4-hour close below this level?
Just check the chart.
That’s when the bears come storming out of hibernation — angry, hungry, and ready to feast.
🎯Bottom line:
Stay sharp. Self Regulate.
The chart is the map. Discipline is the treasure.

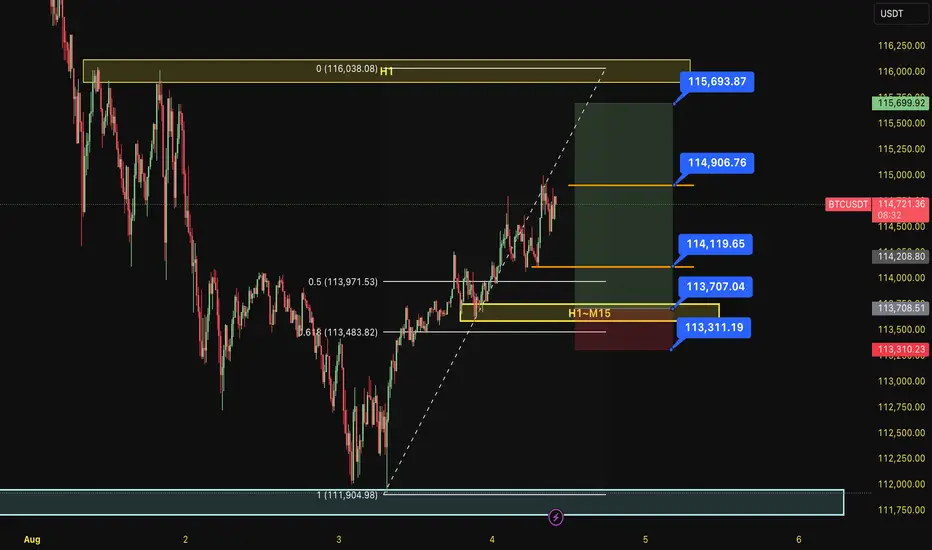
BUY BTC 4.8.2025Confluence order: BUY at H1~M15
Type of order: Limit order
Reason:
- The current top is not touching anything, expected to rise to the H1 above.
- M15~FIBO 0,5-0,618 (same position)
Note:
- Management of money carefully at the last bottom (114,119)
Set up entry:
- Entry buy at 113,707
- SL at 113,311
- TP1: 114,119 (~1R)
- TP2: 114,906 (~3R)
- TP3: 115,963 (~5R)
Trading Method: Price action (No indicator, only trend and candles)
BTC190000 soonthis is way to btc going to 190000 soon or late after that i say btc should have very massive sell
but befor that we nead to btc go to up 190000

TradeCityPro | Bitcoin Daily Analysis #138👋 Welcome to TradeCity Pro!
Let’s get into the Bitcoin analysis. Today is the start of the week, and it’s very important to begin our trading week with the right analysis and outlook.
📅 Daily Timeframe
On the daily timeframe, as you can see, not much has changed compared to the previous analysis, and the price is still ranging near the supply zone.
✔️ The fact that no price correction has occurred so far shows the strength of the buyers, and even if a correction does happen, as long as the price stays above 110183, the trend will still be considered bullish.
🧩 The main trigger for trend continuation is either the price reaction to the curved trendline or the break of 122733. We can find more optimal triggers in the lower timeframes.
⏳ 4-Hour Timeframe
In this 4-hour timeframe, after a fakeout below 116829, the price corrected down to the 0.5 Fibonacci level and now has returned again to the box between 116829 and 120041.
🔍 The fakeout trigger is 120041, and I’ll try to have at least two positions open in the market when this level breaks — whether on Bitcoin or altcoins.
📈 The main trigger for the next bullish leg is 122733.
If RSI also breaks the 61.67 resistance alongside 120041, the likelihood of the move continuing will increase.
❌ Disclaimer ❌
Trading futures is highly risky and dangerous. If you're not an expert, these triggers may not be suitable for you. You should first learn risk and capital management. You can also use the educational content from this channel.
Finally, these triggers reflect my personal opinions on price action, and the market may move completely against this analysis. So, do your own research before opening any position.
