Bitcoin at Key Support - Watching for Bullish ShiftHello everybody!
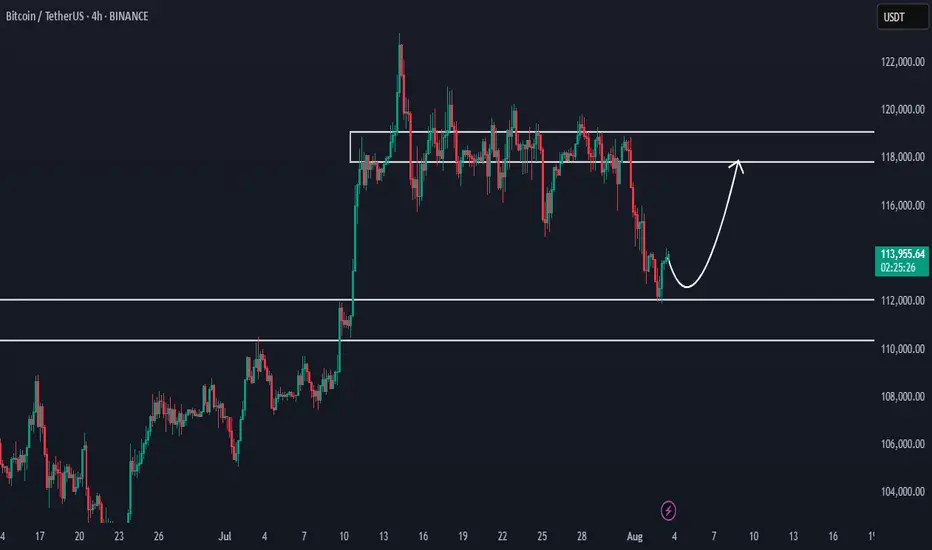
Bitcoin has reached a very important demand/support zone between 110,000–112,000.
If this area holds, we could see bullish momentum building on the chart.
Currently, we are waiting for confirmations.
We're watching closely for any change in market structure or a trend shift.
If it happens, we can expect the price to move up to around 118,000.
Manage your risk and trade safe!
BTCUSDT trade ideas
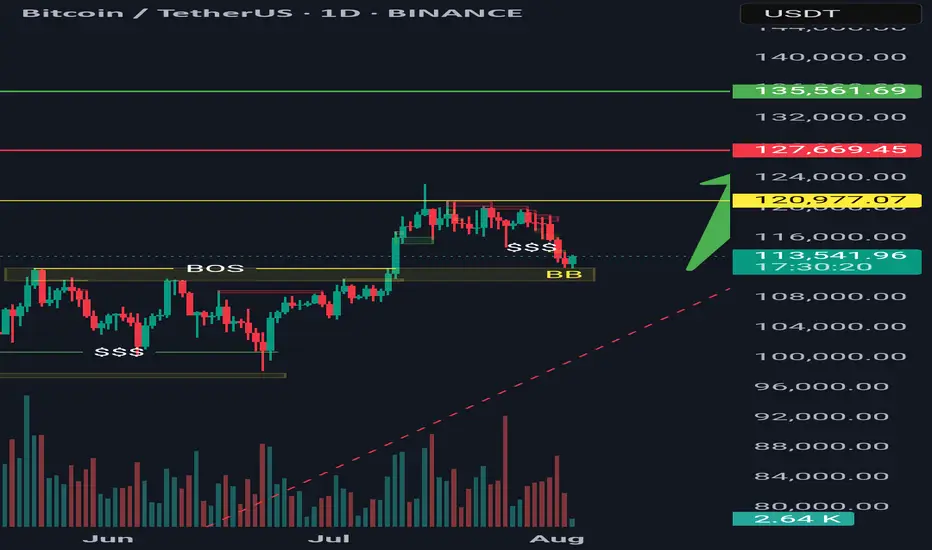
Bitcoin possible bullish momentPrice has pulled back into the Bullish Order Block.
A bounce from the 113K–111K zone is expected.
Targeting next levels of imbalance and liquidity:
TP1: 120,977 USDT
TP2: 127,669 USDT
TP3: 135,561 USDT
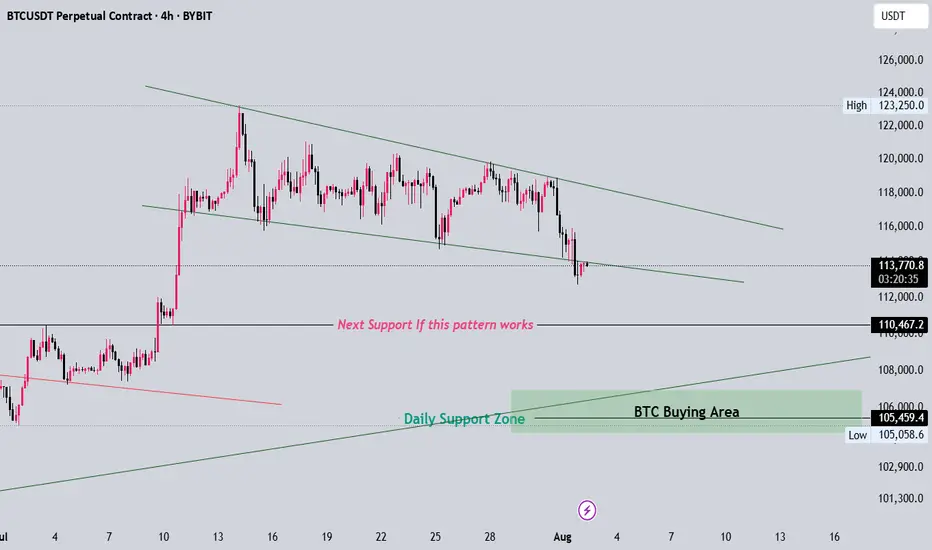
BTC Clear Idea if this pattern worksFor now please observe some time if btc breaks down to next target which is arround 110k then btc will definetly move towards 105k becuase that is its daily trendline support
$BTC Daily OutlookDaily Chart
Today’s close printed a small bearish doji; visually bearish but still another inside-day that keeps BTC boxed between the High-Volume Node / v-Level cluster at $116 860-$123 300.
Holding $116 860 remains critical; lose it on a daily close and price can easily slide to the weekly breakout shelf near $111 960. We are now 16 days inside this balance. Per Auction-Market-Theory rule #5, the longer price churns at the edge, the more resting liquidity is absorbed, eventually a decisive push will follow. If buyers defend $116 860 again, the path opens toward range high $123 300 and the prior ATH; if they fail, expect a fast flush to the weekly V-Level.
Footprint Read
Value Area High and Low span the full candle, with the POC parked mid-range, classic two-sided trade. Delta finished negative and the heaviest prints sit at session lows: sellers hit the bid hard, yet could not follow through. That absorption leaves shorts vulnerable to a squeeze if new selling momentum doesn’t appear quickly.
Fundamental Pulse – Week Ahead
ETF Flows: Spot-Bitcoin ETFs booked three consecutive inflow days to close last week (+$180 M net). Sustained demand under the range supports the bullish case.
Macro Data: U.S. FOMC & Federal Fund Rates prints for this week; expect more volatility starting from tomorrow.
Game Plan
Primary bias stays long while daily candles close above $116 860; upside trigger is a clean for now or shorts squeeze toward $123 300.
If $116 860 breaks with volume, prepare for a quick liquidity hunt into the weekly shelf at $111 960, where we reassess for swing longs.
Intraday: I’ll monitor the Intraday Chart on tomorrow's High impact events and look for best opportunities across the board. Alt window: a fresh downtick in BTC Dominance could spark rotation; watch high-Open Interest majors if BTC ranges.

BTCUSD sell "I had posted it before as well, but it got hiddenAnalyzing market structure and liquidity using Price Action and Smart Money Concepts. Focused on key supply/demand zones and institutional order flow

BTCUSDT – Ascending Triangle Completing the Path!📊 Bitcoin is currently forming an ascending triangle, clearly marked in bold red.
This zone is showing high volatility and provides great Buy/Sell opportunities for traders. 🔄
📈 If the price breaks out above the resistance line, we can expect a strong bullish move, following the path highlighted in blue polyline, with potential to reach the long-term target of 🔹 1.4 million USDT. 🚀
📌 If you listen closely, this chart’s basically yelling: “Something’s coming...” 🎧👀
🧭 Next move will define the trend — don’t blink.

BTC-----Sell around 114500, target 113500-113000 areaAugust 5th BTC Contract Technical Analysis:
Today, the daily chart closed with a small bullish candlestick pattern, with prices remaining high. However, the accompanying indicator forms a death cross. While the broader trend remains bearish, the market is still trending downwards. However, yesterday's significant upward trend suggests a range-bound trend in the short term. Without a continuation of the trend, a significant unilateral move is unlikely. On the hourly chart, yesterday's intraday gains continued in the European and American sessions, but prices failed to break above the previous high. The current candlestick pattern shows consecutive bearish candlesticks, with prices trading below the moving average and the accompanying indicator forming a death cross. Therefore, continued support is crucial for the day, with the strength and potential breakouts of the European session also key.
Today's BTC Short-Term Contract Trading Strategy:
Sell on pullbacks to the 114,500 area, with a stop-loss at 115,000, and a target of 113,500-113,000.

BTC/USDTPossible AMD setup forming. Entry only after clear confirmation.
If validated, the target is a move toward new ATHs.
However, if downside pressure continues, we could see a correction below the $110K level.
Stay reactive — not predictive.

BTC rally starts / 241.000$Bitcoin is entering the last bullish rally before bear market. I want to see new phase of euphoria on crypto and altcoins also and overbought on RSI indicator


BITCOIN - Price can turn around and start to move upHi guys, this is my overview for BTCUSD, feel free to check it and write your feedback in comments👊
The price reversed its prior downtrend with a decisive breakout from a falling channel.
This breakout triggered a strong upward impulse, which then began to consolidate into a large symmetrical pennant.
However, the price recently failed to hold the lower support trendline of this pennant and broke to the downside.
The asset is currently trading just below this broken trendline, in what appears to be a liquidity grab.
To continue upwards, buyers must now overcome the immediate resistance located at the $116300 level.
I expect that this breakdown was a fakeout, and the price will soon reverse, break through the $116300 resistance, and continue its rally toward the $121000 target.

Bitcoin is Coming to it's Support #BitcoinHello Trader's
Here's some info about selling pattern formed in Bitcoin
Check out this level..
How many off you traded this selling

$BTC needs a massive diaper change....BTC is crossing key technical points, pointing clearly in an bearish trend. The trend will likely accelerate and potentially aggressively. I have been through several turns, not financial advise and always do your due diligence, but for those who are up: sell and and don't get emotional about BTC, unless there is a clean / clear support levels. Crypto bros will be eating rice and beans very soon and still be trying to FOMO crypto. This could be way worse than FTX!
Stay safe and for signal support levels use UltraAlgo to avoid wasting time trying to find support / resistance levels.....best of luck!

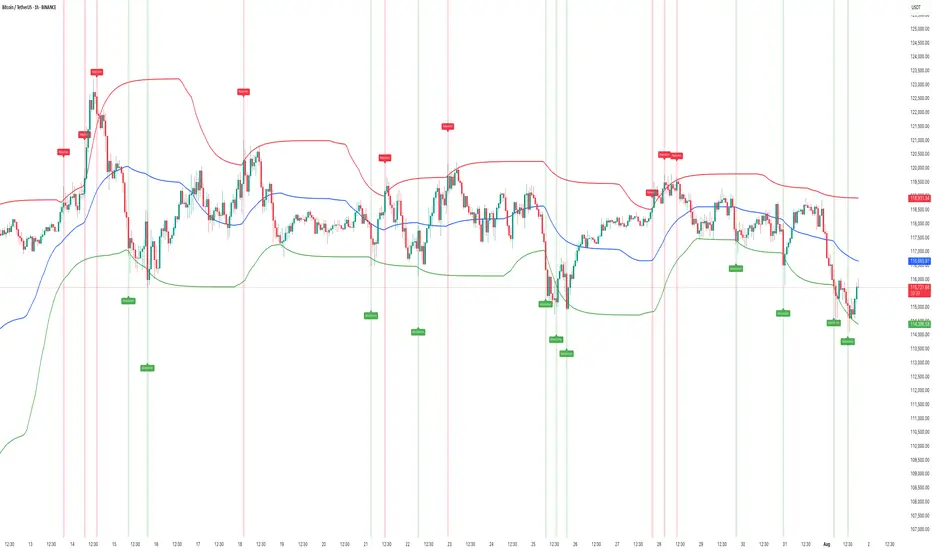
HOW TO Spot Liquidity-Driven Reversals & Market TrapsAdaptive Liquidity Pulse
🎯 Spot Liquidity-Driven Reversals & Market Traps
The Adaptive Liquidity Pulse is designed to help traders detect high-volume rejections and absorptions, revealing where big players are likely defending or accumulating positions. This indicator is especially useful for spotting market traps, liquidity sweeps, and swing reversals.
⸻
🧠 How It Works
1. Dynamic Liquidity Zones
• Red Band (High EMA) → Potential supply/rejection zone
• Blue Band (Mid EMA) → Equilibrium / magnet zone
• Green Band (Low EMA) → Potential demand/absorption zone
2. Signal Labels
• 🔴 Rejection → Price spikes into high liquidity with volume → Bearish bias
• 🟢 Absorption → Price flushes into low liquidity with volume → Bullish bias
3. Volume-Weighted Detection
• Only triggers signals when volume exceeds a configurable threshold
• Filters out weak moves, highlighting true liquidity events
⸻
📊 Best Use Cases
• Scalping & Intraday Trading: Identify early reversal points
• Swing Trading: Track absorption/rejection cycles to time entries/exits
• Liquidity Sweep Detection: Spot where false breakouts occur with volume confirmation
⸻
⚡ Trading Tips
• Use Rejection (Red) for short entries or take-profits near highs
• Use Absorption (Green) for long entries or short exits near lows
• Combine with support/resistance zones or trend structure for higher accuracy
• Midline (Blue) often acts as a mean-reversion magnet in ranging markets
⸻
📢 Alerts
• 🔴 Rejection Alert → Strong selling pressure at liquidity zone
• 🟢 Absorption Alert → Heavy buying at demand zone
⸻
🧠 Why Traders Love It
• ✅ Visualizes hidden liquidity interactions
• ✅ Highlights trap zones before reversals occur
• ✅ Works across crypto, indices, forex, and commodities
• ✅ Designed for confluence with other strategies
⸻
This script gives you a real-time pulse of liquidity shifts, allowing you to trade like institutions and avoid falling into retail traps.
⸻
BTC/USDT Analysis – Bullish Pennant Holds Key to $150,000 TargetBINANCE:BTCUSDT is holding just above $115,000, recovering from a 2.4% dip in the last 24 hours, with one technical setup dominating the conversation: a bullish pennant on the 3-day chart.
The pattern formed after a sharp 25% rally earlier this month, creating a classic pole-and-pennant structure. Multiple breakout attempts have failed so far, with long wicks signaling heavy volatility, but the pattern remains valid as long as the BINANCE:BTCUSDT price stays above the $114,000 support zone.
A confirmed 3-day candle close above $119,700—the top of recent failed breakouts—would likely trigger the next leg higher. A measured move from the pole projects an upside target near $150,000, aligning with long-term bullish expectations.
Supporting this setup, the Fund Flow Ratio has been making lower highs, suggesting fewer coins are heading to exchanges and potential sell pressure is easing. At the same time, Chaikin Money Flow (CMF) on the 3-day chart is forming higher highs, signaling quiet accumulation despite recent price dips.
Until either level breaks, BINANCE:BTCUSDT trades in a pivotal range. Bulls want a clean breakout above $119,700, while a drop below $114,000 would invalidate the pattern and open the door to further downside.

Two simple scenarios could playing out The buying pressure has been slightly less over the last week, I see a small improvement today but later this weekend, it is still likely to head downward towards the 110k area.

The Curtain Falls on the Script: Why I Believe It's Time to StopHello everyone, this is EC.
From late June through July, we experienced a full-fledged primary uptrend in crypto, driven by a weakening U.S. Dollar. From the script preview to the execution of the plan, every step has been clearly documented.
However, today, I want to share a different, more cautious perspective: I believe this script may be nearing its end.
I. Reviewing the Script and the "Bubble's" Manifestation
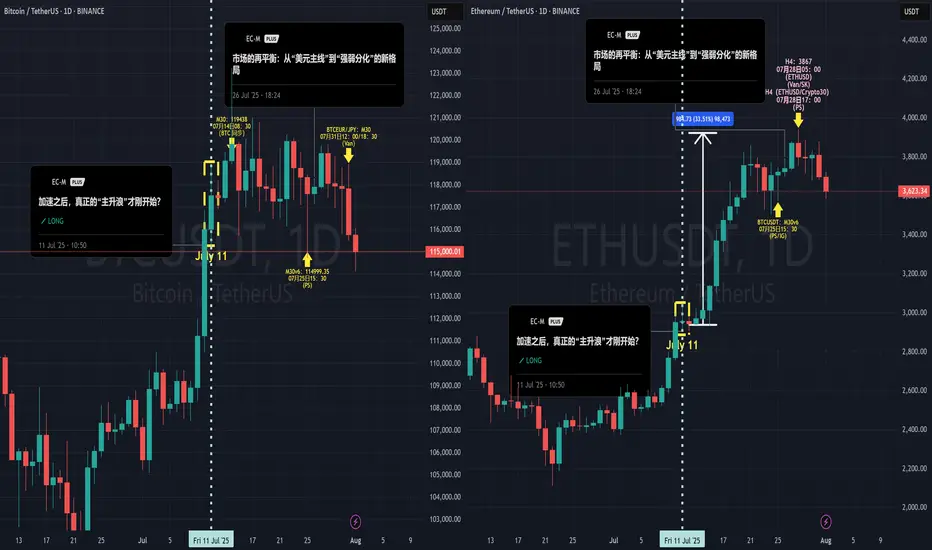
After our call on July 4th that the "main bull wave" was starting, the market perfectly delivered on our expectations. What was more interesting was the clear internal divergence we saw, which precisely confirms our thesis about the "bubble phase" from my June 20th article, "The Restlessness Before the Storm."
When the market's sentiment "balloon" is inflated to its limit, capital flows from the leader (BTC) to assets with higher elasticity (ETH).
The data shows that from July 11th until now, ETH took the baton and rallied approximately 35%, while BTC gained only around 6% in the same period. When BTC is already showing signs of fatigue while ETH is still in a solo rally, that in itself is a major signal that the bubble is nearing its end.
II. A Shift in the Winds: The Hand Inflating the Balloon is Loosening
I've chosen to end this script at this moment based on signal changes on two levels:
The "External Factor" Shift: The Potential Strengthening of the USD
As I pointed out in my July 28th analysis, "The Market's Rebalancing," the market has entered a phase of "strength-weakness divergence." This trend is now becoming more evident: the U.S. Dollar, cushioned by the extreme weakness of currencies like the Japanese Yen, has begun to show signs of a broad strengthening. Concurrently, U.S. and European stock markets are pulling back in sync, and global risk appetite is cooling.
The external environment that fueled the bubble (a weak USD) is beginning to falter.
The "Internal Factor" Signal: The Needle Point Inside the Balloon
The crypto market itself is also showing warning signs of resistance (see attached ETH daily chart). When the leading asset, ETH, begins to show signs of stagnation and distribution at its highs, it's like the balloon meeting the needle point. The exhaustion of internal momentum is a more direct warning than changes in the external environment.
III. Conclusion: Don't Be Greedy for the Last Dessert
When the core logic driving the rally (a weak USD) begins to waver, and the market simultaneously shows internal signs of exhaustion, my choice is to end this script and take profits off the table.
This doesn't mean I think crypto will crash immediately. But "no longer suitable to hold" implies that, in my view, the risk/reward ratio at the current level is no longer attractive. A grand feast is coming to an end, and being greedy for the last dessert is not a wise move. Shifting from "buying the dip" to "cautious observation" is the rational choice.
Thank you for your attention and for following along this past month.
#Crypto #BTC #ETH #TradingView #MarketAnalysis #RiskManagement

BTC/USDT Analysis — Hidden Buyer
Hello everyone! This is the daily analysis from the CryptoRobotics trading analyst.
Yesterday, Bitcoin continued its move toward the local low and formed a false breakout.
Throughout the decline, we observed a positive delta, which may indicate gradual accumulation of long positions. At the same time, the descending trendline has not yet been broken, and there was strong absorption of market buys around ~$118,400 and ~$118,800 — which makes entering long positions very risky at the moment.
Our main expectations are based on further rotation within the range marked in yesterday’s analysis. In the short term, we are watching for a test of two local zones to assess the reaction from sellers. If the reaction is weak, a test of the upper boundary of the new sideways range is quite possible.
Buy zones:
$116,200–$115,000 (volume anomalies)
$110,000–$107,000 (accumulated volume)
Sell zones:
~$118,400 and ~$118,800 (local resistances)
This publication is not financial advice.

BTC/USDT Analysis — Potential Sideways Range
Hello everyone! This is the daily analysis from the CryptoRobotics trading analyst.
Yesterday, Bitcoin experienced a local reversal. At this point, two zones previously marked by us have been worked out:
Buy zone — $118,300–$117,300
Sell zone — $119,500–$119,000
We now expect continued rotation within the $117,400–$119,800 range, with potential expansion in both directions. The overall context remains positive, so a full breakout to the upside could occur in the near future.
Buy zones:
$116,200–$115,000 (volume anomalies)
$110,000–$107,000 (accumulated volume)
This publication is not financial advice.

Daily BTC, ETH & Market Index Analysis💎🔥 Daily BTC, ETH & Market Index Analysis & What Comes Next? 🔥💎
Smash the 🚀, FOLLOW for daily updates, and drop your thoughts in the comments!📈💬
♦️ Hello everyone!
Here’s what you can expect from this page:
🟡 Every Day: BTC & ETH analysis + complete market index overview
🟡 Every Sunday: Top 10 Altcoin breakdown (excluding BTC & ETH)
🟡 🆕 Coming soon: Weekly Watchlist every Sunday!
💛Your likes and follows are what keep this crypto routine going 💛
⭕️ 24-Hour Market Crash – Summary for Crypto Traders
Let’s break down what happened 👇
1️⃣ A massive wave of liquidations in futures and derivatives triggered heavy selling pressure.
2️⃣ BTC Dominance dropped, but capital also exited altcoins and flowed into BTC – a clear fear response and move toward safer assets.
3️⃣ Institutional players reduced exposure to altcoins to limit risk, causing deeper price drops.
4️⃣ On Ethereum, over $2.3B ETH is queued for unstaking, raising the chance of near-term sell pressure.
5️⃣ Ongoing pressure from investor sentiment shifts and global uncertainty is pushing money out of high-risk assets like crypto.
6️⃣ ⚠️ But this is a technical correction, not a fundamental collapse. For long-term thinkers, this could be a buy-the-dip opportunity.
🔥❗️Heavy Crypto Sentiment Week Ahead
As mentioned yesterday, we’re at a critical point across key crypto indexes:
♦️ BTC, ETH, major altcoins, and indexes like BTC.D, USDT.D, TOTAL, TOTAL2, TOTAL3.
🚨 Tomorrow brings a major crypto-impacting event — the Fed interest rate decision.
Most forecasts suggest no change. However, with rising stock indexes, there’s no clear pressure to cut inflation.
Any unexpected comments or decisions by Powell may drive new waves in the crypto space.
♦️ BTC
🗓 Monthly candle closes in 2 days — be cautious around this point.
🔑 $120,300 is still the main breakout level.
If it breaks with BTC Dominance rising, altcoins may stall (unless paired bullishly with BTC).
If it breaks while BTC.D drops, expect strong altcoin momentum.
⚔️ Two scenarios for entries:
1️⃣ Entry at $119,500 – higher risk of getting stopped out but tighter SL.
2️⃣ Entry above $120,300 – more reliable but wider stop due to breakout wick.
🟡 Key Support: $115K–$117.3K – still valid, but repeated testing weakens the zone.
❗️❓️Why does it get weaker?
Because each test drains buy orders. Sellers eventually overwhelm this level as buyers lose firepower.
♦️ BTC Dominance (BTC.D)
Trend isn't clearly bullish yet, but the recent drop has slowed down.
Structure is shifting – two key levels to watch:
1️⃣ 60.83 – rejected yesterday.
2️⃣ 60.42 – if this breaks down, alts may push higher.
♦️ TOTAL (Crypto Market Cap)
Stuck at the $3.91T resistance.
💥 Breakout = strong volume and momentum injection. Be positioned accordingly.
♦️ TOTAL2 (Altcoins excl. BTC)
At the $1.53T key level – breakout or rejection will shape altcoin direction.
♦️ TOTAL3 (Altcoins excl. BTC & ETH)
Still eyeing the $1.08T resistance zone.
♦️ USDT Dominance (USDT.D)
If 4.44% breaks and holds – bullish structure in BTC & alts will be in danger.
Until then, focus on long setups.
📌 Make sure you’re positioned before 4.13% breaks — alts typically begin moving before that confirmation.
♦️ ETH/USDT
If ETH closes below $3,480, expect extended correction or range.
♦️ Trading Outlook
1️⃣ Today may be quiet – market awaits reaction to tomorrow’s index events (Fed, BOJ, Powell).
2️⃣ These updates can create new moves or shift bias toward short setups.
💎 If this helped your crypto planning, hit the 🚀, FOLLOW for more daily setups, and share your thoughts in the comments! 🔥📊

Bitcoin fixed above the $112k ┆ HolderStatOKX:BTCUSDT is recovering after touching the $111,940 zone, now confirmed as strong support. The price is reversing from the lower wedge boundary, suggesting renewed momentum. A clean push could retarget $122,250 in coming sessions.

$BTC bouncing over crucial support!CRYPTOCAP:BTC is currently pulling back from the $123K resistance area, heading toward a major confluence support zone between $107K–$110K, which aligns with:
✅ Previous breakout zone
✅ 0.5–0.618 Fibonacci retracement
✅ Lower bound of the ascending channel
✅ 200 EMA support
This level is expected to attract buyers and act as a strong base for the next bullish leg.
Price dips into the $107K–$110K support
Look for a bullish reversal (reaction candles or bullish divergence)
Target 1: $128K – retest of resistance
Target 2: $132K – upper boundary of the ascending channel
CRYPTOCAP:BTC remains within a healthy bullish structure.
This pullback is constructive, not bearish.
The $108K–$110K zone is a high-probability long setup — wait for bullish confirmation before entering.
A daily close below $106.8K would invalidate the structure and open up downside risk.
