The trend is your friend...BTC is moving within a clear range on the daily timeframe. Since we are in an underlying uptrend, the current range is bullish. A downside fakeout would be typical and could potentially fill the CME gap, but we would remain bullish.
BTCUSDT trade ideas

Daily BTC, ETH & Market Index Analysis💎🔥 Daily BTC, ETH & Market Index Analysis & What Comes Next? 🔥💎
Smash the 🚀, FOLLOW for daily updates, and drop your thoughts in the comments!📈💬
♦️ Hello everyone!
Here’s what you can expect from this page:
🟡 Every Day: BTC & ETH analysis + complete market index overview
🟡 Every Sunday: Top 10 Altcoin breakdown (excluding BTC & ETH)
🟡 🆕 Coming soon: Weekly Watchlist every Sunday!
💛Your likes and follows are what keep this crypto routine going 💛
⭕️ 24-Hour Market Crash – Summary for Crypto Traders
Let’s break down what happened 👇
1️⃣ A massive wave of liquidations in futures and derivatives triggered heavy selling pressure.
2️⃣ BTC Dominance dropped, but capital also exited altcoins and flowed into BTC – a clear fear response and move toward safer assets.
3️⃣ Institutional players reduced exposure to altcoins to limit risk, causing deeper price drops.
4️⃣ On Ethereum, over $2.3B ETH is queued for unstaking, raising the chance of near-term sell pressure.
5️⃣ Ongoing pressure from investor sentiment shifts and global uncertainty is pushing money out of high-risk assets like crypto.
6️⃣ ⚠️ But this is a technical correction, not a fundamental collapse. For long-term thinkers, this could be a buy-the-dip opportunity.
🔥❗️Heavy Crypto Sentiment Week Ahead
As mentioned yesterday, we’re at a critical point across key crypto indexes:
♦️ BTC, ETH, major altcoins, and indexes like BTC.D, USDT.D, TOTAL, TOTAL2, TOTAL3.
🚨 Tomorrow brings a major crypto-impacting event — the Fed interest rate decision.
Most forecasts suggest no change. However, with rising stock indexes, there’s no clear pressure to cut inflation.
Any unexpected comments or decisions by Powell may drive new waves in the crypto space.
♦️ BTC
🗓 Monthly candle closes in 2 days — be cautious around this point.
🔑 $120,300 is still the main breakout level.
If it breaks with BTC Dominance rising, altcoins may stall (unless paired bullishly with BTC).
If it breaks while BTC.D drops, expect strong altcoin momentum.
⚔️ Two scenarios for entries:
1️⃣ Entry at $119,500 – higher risk of getting stopped out but tighter SL.
2️⃣ Entry above $120,300 – more reliable but wider stop due to breakout wick.
🟡 Key Support: $115K–$117.3K – still valid, but repeated testing weakens the zone.
❗️❓️Why does it get weaker?
Because each test drains buy orders. Sellers eventually overwhelm this level as buyers lose firepower.
♦️ BTC Dominance (BTC.D)
Trend isn't clearly bullish yet, but the recent drop has slowed down.
Structure is shifting – two key levels to watch:
1️⃣ 60.83 – rejected yesterday.
2️⃣ 60.42 – if this breaks down, alts may push higher.
♦️ TOTAL (Crypto Market Cap)
Stuck at the $3.91T resistance.
💥 Breakout = strong volume and momentum injection. Be positioned accordingly.
♦️ TOTAL2 (Altcoins excl. BTC)
At the $1.53T key level – breakout or rejection will shape altcoin direction.
♦️ TOTAL3 (Altcoins excl. BTC & ETH)
Still eyeing the $1.08T resistance zone.
♦️ USDT Dominance (USDT.D)
If 4.44% breaks and holds – bullish structure in BTC & alts will be in danger.
Until then, focus on long setups.
📌 Make sure you’re positioned before 4.13% breaks — alts typically begin moving before that confirmation.
♦️ ETH/USDT
If ETH closes below $3,480, expect extended correction or range.
♦️ Trading Outlook
1️⃣ Today may be quiet – market awaits reaction to tomorrow’s index events (Fed, BOJ, Powell).
2️⃣ These updates can create new moves or shift bias toward short setups.
💎 If this helped your crypto planning, hit the 🚀, FOLLOW for more daily setups, and share your thoughts in the comments! 🔥📊

BTCUSD sell "I had posted it before as well, but it got hiddenAnalyzing market structure and liquidity using Price Action and Smart Money Concepts. Focused on key supply/demand zones and institutional order flow

BTC poised to rise further! Market volume remains the problemBTC poised to rise further! Market volume remains the problem
From our chart we can see that BTC likes to make big corrections before moving higher. Over the weekend, BTC transformed from a bearish picture to a clear bullish triangle with a bullish breakout.
The prevailing trend should push BTC higher as shown in the chart, but again the problem is with the volume.
Suppose BTC has not accumulated enough volume during the development of the pattern. In that case, it is very likely that it will fall even further to develop an even larger pattern like the previous one that we can see at the end of the wave.
However, at the moment, BTC has a bullish pattern and the scenario could develop in the way shown in the chart. We cannot assume further transformations at the moment.
You may find more details in the chart!
Thank you and Good Luck!
PS: Please support with a like or comment if you find this analysis useful for your trading day

Bitcoin ready to fall?!??I think this is the best analysis that can be made of Bitcoin. I don't see any strength in its trend and I feel that it is going to correct to the specified areas, but our trend is completely bullish.

BTCUSDT 4H buy #bitcoinHello friends. You see the Bitcoin chart. The price has done BOS on the 4-hour time frame. The FVG area is marked and is suitable for buying trades. Of course, this is just a theory.

Btc is fallingHello, considering the breakdown of the upward trend line and the pullback to the downward trend line that I drew, the price will most likely fall to the specified support level and we will enter a resistance phase.

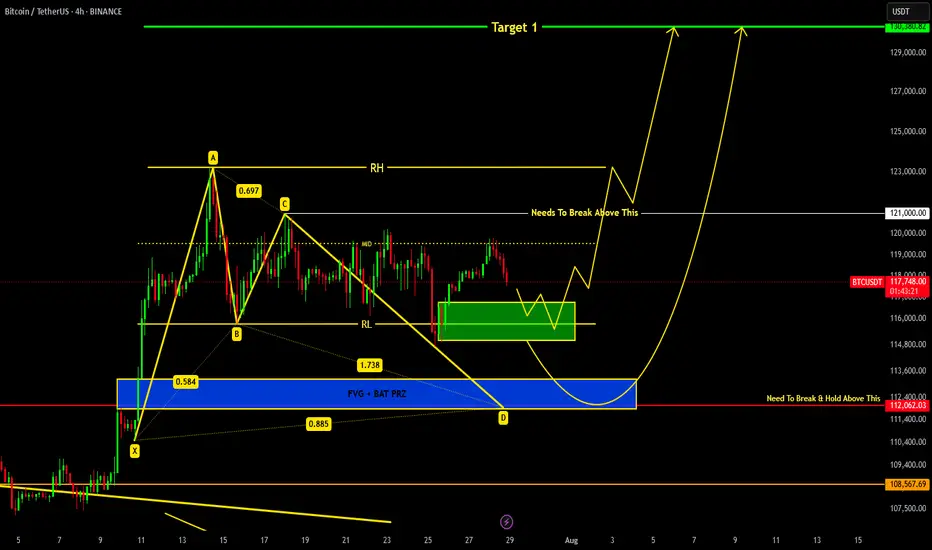
BITCOIN Current Update !!!we are heading towards support region around 116.8k-115k from where we can expect a reversal.
If price breaks down 115k level then a bat harmonic pattern is also forming which indicates it's PRZ at 113-112k region...
Remember 121k is key level which needs to be broken in order to remain bullish !!!
BTCUSDT 4H Chart UpdateBitcoin has successfully broken out of the descending wedge, retested the support zone near $117K, and is now showing signs of a bullish continuation.
If momentum holds, price could aim for the $122K–$124K range next.
Structure remains bullish as long as it stays above the retest zone.

BTCUSDT Range-Bound Market: Short-Term Bearish MoveBTCUSDT
has failed to break through the descending resistance near 120,000 and is now forming a lower high within the broader resistance zone. The price action follows an impulsive leg up and is currently tracing a potential reversal pattern under key structural resistance. As long as the market remains capped below 120,000, continuation toward 117,500 is likely. The downward bias is supported by weakening momentum after the bull trap and resistance rejection.
📉 Key Levels
Sell trigger: Breakdown below 119,000
Sell zone: 119,400 – 120,000
Target: 117,500
Invalidation: Break and close above 120,500

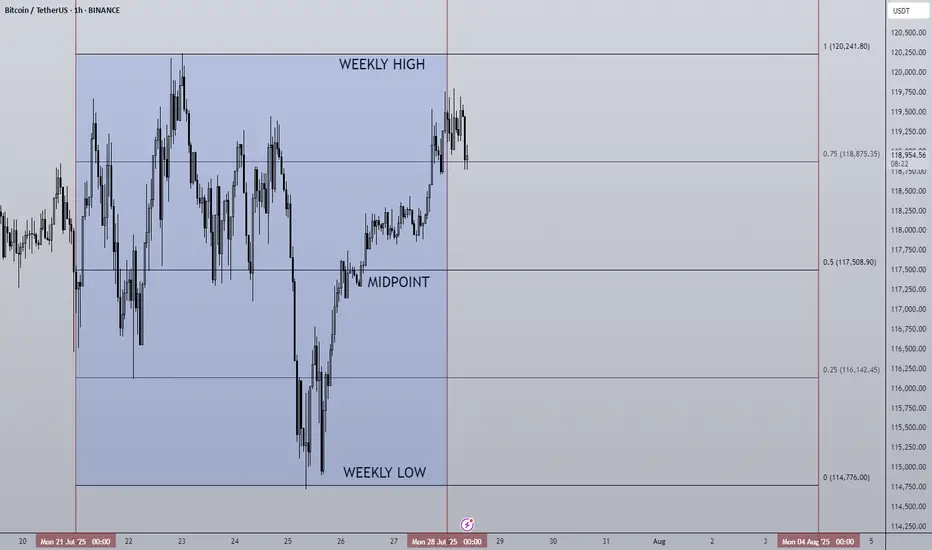
28/07/25 Weekly OutlookLast weeks high: $120,241.80
Last weeks low: $114,776.00
Midpoint: $117,508.90
As we approach the end of the month BTC continues to trade sideways during a cooling off period as altcoins finally take the stage. Last week Bitcoin saw a relatively flat net inflow via ETFs of $72m, ETH on the other hand posted the second largest net inflow week ever at $1.85B! The concentration has certainly shifted...
This IMO is still a very bullish structure for BTC, very shallow pullbacks being bought up/absorbed by still happy to purchase at these levels. As long as this continues altcoins have a strong base to continue growing on, if BTC breaks structure and price accepts below ~$110,000 then the altcoin rally will be over for now I believe.
This week some major altcoins are set to reach HTF resistance areas, ETH has already tagged $4,000 which looks to be a battleground level of major importance.
TOTAL2 which is the combined market cap of all altcoins is currently ~8% from the highs, keeping this in mind for where altcoins may run out of steam...
Good luck this week everybody!
Daily Market Analysis – BTC, ETH, and Key Indexes
💎🔥 Daily Market Analysis – BTC, ETH, and Key Indexes 🔥💎
🚀 Don’t forget to FOLLOW & smash the ROCKET 🚀 button if this helped you!
💬 Drop your thoughts in the comments
♦️ Hello everyone!
On this page, we follow a daily and weekly crypto routine:
🟡 Daily:
• Structural and technical analysis of BTC, ETH, and overall market indexes.
🟡 Every Sunday:
• Analysis of the Top 10 Altcoins (excluding BTC & ETH)
• 🆕 Weekly Watchlist to be introduced soon!
💛Your likes and follows are my fuel to keep posting daily insights 💛
⭕️ We’re currently in a super critical zone across all markets:
• BTC, ETH, major Altcoins
• Key indexes like BTC Dominance (BTC.D), USDT Dominance (USDT.D), TOTAL, TOTAL2, and TOTAL3
All are at major turning points.
❗️Also, this week brings critical macro news:
• U.S. Interest Rate decision – expected to remain unchanged,
but political pressure may push Powell to surprise the markets.
• Reports on U.S. GDP, Japanese Yen interest rate, and Canadian Dollar are also coming.
⚠️ This is a HIGH-IMPACT WEEK – stay alert. We might even be at the edge of a bull run.
♦️ BTC
As mentioned yesterday, to confirm long positions on altcoins and restart their rally,
we need a breakout above 120,300 on BTC and a drop in BTC.D.
✅ Break of 120,300 would inject strong bullish sentiment and possibly trigger high momentum.
🚫 Until then, my focus is strictly on bullish setups only.
📌 If BTC ranges before the U.S. session opens, the entry triggers shared in yesterday's watchlist will be ideal to activate.
♦️ BTC Dominance (BTC.D)
While BTC price rises, BTC.D is dropping – a great signal for altcoin entries.
BTC.D is testing two key levels:
1️⃣ 60.83
2️⃣ 60.42
📉 A full breakdown of 60.83 would be the first signal of an altcoin reversal.
❗️If 60.42 breaks too – do NOT stay out of altcoins!
♦️ TOTAL (Market Cap)
Currently struggling with the 3.91T level.
A clean break here could bring in serious volume and momentum.
💡 Missed some entries from the watchlist? Look for major breakout levels on other coins.
♦️ TOTAL2 (Altcoin Cap excl. BTC)
Also testing its key level of 1.48T. Breakout = confirmation of altcoin strength.
♦️ TOTAL3 (Altcoin Cap excl. BTC & ETH)
Yesterday, gave us its first bullish signal breaking above 1.03T.
Because ETH has moved already, TOTAL2 reacted faster.
⏳ That means: we still have time for altcoin setups (excluding BTC & ETH).
♦️ USDT Dominance (USDT.D)
Broke 4.23% – which was the first early sign of a bullish shift.
Before it breaks 4.13%, we should already be in long positions on BTC and alts.
⚠️ Once 4.13% breaks, sharp altcoin rallies may happen quickly – entry opportunities may disappear.
♦️ ETH/USDT
Although ETH has bullish candles, volume and trend strength are weak.
My preferred entry was around $3,750 – that would give us room toward the $4,000 resistance.
Right now, no valid entry trigger in ETH.
If it reacts to $4,000 and forms a lower low, then we might scout for bullish setups.
⛔️ $4,000 is likely to cause some chop – which is why $3,750 was a better buy zone.
♦️ Outlook & Strategy ♦️
1️⃣ Consider the chance that all coins may bounce exactly from current levels – that's what I’m personally positioning for, accepting the risk.
2️⃣ If BTC and ETH break 120K and 4K then consolidate, and BTC.D continues to drop —
➡️ Get ready for an Altcoin Party.
3️⃣ Monitor the daily watchlist triggers closely.
4️⃣ If BTC fails to break 120.3K, we won’t get the explosive rally.
5️⃣ If BTC ranges while BTC.D continues dropping, alts will still perform —
⚠️ But not as strong as a full bull run.
🚀 Hit the ROCKET if this helped you stay ahead of the market!
🟡 Follow me for daily BTC, ETH & index updates.
💬 Let me know your market view in the comments!

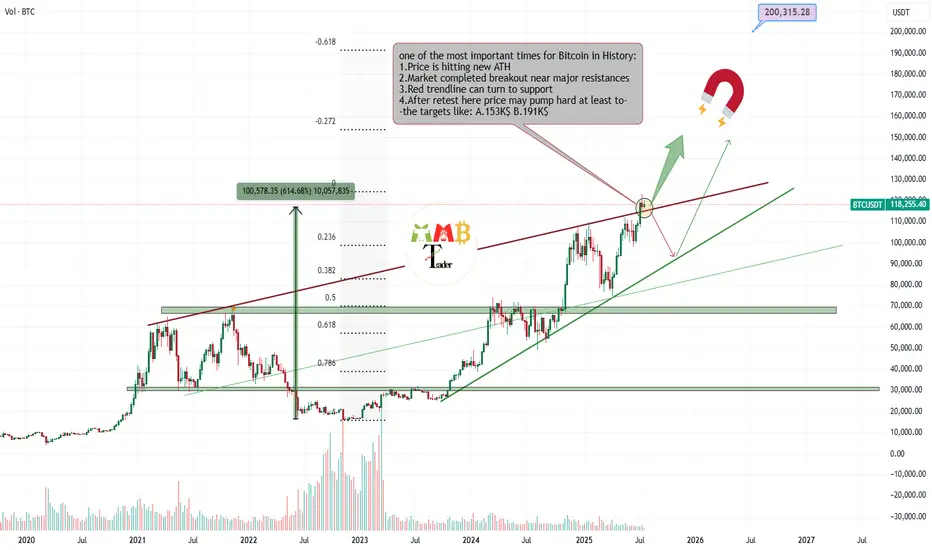
Bitcoin is retesting Critical zone for targeting almost 200K$Most traders around world now don't know what to do with their own trades or spot holdings, because some are in profit and how doubt of more pump and are still holding and some others miss this massive pump and think it can rest and fall now and it is not a good time to enter long.
And many other questions and thoughts At this time is simply check the chart and do these simple steps which are some mentioned and some not due to huge content.
Delete all of my previous drawings and start new Charting the price and see new trendlines or supports and resistances formed.
Then technically check the volume and breakouts and ... once again and here for Bitcoin i still find out chart looks extremely bullish to me and at this orange zone which is price is getting a little slow some important things may happen.
30% is expecting price fall below red trendline again and see short-term fall.
70% is expecting price complete retest of breakout here or pump more ASAP and then hitting targes like 150K$ and more for $BTCUSDT.
DISCLAIMER: ((trade based on your own decision))
<<press like👍 if you enjoy💚
Pessimistic scenario for BITCOINAfter Bitcoin touched the price of 123,218, it entered a corrective phase. According to previous analysis, we expected the price to touch the range of $115,000-113,000. With the formation of more waves, it seems that the recent correction that started on July 14, 2025 is a diametric (bowtie) where waves f and g of this diametric are not yet complete and this pattern is part of a higher degree diametric and after this pattern is completed I expect a move towards the range of 140,000-150,000
Pessimistic scenario:
The pessimistic scenario is that this wave becomes a double pattern and enters the price range of wave-b (marked with a red dashed line) of the higher degree diametric. The probability of this scenario occurring is low and I consider the first scenario more likely, but we must be prepared for all market movements.
Good luck
NEoWave Chart

Bitcoin ready to correct to 92,000A treasure channel that, after a little suffering and fear, cascades down.
Tp:92000

5 Lessons from My First 100 TradesAfter executing and reviewing over 100 real trades in crypto, forex, and gold — I found patterns. Bad patterns. Repeating mistakes. And lessons I wish someone had told me earlier.
So I broke them down into 5 key insights that changed how I trade — and might just save you thousands.
📘 Here’s what’s inside:
1️⃣ Smart Profit-Taking:
How I turned 10 R/R into 32 R/R using a dynamic exit plan.
📘Further resource:
Cycle Mastery (HWC/MWC/LWC)
---
Multi-Timeframe Mastery
2️⃣ The Sleep Edge:
70% of my losing trades happened after bad sleep. Here’s why that matters more than emotions.
3️⃣ No More Blind Stop Orders:
Why I stopped using buy/sell stops without real candle confirmation — and what I do instead.
📘 Further reading:
Breakout Trading Mastery
---
Indecision Candle Strategy
4️⃣ Multi-Layered Setups Win:
How structure, S/R, patterns, and timing stack into high-probability entries.
5️⃣ News Trading? Just Don’t.
The data behind why most of my SLs were hit near news time — and how I avoid the trap.
💡 These aren’t theories. These are real lessons from real trades.
If this video helped you or sparked an “aha” moment, give it a boost, commenting your takeaway, and sharing it with a fellow trader.
lets grow together :)

BTC CAN HIT 125K AFTER SHORT CORRECTIONHello friends, Bitcoin has made an incredible climb, carefully looking at the chart and also based on Elliott wave theory, it is clear that Bitcoin is completing submicro wave 4 of micro wave 5, wave 4 is usually an extended wave that covers a large time period with up and down fluctuations, I think the end of submicro wave 4 will be in the 110k-112k range in the four-hour timeframe. I think Bitcoin will break the 25k range in the coming days.

Volatility Period: July 24-26
Hello, traders.
If you "Follow", you can always get the latest information quickly.
Have a nice day today.
-------------------------------------
(BTCUSDT 1D chart)
BTC is in a step up trend.
Looking at the bigger picture, it can be seen that it is in the second step up trend.
The important volatility period in this step-up is expected to be around August 2-5 (up to August 1-6).
Therefore, we need to look at what kind of movement it makes as it passes through the previous volatility period of around July 25 (July 24-26) and around July 31 (July 30-August 1).
In other words, we need to check which section is supported and which section is resisted, and see if it breaks through that section.
What we can see now is that it is checking whether there is support in the 115854.56-119086.64 section, that is, the HA-High ~ DOM (60) section.
Since the M-Signal indicator on the 1D chart has risen to the 115854.56 point, the key is whether it can receive support at the 115854.56 point and rise.
If it falls below the M-Signal indicator of the 1D chart and shows resistance, it is likely to meet the M-Signal indicator of the 1W chart.
This flow is an interpretation of the separation learned when studying the price moving average.
Therefore, we can see that the maximum decline point is when it meets the M-Signal indicator of the 1M chart.
-
Industries (coins, tokens) that are renewing the ATH are actually outside the predictable range.
Therefore, we should think of it as a situation where it is not strange whether it falls or rises at any time and think of a response plan.
Since it is currently within the predictable range, we can create a response strategy by checking whether there is support in the 115854.56-119086.64 section.
However, as I mentioned earlier, the volatility period is about to begin, so caution is required when making new transactions.
That is, you need to check whether it breaks out of the 115854.56-119086.64 range during the volatility period that continues until July 26.
And if it breaks out, you need to check whether it is supported or resisted in that area and respond accordingly.
-
The OBV indicator of the Low Line ~ High Line channel is showing a pattern of rising above the High Line.
Accordingly, if the OBV indicator is maintained above the High Line, it is expected to show an additional rise.
In accordance with this, you need to check whether the K of the StochRSI indicator shows a movement to rise in the oversold range and a transition to a state where K > D.
You also need to check whether the TC (Trend Check) indicator continues its upward trend and can rise above the 0 point.
If these conditions are met, it is expected that BTC will rise above 119086.64 or show a pattern of rising.
-
This decline created a low trend line, creating a perfect rising channel.
Therefore, we need to see how far we can go up along the rising channel created this time.
In that sense, we should pay close attention to the movement during the volatility period around July 25th (July 24-26).
-
Thank you for reading to the end.
I hope you have a successful trade.
--------------------------------------------------
- This is an explanation of the big picture.
(3-year bull market, 1-year bear market pattern)
I will explain more details when the bear market starts.
------------------------------------------------------

BITCOIN IS CREATING A SECRET PATTERN! (Huge move incoming?!)Yello paradisers! I'm describing to you what's going on with Bitcoin right now. We are creating a secret pattern that is forming, and once its neckline is reclaimed, we are going to have a huge movement.
In this video, I'm sharing with you the most important support and resistances on multiple time frames. We are describing Elliott wave theory wave count, and taking a look at candlestick patterns. We are talking about confirmations necessary for bullish and bearish cases. I'm explaining to you what the professional trading signals need for long-term profitability.
Some of the points are great risk-reward ratios. I'm talking about that in the video. One of them is taking only the highest probability trade setups, and having the patience and discipline to wait for them.
I'm talking about proper strategy which is needed, and systemology in your overall trading and how important it is. Here on TradingView, I'm describing to you the overall bias I have on Bitcoin right now.
Don't be a gambler. Don't try to get rich quick. Make sure that your trading is professionally based on proper strategies and trade tactics.

It's an Evacuation Through Green Candles💥 "One Last Leap of Faith?" - What Bitcoin Might Be Hiding Before September
The world’s on fire: Israel, Iran, Strait of Hormuz, oil, elections, the dollar, rates, black swan whispers.
And someone’s out here saying Bitcoin might still go up?
Yes. We are. Not because we believe - but because we see.
📉 Everyone’s afraid. The whales aren’t.
When the crowd goes into survival mode, the real game begins.
Whales aren’t exiting - they’re accumulating.
ETFs aren’t pausing - they’re inflowing.
The technical setup isn’t breaking - it’s compressing like a spring.
$104,000. Coil building.
If we break out - targets at $132K–$140K are absolutely in play.
👉 But that’s not the point.
The point is why this is happening while the world is burning.
🧠 The idea: Bitcoin isn’t a safe haven. It’s a distribution machine.
Gold is for panic.
Bitcoin is for structure.
Institutions don’t ask “is it scary?” - they ask “where’s liquidity?”
Everything is aligning for one last upside move.
Until September. After that - chaos is back on the table.
💣 The Global Playbook:
Now (Summer) - Consolidation, ETF flows, geopolitical fear - Strategic entries, low exposure
Breakout - FOMO panic, retail rushes in - Profit-taking via options
September–Fall - Macro/geopolitical shock - Already in cash or hedged
📌 Bottom Line
Yes, Bitcoin might pump. Not because the world is fine - but because someone needs to exit beautifully.
If you're reading this - you're early enough to think.
Markets don’t reward justice. They reward positioning.
🛠 What to do right now:
Watch the $104,000 level - it's the pivot
Breakout = final upside push to $132K–140K
Keep your eyes on September - reversal zone
Think in scenarios: entry, exit, protection
Follow EXCAVO - we don’t guess, we read the game
I've been talking about this scenario for a long time

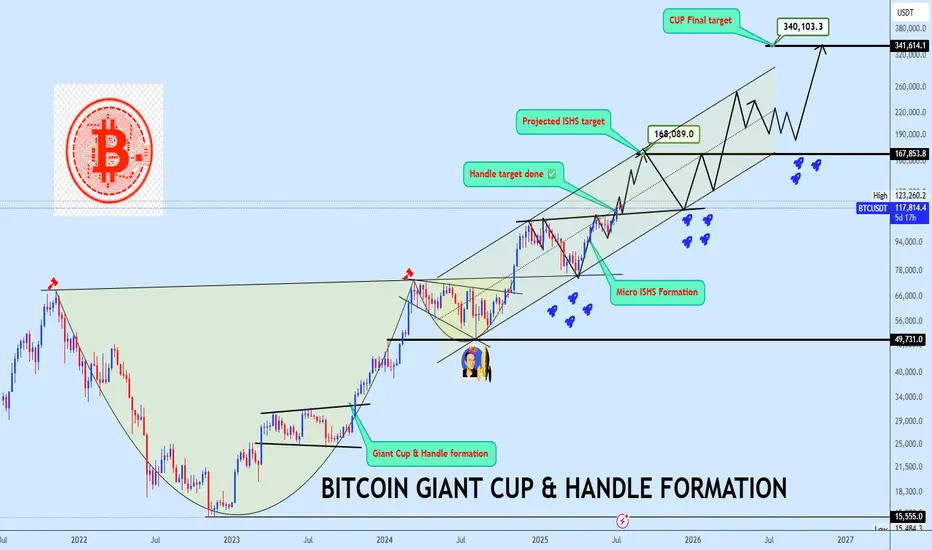
Bitcoin Bottom Three in progress targeting $340kBitcoin continues to defy the doubters, extending its dominance and triggering milestones that once seemed unreachable. A few years ago, we projected a massive rounding bottom with a target near $123K to complete the bottom two of the third halving cycle a bold forecast that has now played out in full:
📌
With bottom two now in the rearview, our focus shifts to bottom three of the fourth halving cycle, projected to mature around October 2025, barring time shifts:
📌
As shown on the chart, price has now split into a giant Cup & Handle formation and successfully broken out from the neckline. BTC is currently coiling inside a rising channel structure with trajectory toward the final projected target at $340K. A micro inverse head and shoulders (ISHS) formation has also emerged, offering a key accumulation zone near the neckline, this will be a crucial region to watch for entries.
Let price action do the talking. Share your view and let’s dissect this historic setup together.
btc short tradeon 1hr timeframe btc take the inducement and on 15m done MSS and now rice going to retest the 15m advanced oder block
entry 19131
stoploss 120990
target 1; 114685
target 2 ; 113650

BTC/USDT Buy Setup – VSA & Demand Zone Reaction✅ Entry: Current price action near 117,297
🎯 Target: 119,078 (+1.22%)
🛑 Stop Loss (SL): 116,944 (below demand zone)
📊 Technical Insight (Volume Spread Analysis):
Stopping Volume at Lows:
The recent down move halted with a wide spread down-bar on high volume, followed by an immediate rejection. This indicates potential professional buying absorbing supply.
No Supply Confirmation:
After the stopping volume, several narrow spread candles on low volume formed, suggesting weak selling pressure and a lack of commitment from bears.
Bullish Reaction:
Price rebounded from the demand zone with increasing volume on up-bars, showing early signs of demand dominance.
The current consolidation just above the support is typical of absorption before a markup phase.
Risk-Reward Structure:
The setup offers a favorable 2.2:1 R:R ratio, with the stop placed just below the zone to avoid false breakouts while allowing the trade room to breathe.
📌 Trade Plan:
Bias remains bullish as long as price holds above 116,944.
A breakout above the minor resistance (117,828) with volume expansion would confirm the next leg up toward the 119,078 target.
If volume fails to support the move, reassess before committing additional capital.
