BTC short setupGiven the bearish divergence on the lower timeframe and grabbing liquidity, we may be able to open a short position with low volume.
BTCUSDT trade ideas

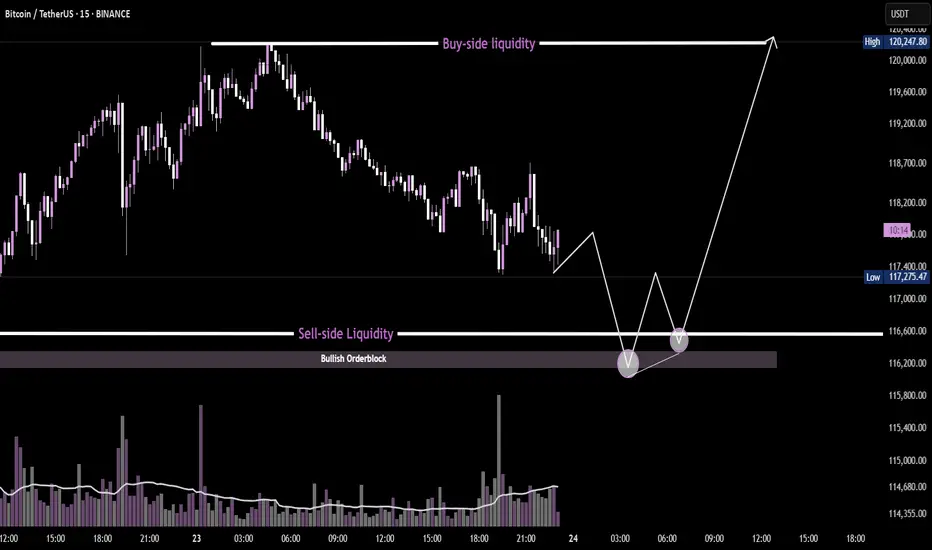
BTC/USDT 15min - Liquidity Sweep + OrderBlockPrice is approaching sell-side liquidity resting below equal lows, aligning with a key bullish order block. A potential W-pattern formation, combined with a volume spike at the sweep zone, suggests smart money accumulation. If confirmed, price may target the buy-side liquidity above, offering a high-probability reversal setup.
Tariffs incoming...July 23: Markets are booming.
August 1st: Tariffs.
I'm just saying, it might be a nice discount...
#market #finance #tariff #trump #crypto #forex #stocks #economy #trading
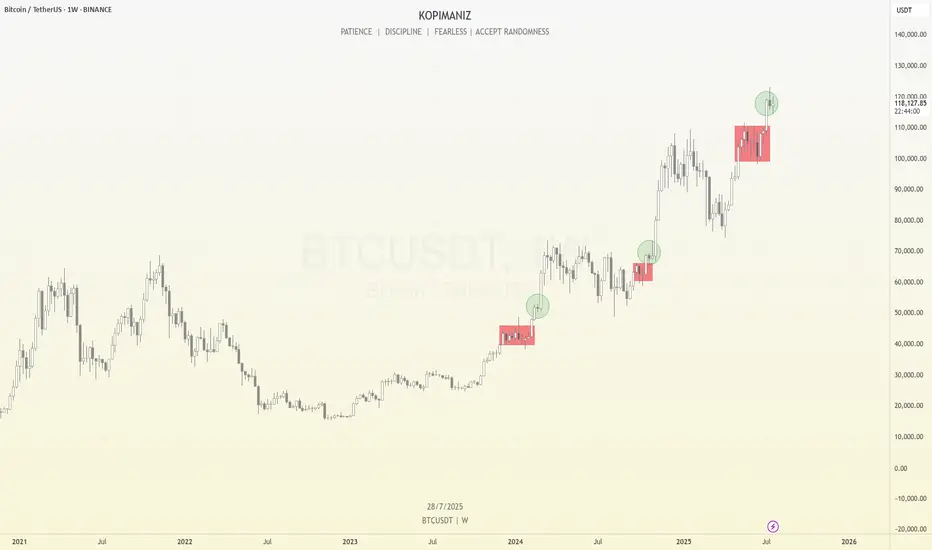
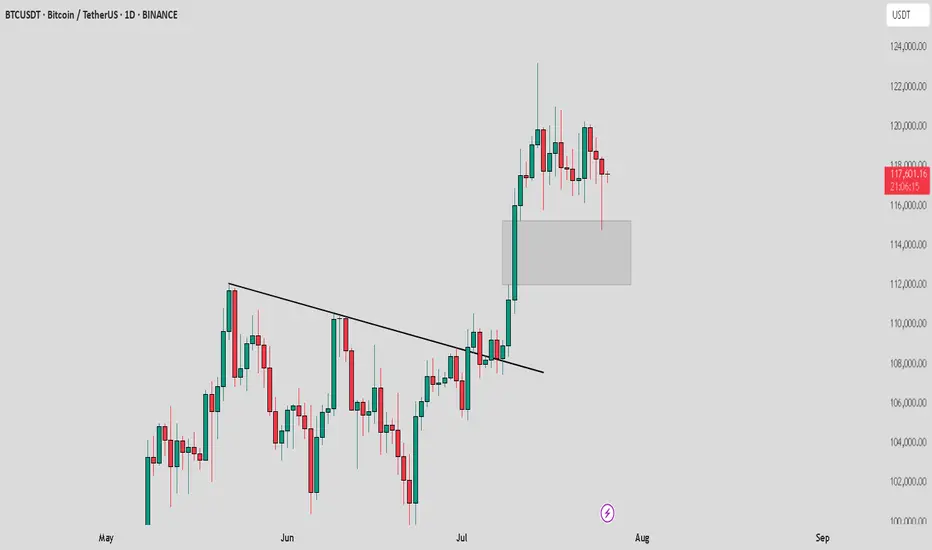
Bitcoin Weekly Structure: Repeating Rhythms and What’s Next
Bitcoin continues to follow a consistent structural rhythm on the weekly timeframe. We can observe that before every major breakout, price enters a multi-week consolidation phase, which I’ve marked using red boxes on the chart. These red box zones represent long periods of sideways movement, typically acting as reaccumulation phases. Once price breaks above these levels, it often results in a strong impulsive move, confirming that these areas serve as foundational support for trend continuation.
After each of these longer consolidations, Bitcoin tends to enter a brief 1–2 week consolidation right after the breakout, which I’ve marked with green circles. These short pauses are signs of healthy bullish momentum, often acting as flags or continuation patterns before the next leg up. What’s notable is that each of these green circle phases occurs after a clean breakout from a red box, and they consistently lead to further price appreciation.
Currently, Bitcoin has just broken out of another red box zone between ~$100k and ~$110k. Over the past two weeks, it has formed a small range near $118k, resembling the same green circle structures we’ve seen earlier in the trend. Given this recurring pattern, there’s a high probability that we are once again in the early stages of a bullish continuation. If the pattern plays out as it has in the past, the next move could be another strong weekly candle pushing toward new highs.
However, I’m paying close attention to the $125k–$126k level. This psychological zone may act as a major turning point. It could lead to either a prolonged consolidation phase that lasts for months, or potentially trigger a significant correction if the market faces strong resistance. This level marks a critical area where momentum may shift, so it deserves extra caution as we approach it.
This type of structural repetition helps me stay grounded in my analysis—focusing not just on price, but also on how long and where Bitcoin consolidates. So far, the rhythm has been clean and reliable.
Let’s see if Bitcoin respects the rhythm once again.
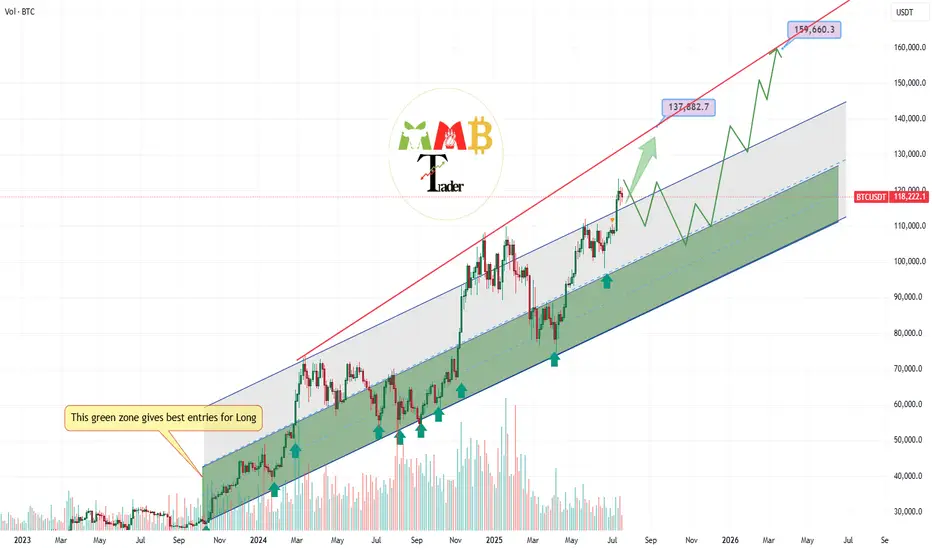
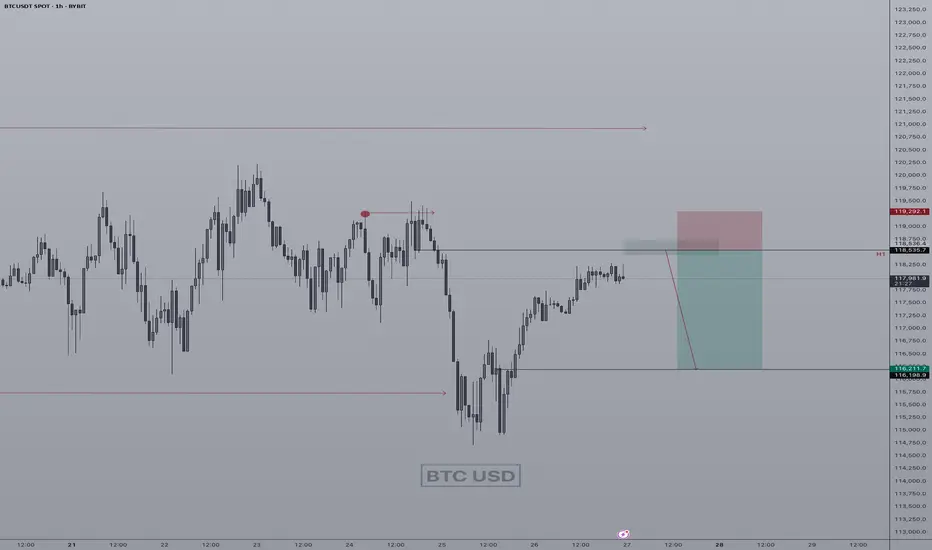
Bitcoin first target and short-term pump at least to 137K$ aheadAs we can see stop and next range zone for price can be near 135K$ to 137K$ and also major support zones now are 115K$ and 105K$ that can pump price once again if they touch.
Red trendline was strong resistance and it usually stop the pump and it is daily high detector now unless it breaks this time.
DISCLAIMER: ((trade based on your own decision))
<<press like👍 if you enjoy💚
[SeoVereign] BITCOIN BULLISH Outlook – July 24, 2025We are the SeoVereign Trading Team.
With sharp insight and precise analysis, we regularly share trading ideas on Bitcoin and other major assets—always guided by structure, sentiment, and momentum.
🔔 Follow us to never miss a market update.
🚀 Boosts provide strong motivation and drive to the SeoVereign team.
--------------------------------------------------------------------------------------------------------
Hello.
This is SeoVereign.
I am still holding the long position that I suggested in the idea posted on July 9th.
Regarding the upward trend that started around 107,200 USDT, I have consistently maintained my position without much doubt until just before posting this idea, as there were no clear signs indicating a decline.
However, at the time of writing this idea, some elements suggesting downward pressure are gradually being detected. Nevertheless, this idea is constructed around the upward scenario. The reason is that, as mentioned in this idea, a ‘single upward move’ is expected to occur with relatively high probability. Whether this rise leads to a trend reversal or serves as a precursor to a downturn will likely depend on how the chart unfolds.
The average TP (target price) is set around 119,300 USDT.
As always, I will carefully observe how the chart develops over time and will update with further explanations that organically integrate the detailed interpretations and grounds of this idea accordingly.
Thank you.

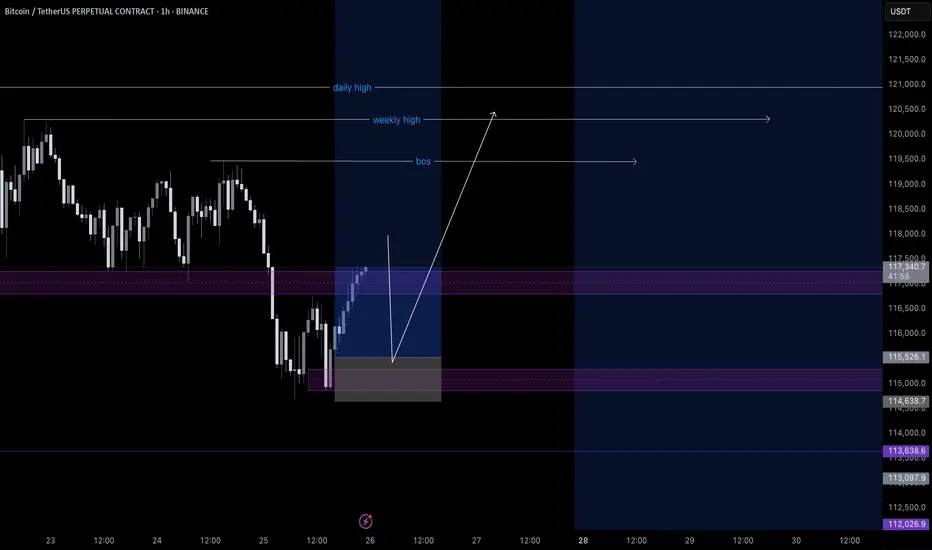
BTC SELL SHORT IDEA H1quick momentum short,to create weekly low manipulation for any masjor move, right now focus is on the sell move, following sub struture ltf trend pull back
Bitcoin - August 25This technical analysis is for informational and educational purposes only. It does not constitute financial advice. Remember to always research and consult with a professional before making investment decisions. Good luck! 📈💼🚀
$BTC Important levels to watch1- Important levels to watch for TOP are:
128,000
139,000
161,000
173,000
2- The most important levels are 161K & 173K
3- But apart from these levels, be ready for any level to be the TOP.
(and again, Bull market is not over, watch my previous analysis BTC/XAG on the last post)

Structural and Technical Analysis of Crypto + BTC + Altcoins + TStructural and Technical Analysis of Crypto + BTC + Altcoins + Totals + Dominance
🔔 Follow me & smash that rocket 🚀 if you find this useful! Let's ride the next wave together!
🕒 Timeframe: 4H
🧠 Strategy: Customized Dow Theory + Structural
---
🟡 A critical moment for the market:
Many coins, including top 10 alts, are currently sitting on major key levels. Yes, you can go long — but only IF volume supports the move.
📈 That means we must keep an eye on:
TOTAL, TOTAL2, TOTAL3
BTC.D, USDT.D
---
💎 Bullish Trigger Conditions:
✅ BTC.D must show strong red candles (dominance falling)
✅ USDT.D must break below 4.22-4.23 (money flowing out of stablecoins)
✅ TOTAL must break 3.85T
✅ TOTAL2 must break 1.48T
✅ TOTAL3 must break 1.05T
🔴 If all these confirm, it could be a great trigger to enter alt positions.
---
🔍 BTC Outlook
As previously mentioned:
🟥 If sellers want BTC below $115K, they need to break it fast and sharp — slow breakdowns won’t work due to buyer activity.
🟨 Bullish trend requires a break above $120K.
📊 Most likely scenario? Ranging between $115K - $120K
⚠️ BTC Dominance plays a key role here. If dominance drops while BTC ranges, alts could explode.
---
💸 USDT.D Critical Level:
A clean breakdown of 4.23 on USDT.D = 🚀 Funds rotating into alts
---
✅ Coins To Watch (Long Setup Only IF Above Conditions Hold):
♦️BNB
enter:741.00
Sl: 786.13
♦️ETH
enter:3750
Sl: 3480
♦️SUI
enter:4.10
Sl:3.40
♦️XRP
enter:3.25
Sl:2.92
♦️LINK
enter: 18.60
Sl: 17.4
♦️AAVE
enter:295
Sl:276
♦️ADA
enter:0.8405
Sl: 0.7628
♦️SOL
enter: 192.40
Sl:177
♦️DOGE
enter:0.249
Sl:0.220
🔁 Note: First SUI trigger was 3.80 — next key level is 4.10.
---
⚠️ Important Notes:
Today is Saturday, expect low volume
Manage risk ⚠️ and avoid aggressive Martingale strategies
High chance of fake breakouts
Levels being tested might just be lower highs in a bearish structure
❗️Even for bearish continuation, volume increase is key
---
🟢 If you liked this post, don’t forget to Follow & Hit the 🚀 Rocket to stay updated on live setups and strategic insights!
[SeoVereign] BITCOIN BULLISH Outlook – July 26, 2025The previous idea did touch the average TP price, but showed a rather disappointing rebound, so I will once again attempt to capture the starting point of the rebound. It is still considered that one more upward wave remains.
Accordingly, the TP is suggested at 118,057 USDT.
As always, I will carefully observe how the chart develops over time and update this idea with further explanations by organically integrating its specific interpretations and underlying rationale.
Thank you.

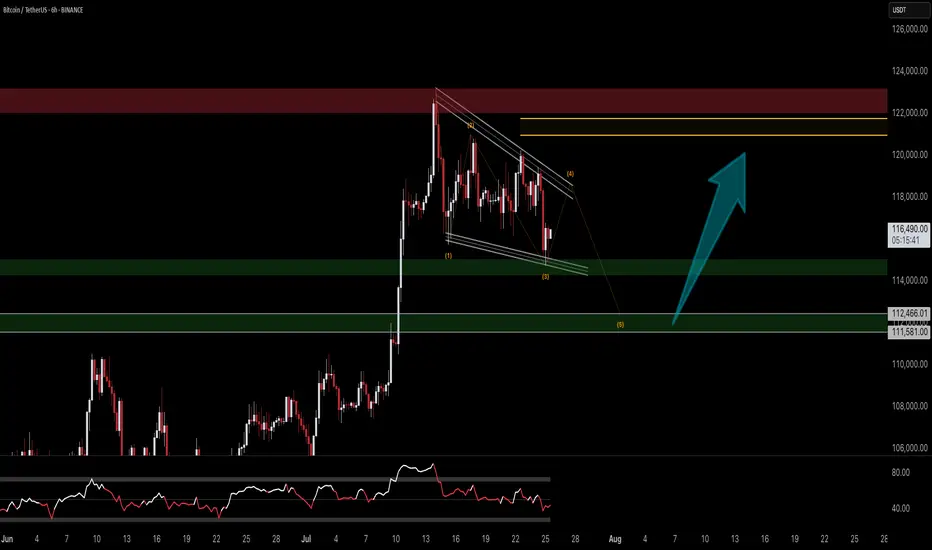
Bitcoin Prediction UpdateI've just modified the wave count and still the previous analysis is valid...
I'm not sure about the target of the last wave (the 5th of 5th wave) because it can be an extended wave...
The shown box is where I'll investigate to find any ending pattern...
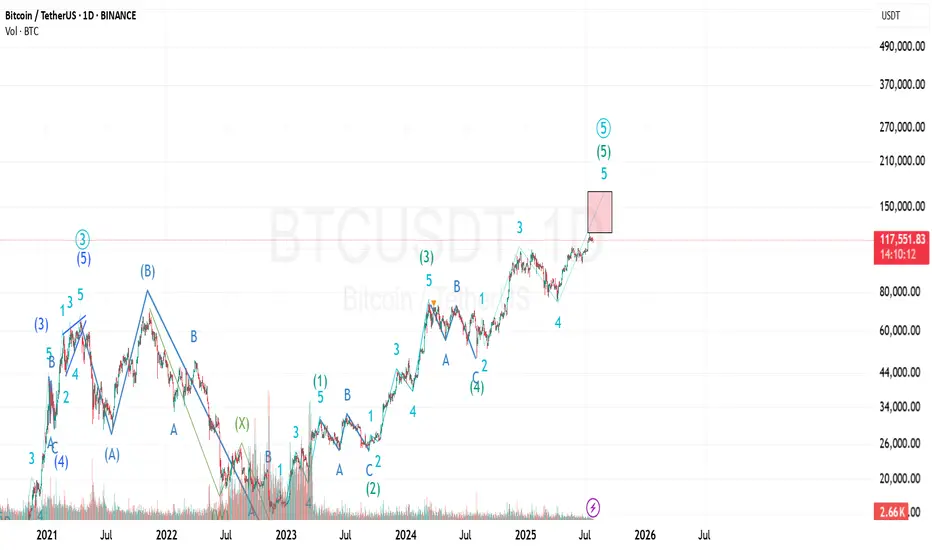
BTC should have one more leg upAccording to Elliot waves BTC should have one more impulse leg up to complete final wave of this cycle. Both daily and weekly RSI charts show bearish divergence, suggesting momentum is weakening even as price attempts to climb. A drop below $110000 would invalidate the current wave count and suggest a shift in market structure.
. Need to watch out reactions at target levels 136-150.

BTC /USDT : Getting support from FVG BTC Support from FVG - Bullish & Bearish Scenarios:
Bullish Scenario:
BTC is holding support from the FVG. As long as BTC stays above this zone, the market remains bullish. A bounce here could lead to further upside.
Bearish Scenario:
If BTC breaks below the FVG, it signals a potential downtrend. A breakdown may lead to more pain and further declines in the market.
Tips:
1. Wait for Confirmation: Look for a clear candle close above/below FVG for validation.
2. Risk Management: Set stops near the FVG to manage potential losses.
3. Monitor Volume: Strong volume during support retests increases bullish potential.
4. Stay Flexible: Be prepared for a market shift if BTC breaks the FVG support.
Bitcoin is OverheatedI’m observing the current situation in the BTC market and want to share a brief reflection. The latest upward impulse doesn’t just look confident—it’s starting to resemble overheating.
The price has detached from its averages, and the movement is accompanied by local euphoria. I see the community piling in “at the highs,” hoping for continuation. But it’s crucial to understand: markets don’t grow forever. Especially when the growth lacks proportional volume and fundamental support.
I use a comprehensive technical approach, and one of my indicators has given a clear signal—the market is overheated. We’re currently seeing a classic state of overbought conditions: the price is moving too far, too fast.
This doesn’t mean you should immediately short or panic. But as a trader, I understand that in such a phase, it’s wiser to:
– Partially take profits,
– Move stops closer to the market,
– And absolutely avoid entering new longs on emotions.
Typically, after such surges, the market either consolidates or corrects by 10–20% to shake off the overheating and provide an opportunity to enter at fairer levels. Personally, I’m waiting for a return to balance and a reset. I don’t rule out a final “explosive” move upward on news, but such breakouts usually end as quickly as they begin.

Btcusd outlook
Price tapped into our area and showed strong reaction.
Now watching how it behaves around 118.4k and 120.7k.
If bulls stay in control, 122k could be next.
Let’s see how it unfolds. 🔍📈

Bitcoin AnalysisWe have an order block in 1Hour TF, price can retest this before bullish continuation. If it breaks below bearish momentum continues.
BTC Retested and Ready for the Next Leg Up?This CRYPTOCAP:BTC weekly chart shows a clean pattern of breakout → retest → rally.
The 50 EMA has been acting like a strong dynamic support throughout the uptrend, keeping the structure intact. Every time price broke out of a consolidation or resistance zone, it came back, retested it, and then continued moving higher.
Most recently, BTC broke above a key resistance, pulled back to retest it, and now it looks like the breakout has held. This is a classic bullish continuation setup, and historically, it’s led to strong follow-through moves.
As long as BTC stays above the 50 EMA and holds support, the bullish structure remains intact.
Thanks for reading! Stay sharp and trade safe.

BTC- New ATH?BTCUSDT – Potential Reversal from CME Gap Support
Bitcoin is currently trading around a key demand zone aligned with a CME gap between ~$115,272 and $114,000. Price recently swept local lows with increased volatility and is showing signs of absorption just above the 0.382 Fibonacci retracement ($113,660), which adds confluence to the area.
If BTC continues to hold above this zone and shows volume confirmation, I expect a strong bullish reaction. This move could initiate a rally toward the previous high and potentially lead to a breakout to new all-time highs (ATH), as outlined in the red projected path.
Key levels- LQ, Fibbo 0.382, CME gap - futures

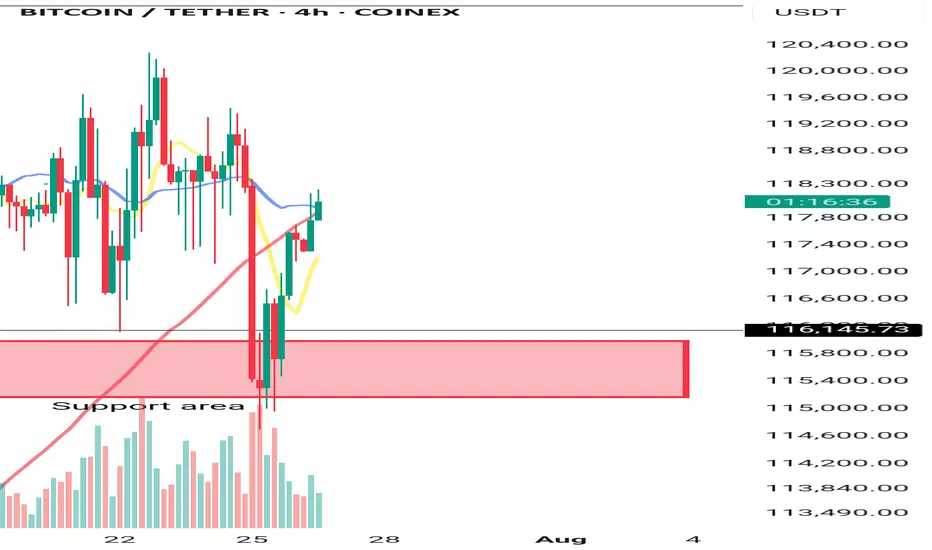
BTC dropping like a brick....bound to happen sooner or laterHard drops follow big spikes. Happens every time, just look back in time. But this time it's different? Maybe to some extent, but as long as there are short term profit takers and insane volatility this trend will continue. Only 2 cents is to not SHORT SELL. You will only contribute to the potential squeeze and will lose money. If you're up now, your priority should be to retain value and sell before it goes down to it's next support level which is under 100k! Maybe it does or not, but the dips do happen and with automated trading bots it could hit more aggressively and faster. If anything, but the dip when there's sufficient support. Best of luck!
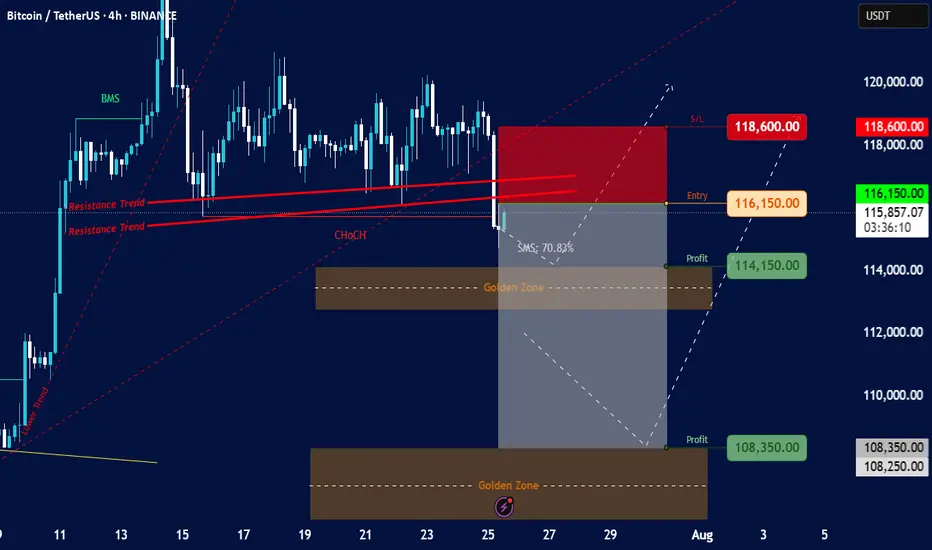
Bitcoin/TetherUS (BTC/USDT) on a 4-hour timeframeOverall Trend & Price Action:
Prior Uptrend: The chart shows a clear uptrend leading up to around July 15th, marked by an "Order Trend" line (dashed green).
Break of Market Structure (BMS): A "BMS" (Break of Market Structure) label is visible, suggesting a significant shift in market dynamics, likely indicating the end of the previous uptrend or a strong pullback.
Consolidation/Distribution: After the initial uptrend, the price appears to have entered a period of consolidation or potential distribution between approximately $115,000 and $120,000.
Resistance Trends: Several "Resistance Trend" lines (red) are drawn, indicating areas where the price has faced selling pressure. A recent breakdown below these resistance lines is evident.
Change of Character (ChoCH): A "ChoCH" label is present, which often signifies a change in the prevailing market sentiment or trend, confirming the shift away from the strong bullish momentum.
Current Price & Trading Setup:
Current Price: The current price is around $115,849.44.
Proposed Entry: The chart suggests an "Entry" point at $116,150.00. This is positioned just above the current price and within a potential retest zone of the broken resistance.
Stop Loss (S/L): The "S/L" is set at $118,600.00, indicating a risk management level if the trade goes against the intended direction.
Profit Targets (Profit):
First Profit Target: $114,150.00, located just above the first "Golden Zone."
Second Profit Target: $108,350.00, situated within the second "Golden Zone."
Golden Zones: Two "Golden Zones" (brown shaded areas) are identified, which are typically areas of significant support/demand or Fibonacci retracement levels where price is expected to react. The current setup seems to target these zones for profit-taking.
SMS: 70.83%: This "SMS" value (likely referring to "Smart Money Score" or a similar metric) of 70.83% suggests a strong bearish bias or conviction in the current setup.
Interpretation & Potential Strategy:
The analysis suggests a bearish trading setup for BTC/USDT.
The presence of BMS, ChoCH, and the breakdown below resistance trends indicate a potential shift from bullish to bearish sentiment or a significant correction.
The proposed short entry at $116,150.00 aims to capitalize on further downward movement.
The profit targets align with identified "Golden Zones," suggesting that these are anticipated areas of support where the bearish momentum might temporarily stall or reverse.
The significant "SMS" value reinforces the bearish outlook.
Risks & Considerations:
Reversal from Golden Zones: While profit targets are set at Golden Zones, these are also potential areas for price reversals if strong buying interest emerges.
False Breakout/Breakdown: The market can always surprise, and a re-entry above the stop-loss level would invalidate the current bearish setup.
Market Volatility: Cryptocurrency markets are highly volatile, and rapid price movements can occur.
News Events: Unforeseen news or macroeconomic events could significantly impact price action.
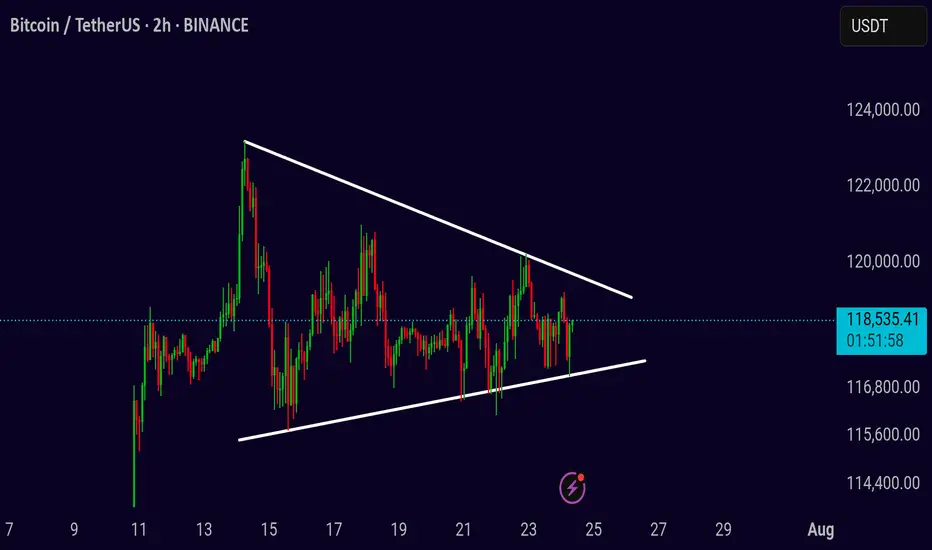
BTC Symmetrical Triangle – Decision Time Soon
BTCUSDT Idea (2H Chart)
BTC is consolidating inside a symmetrical triangle, creating pressure for a breakout. Price is currently ranging between 116K–120K, with volatility compressing.
Patience is key here — don’t rush entries.
A confirmed breakout or breakdown will give the real direction.
Break above the triangle = bullish continuation
Break below = further correction ahead
Wait for 2H close outside the pattern with volume
Watch levels:
* Upside: 120K → 124K → 128K
* Downside: 116K → 112K → 108K
Setup is maturing — breakout is just a matter of time. Let the chart lead, not emotions.
Bitcoin’s Epic Run from 80K to 120K: What’s Next for BTC?Yo traders, it’s Skeptic from Skeptic Lab! 🩵 Diving into Bitcoin’s wild ride from 80K to 120K—breaking down the key supports, resistances, and what’s next for BTC.
From the $76k bounce to smashing $110K, we’re eyeing the $120K PRZ. Will it correct or keep soaring? Check the video for the full scoop! Drop your thoughts or coin requests in the comments, boost if it vibes & Let’s grow together!
