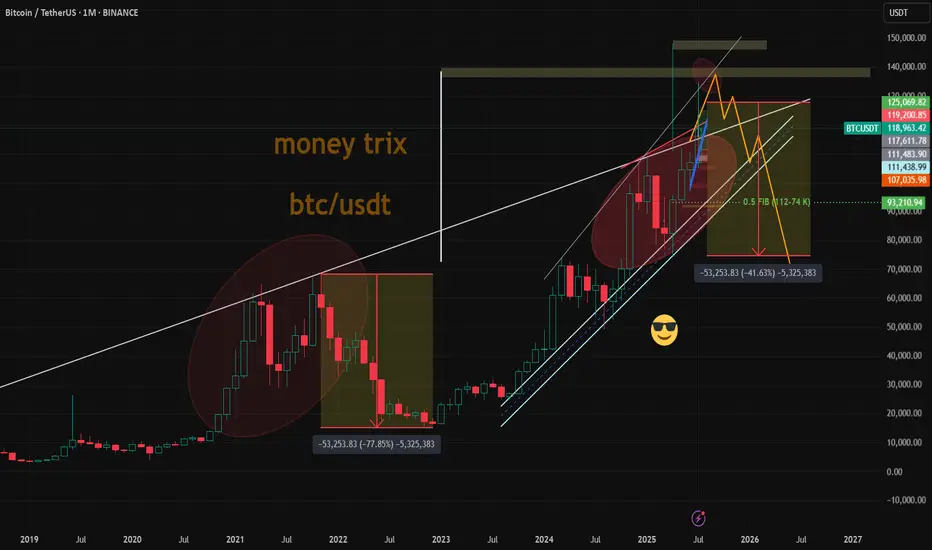
its not about historic, its just analysing of weekly behaviour hwhy both elips areas have same pattren
but first one use to liq longs & 2nd one use to sqeez shorts !
kindf rising wedge !
iits horrified!
134 & 139k heavy selling
BTCUSDT trade ideas
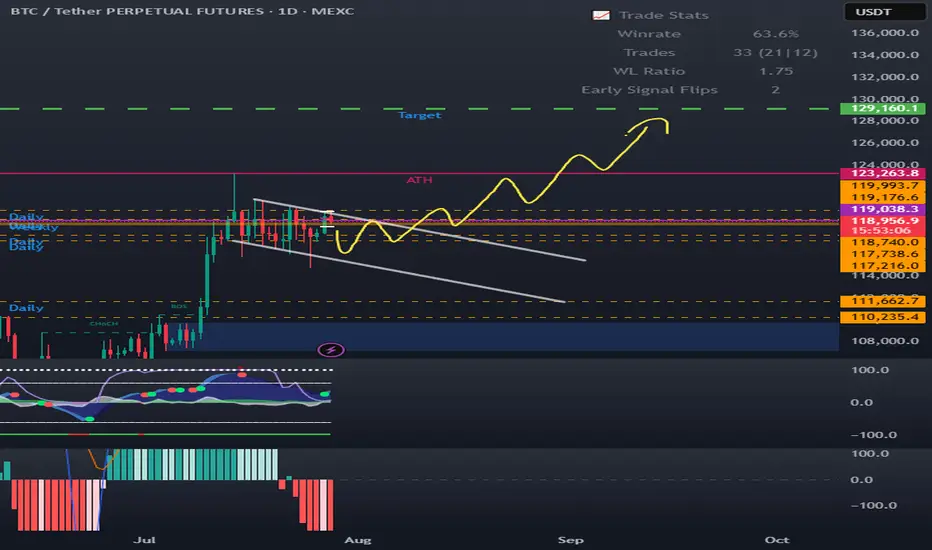
Weekly trading plan for BitcoinLast week price followed our orange scenario. Right now, we're stuck in a sideways correction, and here's what matters:
1. $118K is the big level this week
Stay above it? Good chance we retest ATH
Break below with no recovery? That's trouble
2. If we lose $116,780 next → $112K becomes the target
I've got all the charts and details covered in this video idea—check it out for the full picture!

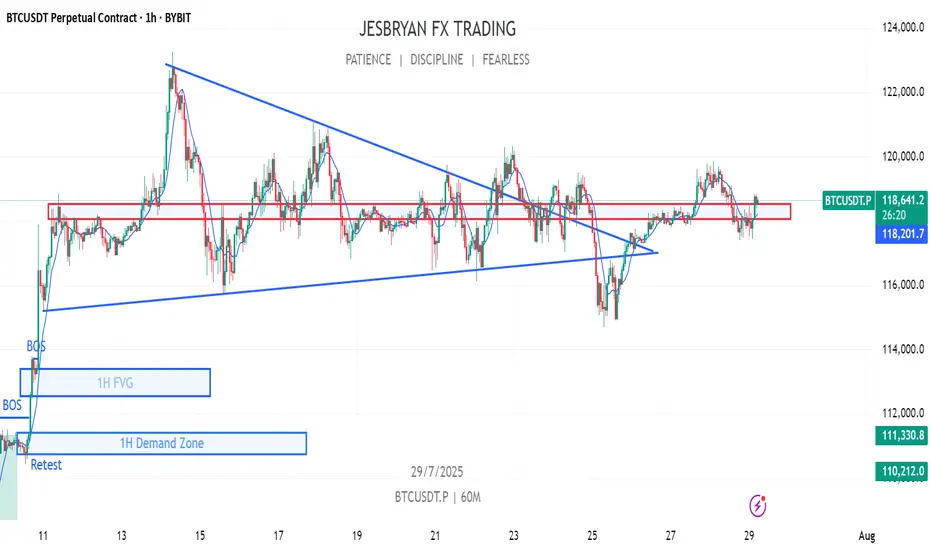
Bitcoin BrokeBitcoin broke below the support area to liquidate high-leverage positions. The price has now regained the $118,000 area and is expected to move upward. The key resistance level is at $120,000.
BTCUSDT BEARISH LONG CHART ANALYSIS📉 BTCUSDT – Bearish Setup in Play (1H)
Bitcoin faces rejection near 119500 resistance and is currently trading around 117000. If price breaks below 115000, bearish momentum may extend toward the 112000 target zone.
🔸 Resistance: 119500
🔸 Support Zone: 115000
🔸 Bearish Target: 112000
Structure remains weak unless buyers reclaim 119500. Watch price action closely.
---
📌 This analysis is for educational purposes only. Trade safe and manage risk properly.

BTC MACD Liquidity Tracker Strategy – High Timeframe Long CallsThis BTC 8H chart shows how the MACD Liquidity Tracker Strategy has tracked trend structure cleanly across multiple long signals — each aligning momentum and EMA bias on the mid-to-high timeframe.
First long: Triggered at ~64,565 and exited near 99,560 as momentum peaked
Second long: Re-entry at 83,419 after reclaiming structure, closed near 111,958
Third long (active): Triggered at 108,342 and currently holding above 117,000 with trend still intact
Color-coded bias (blue/pink) helps confirm context at a glance. The combination of MACD momentum shifts + 60/220 EMA filters prevents early entries and helps capture large legs without excessive noise.
Want to explore or customize the strategy?
Search “MACD Liquidity Tracker Strategy ” and run your own backtests to refine parameters per asset.

Btc sell for In the lower timeframe, Bitcoin is showing oversupply and has the potential to correct to the specified level.

Btc is fallingHello, considering the breakdown of the upward trend line and the pullback to the downward trend line that I drew, the price will most likely fall to the specified support level and we will enter a resistance phase.

What Nobody Taught You About Risk Management. Part 1
Numerous authors and communicators have addressed the importance of risk management, more or less comprehensively, but I have not come across any who present what I intend to share with you today. Once my presentation is complete, I will share some useful resources with which you can complement what you learn here, as I will only cover an important but small part of the topic: execution.
What is risk management?
Risk management is the planning an investor undertakes to protect capital and maximize profits. It encompasses factors surrounding the creation of a profitable system or method, the allocation of our capital, and the execution of our trades.
Some key concepts:
Risk-Reward Ratio
The risk-reward ratio is a metric used in trading and investing to assess the relationship between the risk taken in a trade and the expected potential profit. It is expressed as a ratio, for example, 1:1, 1:2, 2:1, etc.
Stop Loss (SL)
The SL, or stop-loss, is an automatic order placed in a trading operation to close your position at a specific price, with the aim of limiting losses if the market moves against you.
Take Profit (TP)
The TP, or take-profit, is an automatic order placed in a trading operation to close your position at a specific price to secure profits when the market reaches a favorable level. It is the point where you decide to "take" your profits and exit the trade.
Margin
In trading, margin is the amount of money a trader must deposit or maintain in their account to open and sustain a position.
Volatility
Volatility, in the context of trading and financial markets, measures the magnitude and frequency of changes in an asset's price.
Leverage
Leverage in trading is a tool that allows investors to control a larger market position using only a fraction of their own capital. It acts as a "loan" provided by the trading platform, amplifying both potential profits and potential losses.
Risk Management and Trade Execution:
The most common problem among other investors, beyond psychological factors or lack of experience, is the absence of total control over their trades. They use random leverage, take entries with risk-reward ratios below 1:1, and some don’t even know what percentage of profits or losses they will have at the end of the trade.
For an investor to execute a successful trade, they must meet the following criteria:
1. Ensure minimum risk-reward ratios of 1:1.
2. Properly allocate their investment capital, adhering to strict rules to avoid undermining their statistical performance.
3. Adapt to volatility and know how to adjust their leverage accordingly.
4. Set a fixed stop-loss (SL) price and determine what percentage of losses they are willing to accept per trade.
5. Set a fixed price for taking profits from the trade and know what percentage of profits they will achieve.
Failing to meet these parameters will not only destroy traders’ profitability but also make it impossible for them to develop reliable investment systems and methods.
Incorrect Execution:
For example, if I see an entry opportunity in BTC/USDT, it would be a mistake to choose random leverage and plan to manually close when I think I’ve gained or lost enough. The volatility of the price chart itself may or may not require leverage, and that leverage must be adjusted to our risk management strategy. Trading in the manner described above is a recipe for failure, which is why it’s a lucrative business to allow inexperienced investors to access markets through online platforms.
Correct Execution:
Before explaining a practical case, let’s assume I use a $1,000 amount per trade and am willing to risk a 20% stop-loss (SL). These parameters are non-negotiable to avoid undermining my statistical performance.
A few days ago, I took the trade shown in the chart. To enter this long position in BTC/USDT, the first thing I did was identify the entry point and the exit points for my trade (SL and TP). The trade met a minimum risk-reward ratio of 1:1, so I considered whether leverage was necessary. A volatility of 9.07% from the entry point to my SL price offered low profit expectations relative to what I was willing to risk from my margin per trade (20% of $1,000). I needed leverage.
In the toolbar on the left, once you have a price chart open in TradingView, you can use the ruler to easily measure the percentage of volatility.
How can I ensure that 20% of the margin I’m investing is triggered when the price reaches my SL zone using leverage?
To calculate the exact leverage, we divide the SL percentage we’re willing to risk (20%) by the volatility percentage from the entry point to the SL price (9.07%).
For example, my entry point in BTC was $109,898, and the exit point or SL was $99,930. I measured the volatility between the entry price ($109,898) and the exit price ($99,930), resulting in 9.07%. Since the volatility was somewhat low and I wanted to risk 20% of my margin per trade when the price hit my SL, I calculated the required leverage. To do this, I divided 20% (the percentage I was willing to lose per SL) by 9.07% (the volatility percentage from the entry price to the SL price). The result was approximately 2x leverage when rounded.
In summary: At 2x leverage, we would lose approximately 20% of our capital if the price reached $99,930. Since I had a 1:1 risk-reward ratio before entering the trade, I assumed I would gain approximately 20% of the invested margin when the price reached $120,000.
The trade was a winner, reaching the TP price without issues and generating a 20% profit on the margin I invested ($1,000).
Use investment platforms that allow you to manually adjust leverage, such as 1x, 2x, 3x, 4x… 38x, 39x, 40x, and avoid platforms where leverage is set to default values like 1x, 5x, 10x, 20x, 50x… This seemingly minor detail for most small investors allows platforms to pocket large fortunes from failed trades.
Conclusions and Recommendations:
Risk management is the backbone of investors, and knowing how to execute entries with precision is rare among retail traders. Even so, I’ve only covered a small part of this topic. To complement this knowledge, I recommend searching on YouTube for the video by investor and educator Yuri Rabassa titled “The Secrets of Good Money Management.” This video will help you develop basic statistical skills that are vital for creating a trading system. Additionally, in the book *Forex Price Action Scalping* by renowned author Bob Volman, you’ll find a very insightful chapter titled “The Principle of Probability.”
Final Note:
If you’d like to take a look at my analysis log, you can find my profile in Spanish, where I transparently share well-defined market entries. Send your good vibes if you enjoyed this article, and may God bless you all.

BTC Roadmap Ahead: Ideal Entry, TP Zones & What to AvoidAs long as Bitcoin stays above the ~$98,200 zone on the daily timeframe, I believe the bullish trend remains intact.
No need to panic — what we need now is rational decision-making, not emotional reactions.
Since price has reached a key area around $118K–$120K, I’ve already taken partial profits at this level.
If no major fundamental changes occur and conditions remain stable, I see the maximum target for this leg somewhere between $134K and $140K, where I plan to secure additional profits.
Right now, my main objective is to increase my Bitcoin holdings.
The first buy zone I’m watching is around $110K, clearly marked with a red circle on the chart.
When price reaches this zone, I won’t enter immediately — I’ll wait for consolidation and confirmation, as a deeper correction is still possible.
There’s no need to rush — patience is power.
📌 All I’m trying to do is accumulate as much Bitcoin and sats as I can — because I know one day, I’ll be proud of it.
🔁 This analysis will be updated whenever necessary.
Disclaimer: This is not financial advice. Just my personal opinion.

BTC Long Outlook – Grand Supercycle Perspective (2025.05.21)Hello everyone,
This is SeoVereign, the operator of the SeoVereign team.
It's been nearly a month since I returned to TradingView and started posting ideas again.
During that time, I’ve frequently shared short-term ideas based on minute charts.
However, since real-time responses are crucial in short timeframes,
there are practical limitations in explaining all the reasoning behind our analysis in detail each time.
But when it comes to larger timeframes like the daily chart,
we have a bit more flexibility.
So I see this as a valuable opportunity to explain our thought process and key reasoning more thoroughly.
Now, let’s get into the Bitcoin daily chart briefing.
Please refer to the following link first.
This is a post I made on April 18, 2025:
🔗
At the time, I shared the view that the upward wave starting near 75K
had the potential to extend to 88K and even 96K.
However, it was difficult to determine exactly how far the wave would extend at that point.
Now, I want to make one thing very clear.
If someone uses wave theory to say something like
"Bitcoin will definitely go to X price,"
that person is either a scammer or someone who fundamentally misunderstands wave theory.
Elliott Wave Theory can be somewhat useful in anticipating short-term moves,
but it has clear limitations when applied to long-term predictions.
After many years of studying Elliott Wave Theory in depth,
I've come to a simple but important conclusion:
"You cannot predict the distant future with technical analysis alone."
That said, there is one exception:
very short-term movements — the immediate price action right in front of us —
can often be approached with some confidence using technical analysis.
Here’s an example.
If someone bought Bitcoin at 10K and says,
“I’m going to sell at 100K,”
while it hasn’t even broken past 50K,
that’s just reckless optimism.
But if Bitcoin has already approached 100K,
and several bearish signals are starting to emerge and become confirmed,
that’s when we can begin considering short positions.
The key is to make decisions based on the data right now — not based on hopes or assumptions.
That was a long introduction.
Now, let me explain why I believe Bitcoin could break to new all-time highs
and possibly reach as high as 130K.
As I mentioned in the April 18 post,
I believe an Ending Diagonal was completed around the 74K region,
and I anticipated an upward impulse wave to follow.
In my view, the current market structure clearly suggests we are in an uptrend.
Many of you have reached out via private messages asking,
“What kind of wave are we in right now?”
But in this case, that question doesn’t hold much value.
Whether this current move is part of an impulse wave or a corrective structure,
what matters is that the price is going up.
If, for instance, the A-wave has completed — as confirmed by Fibonacci —
then the B-wave would follow, and we can plan accordingly with long positions.
Or, if the ABC correction is already over,
then a new impulse wave could be starting.
Either way, the key takeaway is that we’re likely in an upward phase.
Back to the main point:
A Deep Crab harmonic pattern formed near 74K,
and that zone concluded with an Ending Diagonal,
which is now leading to a bullish reversal.
I've studied harmonic patterns for years,
and in the case of the Deep Crab,
the upper boundary of the Potential Reversal Zone (PRZ)
is typically around the 2.24 Fibonacci extension.
As long as this level is not broken,
the pattern remains valid.
And when a reversal happens near the 1.618 or 1.902 zones,
it’s often a highly reliable bullish signal.
So, what are our targets in this current rally?
🎯 SeoVereign’s Target Strategy
1st Target: 109,000
2nd Target: 118,600
3rd Target: 128,100
Right now, before the market enters a full-scale bullish breakout,
we’re seeing unusually high volatility.
In times like this, staying calm and grounded is more important than ever.
I sincerely wish all of you the best of luck in navigating this volatility,
and may a wave of growth come to your accounts as well.
🍀 I genuinely hope great fortune finds its way to all of you.
See you in the next daily briefing.
Thank you.
— SeoVereign

BTC 1W – Macro Trend with MA200Weekly chart of BTCUSDT showing long-term macro trend. MA200 helps identify bull vs bear market phases.

BTCUSDT LongAfter respecting the 200EMA i´m exspecting more bullish momentum. My TP will be around 119.000 and I will adjust the SL as soon, as we reach this target and let the trade take its way

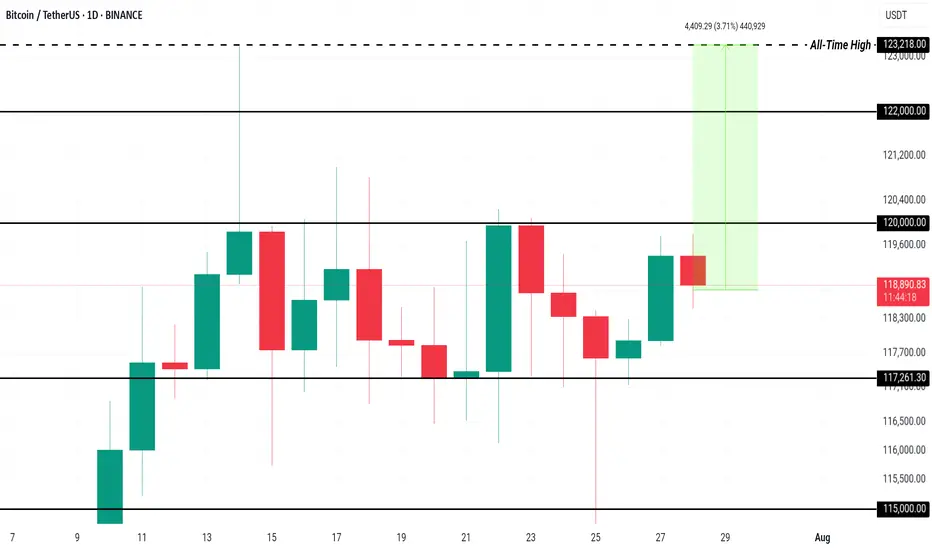
Here’s Why Bitcoin Price Could Rewrite History in AugustBINANCE:BTCUSDT price is currently hovering at $118,938, within a consolidation range between $117,261 and $120,000 . While this range has held steady, the possibility of breaking through $120,000 is high if investor sentiment remains strong.
The current sell-side risk ratio for BINANCE:BTCUSDT is at 0.24, well below the neutral threshold of 0.4 and closer to the low-value realization threshold of 0.1. This suggests that the market is experiencing consolidation, with investor behavior indicating a pause in large sell-offs.
Historically, August has been a bearish month for BINANCE:BTCUSDT , with the median monthly return sitting at -8.3%. However, given the current accumulation trend and the low sell-side risk, Bitcoin may defy its historical trend this year. If Bitcoin can secure $120,000 as support, it would likely push past $122,000 and move toward the ATH .
However, there remains a risk that the market could turn bearish if investors shift their stance due to unforeseen market factors. In this case, BINANCE:BTCUSDT could lose support at $117,261 and slide to $115,000, reversing the bullish thesis.
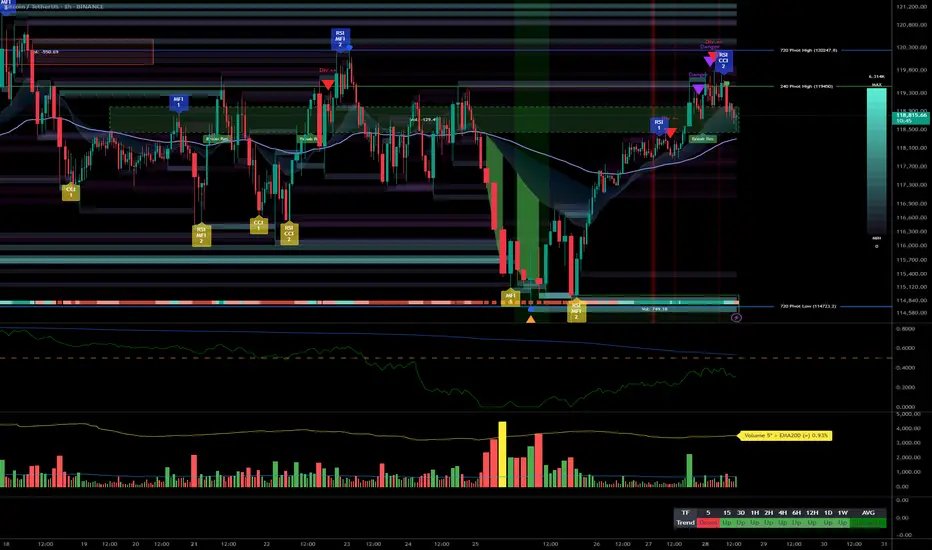
Strategic Multi-Swing Analysis – Pivots and Post-FOMC Outlook__________________________________________________________________________________
Technical Overview – Summary Points
➤ Sustained bullish momentum on BTCUSDT across all swing timeframes.
➤ Key supports: 116400–117400 (likely rebound), major supports: 105047–114674.
➤ Main resistances: 119000–120000 (short term), major ceiling at 123240 (1D/12H).
➤ Risk On / Risk Off Indicator: "Strong Buy" signal – tech sector leadership confirmed.
➤ Volumes normal to moderately elevated, no excess or behavioral anomaly (ISPD "Neutral").
➤ No euphoria or capitulation flags; general wait-and-see attitude, FOMC event ahead.
__________________________________________________________________________________
Strategic Summary
➤ Strategic bullish bias remains as long as 116400/117400 supports hold.
➤ Opportunity window: buy pullbacks towards 117400–116400 with tight stops; clear invalidation below 115900.
➤ Risks: FOMC-induced volatility, increased leverage on alts, potential capitulation if key support breaks.
➤ Catalysts: FOMC communication, geopolitical context (no immediate threat), background risk-off climate not yet triggered.
➤ Action plan: Prioritize post-event reaction over anticipation; maintain strict technical protection.
__________________________________________________________________________________
Multi-Timeframe Analysis
1D: Uptrend confirmed. Price above all major supports. Strong resistance at 123240, key support at 105047, normal volumes, Risk On / Risk Off Indicator "Strong Buy", ISPD "Neutral".
12H: Bullish bias. Resistance cluster 120002–123240. Intermediate supports 114674/111949. Momentum/volume supported, no excesses.
6H: Bullish near range top, supports at 114674/111949, ceiling at 120002–123240. Solid Risk On / Risk Off Indicator.
4H–2H: Up momentum, resistance 119003–120002–123240, supports 116474/117800. Moderate/normal volumes.
1H: Strong uptrend, thick resistance at 119000–120000, immediate supports 117800/116474. Slight volume uptick ahead of FOMC.
30min–15min: Resistance 119003–120000 (~H4 pivot). Intraday support 117400–117800/118200. Both Risk On / Risk Off Indicator and ISPD neutral, normal volumes, bullish as long as 116474 holds.
SYNTHESIS: Broad bullish confluence on MTFTI from 1H to 1D/W.
Supports at 116474/117400 are key pivots for maintaining bullish swing view.
No behavioral alerts or extreme volumes.
Consolidation/waiting likely before FOMC release – monitor reactions at pivot zones.
__________________________________________________________________________________
Strategic decision & macro
Opportunities: Swing bullish scenario favored as long as key supports hold, buy strategic pullbacks, reverse on clear break.
Main risk: FOMC volatility, altcoin excesses, possible post-announcement fake moves. Active monitoring essential.
Macro/on-chain: No excess, BTC realized cap > $1T; aggressive rotation into alts, high open interest. No capitulation. Major on-chain & technical support aligned at 114500–118000.
Action plan: Favor reactivity (post-FOMC), tight stops, progressive take profits at 119500–123240 resistance. No aggressive pre-positioning.
__________________________________________________________________________________
Macro catalysts overview
FOMC expected: status quo, market sensitive to any Powell tone shift.
Global macro: latent risk-off, geopolitical drivers closely watched.
BTC stable, no technical disruptor in the immediate term.
__________________________________________________________________________________
Final Decision Summary
Robust technical setup with a clear bullish bias. Optimal entries on 117400-116400 pullbacks, stops below support, active management needed during FOMC. No on-chain excess; constructive background unless exogenous shock or resistance failure (119000–123240). Stay alert for breakout/reject pivot.
__________________________________________________________________________________
Market overview
📈 WHAT HAPPENED?
Last week, a less priority but expected scenario was realized for Bitcoin. We broke through the sideways in a downward direction and fell to the area of pushing volumes ~$115,000. At this level, strong volume anomalies were recorded, and a rebound occurred.
On Friday, the daily analysis on TradingView indicated a point to join the long movement, which confirmed its accuracy. The price reached the accumulated volume zone of the sideways at $117,600-$119,200 and was able to consolidate above without any significant reaction, which strengthens the buyers' position.
💼 WHAT WILL HAPPEN: OR NOT?
At the moment, the first protection from sellers has appeared. Let's consider possible scenarios:
1. A decline to the mirror zone of $118,300-$117,300, from which, if the buyers' reaction is confirmed, buys are expected to resume.
Next, a narrow sideways formation within the mentioned zone and a local sell zone of $119,500-$119,000 is possible, followed by a long position.
Another option is to develop a further long divergence from the current levels. In this case, the local sell zone of $119,000-$119,500 will provide additional support.
2. A less priority scenario is a decline to the volume anomaly zone of $116,200-$115,000, with a test of the local minimum. In this case, the recovery will take longer.
Buy Zones:
$118,300–$117,300 (mirror volume zone)
$116,200–$115,000 (volume anomalies)
$110,000–$107,000 (accumulated volumes)
Sell Zone:
$119,500–$119,000 (potential resistance if a correction develops)
📰 IMPORTANT DATES
Macroeconomic events this week:
• July 29, Tuesday, 14:00 (UTC) - publication of the US Consumer Confidence Index from CB for July;
• July 29, Tuesday, 14:00 (UTC) - publication of the US Job Openings and Labor Turnover (JOLTS) for June;
• July 30, Wednesday, 08:00 (UTC) - publication of Germany's GDP for the second quarter of 2025;
• July 30, Wednesday, 12:15 (UTC) — ADP's July change in the number of non-agricultural employees in the United States;
• July 30, Wednesday, 12:30 (UTC) — U.S. GDP for the second quarter of 2025;
• July 30, Wednesday, 13:45 (UTC) — Canada's interest rate decision;
• July 30, Wednesday, 18:00 (UTC) — US FOMC statement and announcement of the US Federal Reserve interest rate decision;
•July 30, Wednesday, 18:30 (UTC) — US FOMC press Conference;
• July 31, Thursday, 01:30 (UTC) — publication of the Chinese Manufacturing PMI for July;
•July 31, Thursday, 03:00 (UTC) — announcement of Japan's interest rate decision;
• July 31, Thursday, 12:00 (UTC) — publication of Germany's July Consumer Price Index (CPI);
• July 31, Thursday, 12:30 (UTC) — publication of the United States' June Personal Consumption Expenditure Price Index and Initial Jobless Claims;
• August 1, Friday, 09:00 (UTC) — publication of the Eurozone Consumer Price Index (CPI) for July;
• August 1, Friday, 12:30 (UTC) — publication of the average hourly wage, changes in the number of employees in the non-agricultural sector, and the unemployment rate in the United States for July;
• August 1, Friday, 13:45 (UTC) — publication of the U.S. Manufacturing Purchasing Managers' Index (PMI) for July.
*This post is not a financial recommendation. Make decisions based on your own experience.
#analytics

BTC Price Prediction and Elliott Wave AnalysisHello friends,
>> Thank you for joining me in my analysis. I think we will finish the 1st wave A in pink X wave as Gray ABCm. I am waiting for its confirmation.
>> Reminder about our previous confirmations:
* Day TF: Breaking 118451 for today and the next couple of days, and keep on above it, leads to ending the B wave successfully.
* 4Hr TF: Breaking 118451 for the past hours and keep on above it, we ended W wave successfully ( maybe also B ?)
Keep liking and supporting me to continue. See you soon!
Thanks, Bros

Consistency and reliable performance with real time validationMy cutting edge tech has been put to the test with daily real time validation
It's been correct for over 4 weeks
It's been my mission to defy market odds and revolutionize trading, and with thanks to AI my mission is being fulfilled
I would love to hear your thoughts...or if not, I hope you're getting really excited by what you see

BTCUSDT Range-Bound Market: Short-Term Bearish MoveBTCUSDT
has failed to break through the descending resistance near 120,000 and is now forming a lower high within the broader resistance zone. The price action follows an impulsive leg up and is currently tracing a potential reversal pattern under key structural resistance. As long as the market remains capped below 120,000, continuation toward 117,500 is likely. The downward bias is supported by weakening momentum after the bull trap and resistance rejection.
📉 Key Levels
Sell trigger: Breakdown below 119,000
Sell zone: 119,400 – 120,000
Target: 117,500
Invalidation: Break and close above 120,500

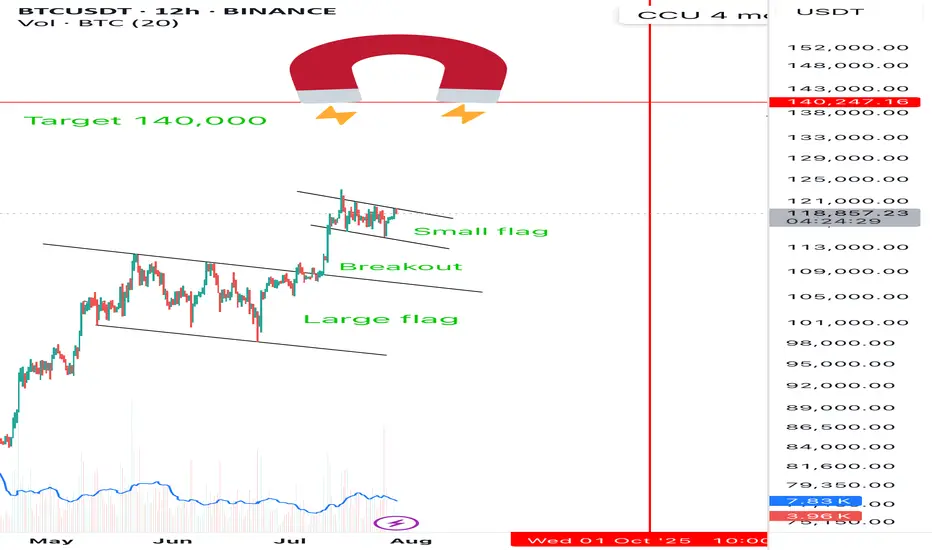
BTC roadmap to new ATHBTC roadmap to new ATH
We're in a bullish flag pattern. Might chop around here for the next few days before we get the breakout, re-test, then make our way to test the last ATH.
I'm going to trade the flag hi/low until we get a break.
Bullflag double Double bull flag target 140,000 🚀
Everyone’s looking at 145,000
175,000 looks like the fib target
BTCUSDT NEXT Impulse !Hi fellow traders, BTCUSD will be ready to make a move higher from the blue box after it completes the expanding flat pattern in a WXY formation. Target will be 113604.87 USD. Good luck and trade safe!

$BTC REASON FOR BULLISH CRYPTOCAP:BTC 🐂
DIRECTIONS: LONG 🟢
ENTRY: 118,405
SL (Stop Loss): 117,006
TP MAX (Take Profit): 122,810
Margin: 1–5%
Once TP1 hits, consider moving SL to breakeven (SL+).
If not, you can set TP2 at a 1.2 RR (Risk-Reward) ⚠️
Exchange I'm using: bingx.pro

BTC-----Buy around 119000, target 120000-1205000 areaTechnical analysis of BTC contract on July 28:
Today, the daily level of the large cycle closed with a small positive line yesterday, the K-line pattern continued to rise, the price was above the moving average, and the attached indicator was dead cross. The general trend of rising is still very obvious, but from the trend law, it is not a very strong trend at present. The trend of oscillating upward and range is highly likely. In this case, we must find a good rhythm for trading, keep short-term, and don’t be greedy, otherwise it is easy to have profit-taking problems; the short-term cycle hourly chart yesterday’s US market rose and then fell under pressure to correct the low position near the 118700 area. The current K-line pattern is continuous, and the price is at a high level. The attached indicator is golden cross and shrinking. In general, the trend is still strong and the retracement is relatively small. If we look at the continuation of the rise today, it is still the old rule. The retracement cannot be large and cannot break the intraday low.
Today’s BTC short-term contract trading strategy:
Trade in the 119000 area when retreating, stop loss in the 118500 area, target 120000 and break to the 120500 area;
