BTC - 1H Elliott Wave Analysis - 05.08.25Greetings, this is an update of our Elliott Wave Count for Bitcoin.
Today we are going to look at the bullish and bearish scenarios so everybody is well prepared for the upcoming price action.
We have seen a pullback since yesterday's update.
The pullback entered and is currently in our Wave 2 support area which is between the 0.5 FIB at 113'640 USD and the 0.786 FIB at 112'616 USD. The bulls would like to see a bounce now in green Wave 3 of which the targets are the 1 to 1 FIB at 116'418 USD, the 1.382 FIB at 117'883 USD and the 1.618 FIB at 118'789 USD which is also the optimal target for a Wave 3.
Due not invalidating the red Wave 4 we could form the red Wave 5.
Be aware that on the lower timeframes we did touch the 0.886 FIB of a smaller Wave 2 support area which does indicate weakness and usually is followed by another low. If we touch the 0.886 FIB of the Wave 2 support area at 112'287 USD it is also an invalidation of the green bullish count.
Red Wave 5 targets are the 1 to 1 FIB at 111'573 USD which is additionally right below the last low and the last all time high which could function as further support. Further targets would be the 1.382 FIB at 109'997 USD and the 1.618 FIB at 109'024 USD as well as another 1.618 FIB at 109'479 USD.
Be aware that the bigger Wave 2 support area goes down to 103'000 USD.
We think another low is more probable meaning the red count has the higher probability.
Yet we think the green count is a good opportunity as we have a clear set up and invalidation point.
Thanks for reading.
We would appreciate a follow and boost if you like the analysis! :)
NO FINANCIAL ADVICE.
BTCUSDT trade ideas

BTC 1H Analysis – Key Triggers Ahead | Day 2💀 Hey , how's it going ? Come over here — Satoshi got something for you !
⏰ We’re analyzing BTC on the 1-hour timeframe .
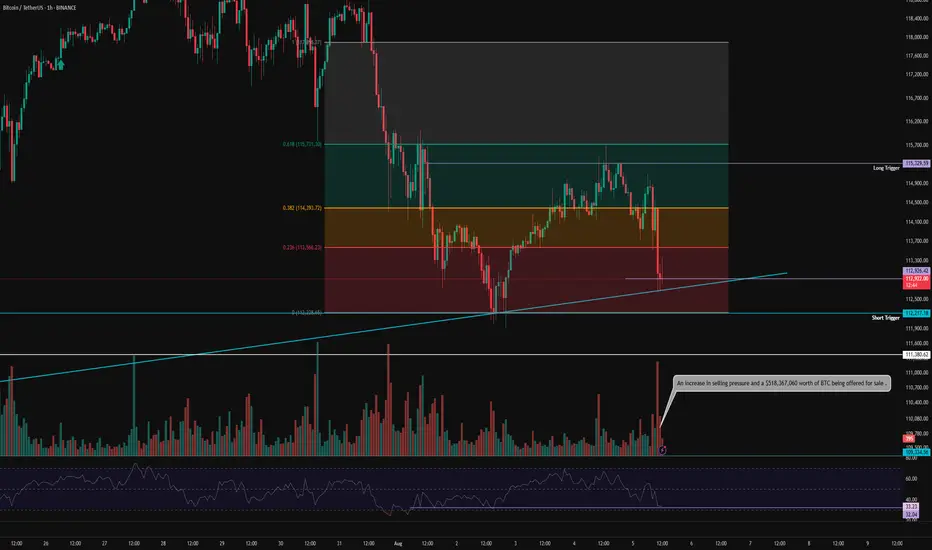
👀 After the strengthening of the US dollar , Bitcoin experienced a drop and formed a short-term support bottom around the $113,000 level . It is currently completing a pullback to the levels of this recent decline .
🎮 Our Fibonacci retracement is drawn from the breakout zone to the $112,200 bottom . Bitcoin broke below the 0.236 level and then found support . The best potential entry trigger, based on Fibonacci, is at the 0.382 level, or around $115,000 . If Bitcoin breaks above this level , it could form a higher high and a higher low in this timeframe .
⚙️ The RSI is showing a support level around 32 , which is currently preventing Bitcoin from entering the oversold zone . However , if this support is lost , Bitcoin could move into oversold territory .
📈 Our long position trigger is at the 0.382 Fibonacci level . A confirmed breakout of this level , combined with RSI overbuying and increased volume , would be our entry signal .
📉 Our short position trigger is around $113,000 . If this support breaks , we may open a short position . However, the main short trigger is at the 0 Fibonacci level ( support at $112,200 ) . If selling pressure increases and RSI enters the oversold zone , we will consider entering a short position with confirmation .
❤️ Disclaimer : This analysis is purely based on my personal opinion and I only trade if the stated triggers are activated .
btc usd short term down 50 to 70 pips btc usd short term down 50 to 70 pips
fell free contrect me if you have any question

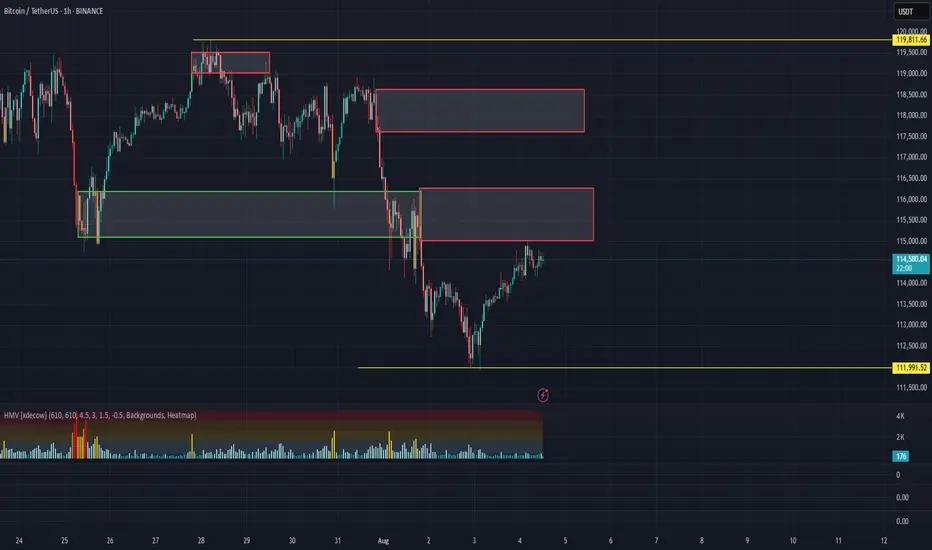
BTC - trend lines and liquidity zonesHere is a summary of what I'm looking at:
Price currently struggling to surpass the Weekly low @ 115,650 (Blue line)
The green line is acting as resistance, with a brief break-through mid-July.
Huge liquidity zone 120-121.5K which will be inevitably grabbed (Yellow box)
Liquidity sitting below @ 111K (Yellow box)
0.5 fib currently at @ 110K (which also acted as the Weekly high in Jan 25)
A descending channel formation
Analysis:
I believe that Bitcoin with visit the 110K - 111.5K zone which also coincide with the bottom of the channel, the Weekly high @ 110K and 0.5 fib (ish) and grab what liquidity is currently sat below.
Once done, move up to the higher liquidity zone, which would break once again above the Green line which would hopefully flip into support, and send BTC parabolic with a peak Nov-Dec.

Robert Kiyosaki said WHAT about BTC?According to Cointelegraph Robert Kiyosaki welcomes a BTC dip below $90K... We talked about it before even BTC broke ATH (check related publications), what do you think?
#crypto #cryptomarket #bitcoin #btc #trading #analysis

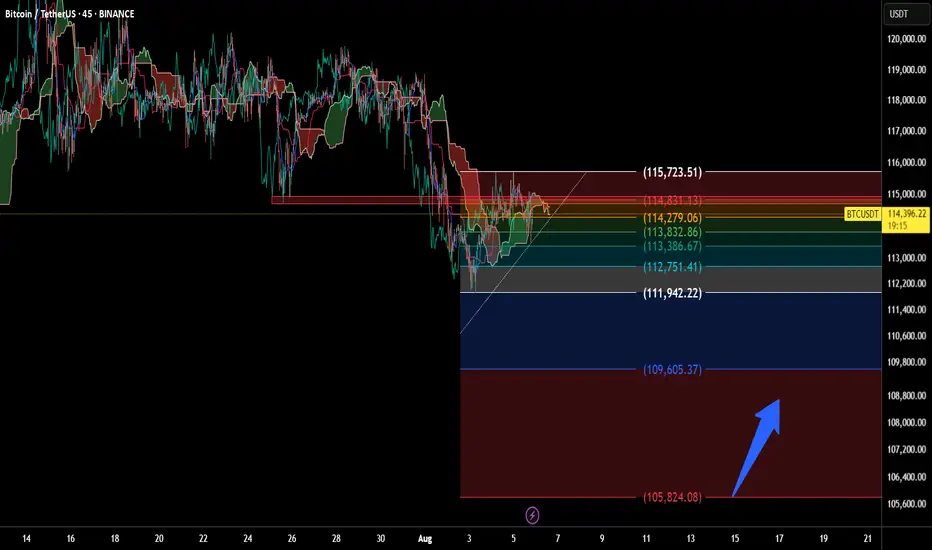
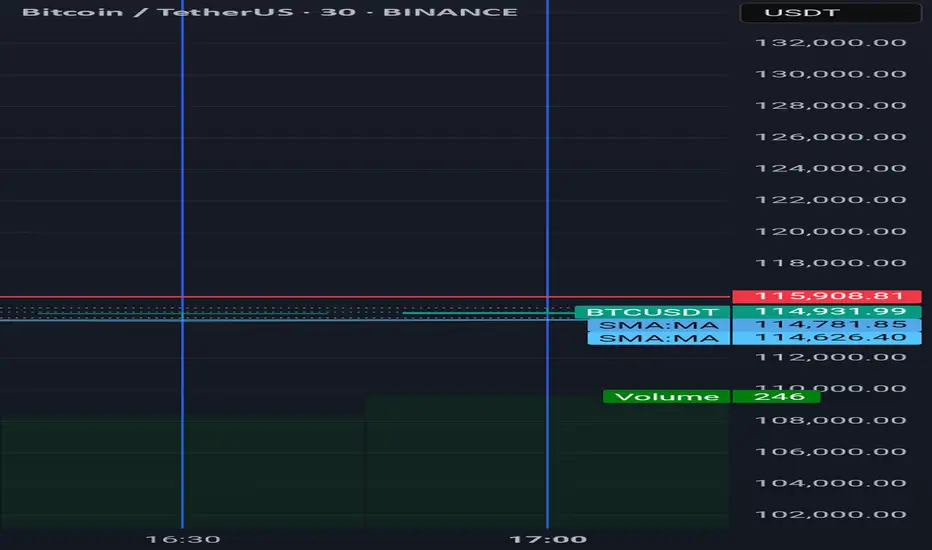
Will BTC Hold the Line? Support Levels TestedBitcoin is currently trading at 114,420 USDT on the 45-minute timeframe. This setup highlights a structured technical analysis using Ichimoku Cloud, Fibonacci retracement, and clearly defined support/resistance levels.
Key price zones:
- Resistance: 115,723.51 / 114,831.13
- Mid-range: 114,279.06 / 113,832.86
- Support: 113,386.67 down to 109,605.37
A downward arrow suggests a potential revisit to lower support zones, possibly around 105,824.08 USDT, indicating a watchlist area for accumulation or bounce confirmation.
💬 “Monitoring BTC’s reaction around key Fibonacci levels. Potential support zone in sight.”
A big drop is ahead in the coming weeksBitcoin appears overbought, and in the current global economic climate, cash is king — a dynamic that may prompt investors to lock in profits. I anticipate a pullback to the 0.5 Fibonacci level, which sits around $69,000.

BTC/USDT Analysis – Reached Resistance
Hello everyone! This is the daily analysis from the CryptoRobotics trading analyst.
Yesterday, Bitcoin reached the resistance zone at $115,000–$116,300 (a mirror volume zone), and we are already seeing a reaction from sellers.
Our primary expectations remain unchanged since yesterday — we anticipate a move back down toward the local low. If there’s no reaction at that level, we could see a further decline toward the next support zone at $110,000–$107,000 (accumulated volume). A shift to a bullish scenario is only possible if strong market buying appears, which would be reflected in a sharp spike in volume and upward positioning.
Buy Zones:
$110,000–$107,000 (accumulated volume)
Sell Zones:
$115,000–$116,300 (mirror volume zone)
$117,600–$118,600 (accumulated volume)
This publication is not financial advice.

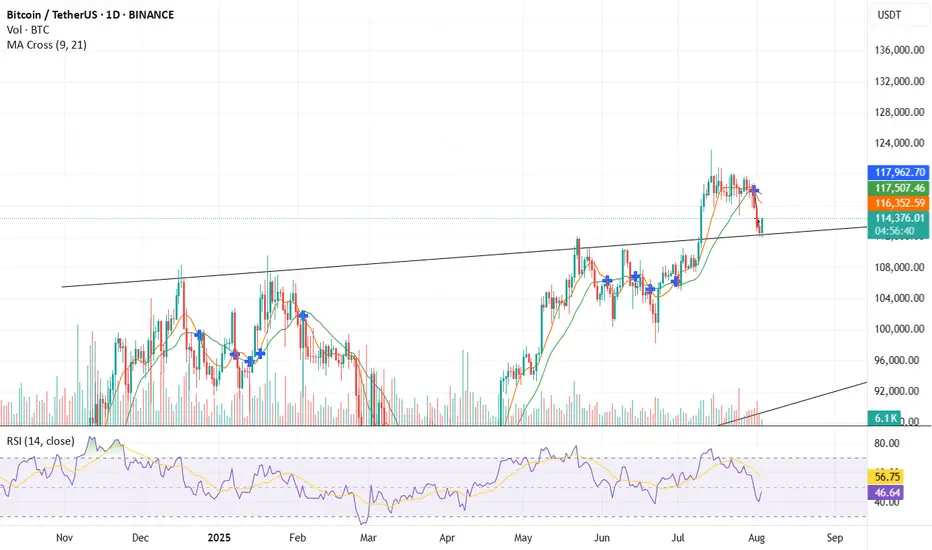
Bitcoin Price Outlook 2025–2030 | EMA & MACD SignalsBitcoin trades near $114K in August 2025, sitting just below EMA 9 and EMA 15, while the EMA 200 at $100,870 keeps the long‑term trend bullish. Support at $114K remains crucial, with resistance at $120K–$122K. A close above short‑term EMAs could spark a move toward $127K, while rejection may bring a retest of $110K. Long‑term analysis points toward a potential rise to $300K–$350K by 2030.

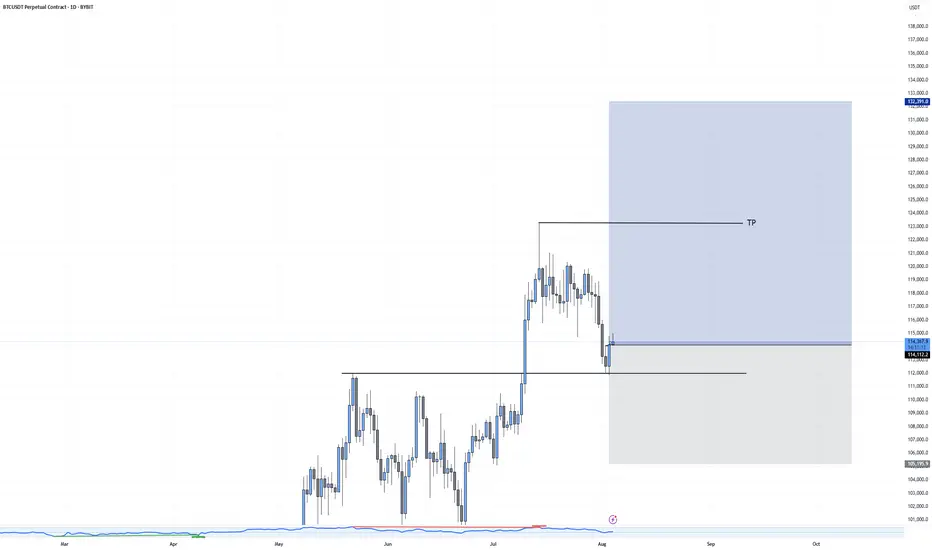
BTCUSDT - UniverseMetta - Signal#BTCUSDT - UniverseMetta - Signal
H4 - Formation of the 3rd wave from the lower border of the channel. Stop behind the minimum of the 1st wave.
Entry: 115776.79
TP: 120784.05 - 125355.20 - 130353.86 - 134629.03
Stop: 111641.76

127000 USD on BTC? Analysis of the Bitcoin (BTC/USD) chart on the TradingView platform reveals several key observations. The current price is hovering around $114,249.14, suggesting a short-term decline following a previous significant rise, evident as a high peak on the chart. The two moving average lines—green (shorter period) and red (longer period)—indicate an upward trend, as the green line is above the red, signaling bullish strength in the broader perspective. However, recent red candles point to selling pressure, with the price approaching a support zone around $113,000–$114,000, which could serve as an area of consolidation or a potential rebound.
In the lower part of the chart, the oscillator (e.g., RSI or another momentum indicator) remains in a neutral zone, suggesting no significant overbought conditions but also a lack of strong momentum for further declines. It’s worth noting that the price is currently testing a critical support level, and a break below this could lead to further downside, while a bounce could target higher levels. Based on the current trend and historical price action, a suggested target price of $127,000 USD appears achievable if the support holds and bullish momentum resumes, potentially driven by a breakout above the recent high.
Potential TP: 127 000 $

BTC retracement planDon’t chase breakouts above $115K without confirmation—false signals are common in volatile crypto conditions.
Watch for volume spikes at key levels like $115K or near $117,800 for validation.
Use tight stop-losses given intraday volatility—it’s easy for sharp 1–2% swings in crypto.
Note that technical sentiment (RSI, MACD) remains neutral to slightly bearish across intraday and daily indicators .
Weekly trading plan for BitcoinBINANCE:BTCUSDT Price has shown recovery over the past 24 hours, but now faces a critical test at the weekly reversal level ($115,300). The inability to establish sustained footing above this level may trigger a deeper correction
Key Scenarios:
Bullish: Hold above $108K maintains ATH potential
Bearish: Failure to consolidate above $115.3K opens downside risk to 110k
Let the market confirm its direction first


BTCUSDT Expanded Flat Correction may be overBear with me (pun intended). I know I'll probably get some slack from the 5 wave correction counting of wave C. Most people would place the 3rd wave in June instead of May, but a few things suggest me that the 3rd wave down was actually in May:
This C wave lies at the 123.6% extension of wave A which is a common area for the Expanded Flat correction.
Volume and RSI printing a divergence
2M RSI just broke out of its falling wedge
BTCUSDT resiliance at the 19k level, in contrast with the current equity price action & general sentiment, which goes against the previous sell offs of April and June
All of the above considered, there's still something missing : that the C wave should hold RSI divergence between wave 3 and 5 at completion, which did not happen with this counting. Also BTC would not only have be above the 19.3k resistance of the 123.6% extension of wave A (which is being rejected @ the moment) as it would also need to break & retest that yellow trendline (hands tied with the faster EMA's) that is holding its price down. But where is the fun in posting ideas when all of the cards are on the table? =D
All I'm saying is that this correction is closer to its ending than the other way around, and what I'm suggesting is that I wouldn't be surprised if it would be already over.
DYOR. Not advice

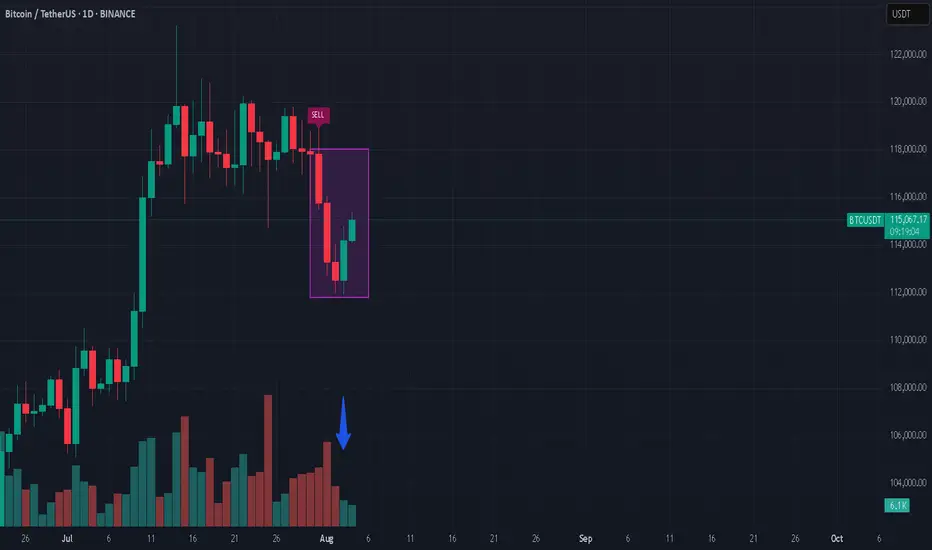
Shorting Bitcoin??Bitcoin had a huge drop, and suddenly shows strength? Well, in my opinion, if you look at the volume, there’s not much strength. I believe it’s going even lower in the short run.
*not investment advice
#bitcoin #crypto #trading
$BINANCE:BTCUSDT Needs a Clean Break Above $117,000The BINANCE:BTCUSDT pair has shown a mild bounce over the past 24 hours, now trading around $114,000. But zoom out, and the weekly performance still shows a nearly 4% dip, raising the question of whether this bounce has real legs or is just noise.
From a long-term holder perspective, on-chain selling pressure has been easing. Data from spent output bands shows that older wallets, particularly those holding BTC for 7–10 years, were active between July 23 and August 1.
However, the extent of selling was notably lower compared to the earlier July 10–19 stretch, when BINANCE:BTCUSDT dropped from $ 123,000 to $ 117,000. Even during this recent distribution phase, BTC managed to hold above $113,000, indicating strong market absorption and reduced overhead pressure.
Valuation-wise, the MVRV (Market Value to Realized Value) ratio currently sits at 2.19. Historically, this zone has acted as a reliable launchpad for Bitcoin rallies. Back in June, a similar reading of 2.16 preceded a move from $101,000 to $110,000. And in April, a 2.12 print led to a surge toward $119000. Right now, BINANCE:BTCUSDT sits in the same zone, supported by a quiet shift in trader sentiment. The long/short ratio flipped from a bearish 0.89 to 1.02, indicating more traders are finally betting on the upside.
From a price action standpoint, BINANCE:BTCUSDT needs to make a decisive move. It is currently holding above the 0.382 Fibonacci retracement level at $113,600. This level is derived from the June low of $ 98,000 to the all-time high of $ 123,000.
The next visible support levels sit at $111,900 and $110,000, while $107,000 remains the invalidation zone for any bullish thesis. However, the true pivot remains $ 117,000; a level marked by historical significance, volume clusters, and failed breakouts. Unless BINANCE:BTCUSDT clears and holds above $117,000, the broader uptrend remains vulnerable to yet another failed rally attempt.

04/08/25 Weekly OutlookLast weeks high: $119,809.82
Last weeks low: $111,917.76
Midpoint: $115,863.79
First net outflow for BTC in seven weeks (-$643m) following the FOMC data release and also month end. Yet again no change by the FED but the chances of Septembers FOMC giving us a rate cut has drastically increased, currently at a 78.5% chance of a 25Bps cut.
Month end usually gives us a pullback/sell-off as larger institutions window dress which often includes de-risking somewhat. We saw this last Thursday combined with the weekends typical lower volume has resulted in quite a significant correction for BTC. Altcoins have down the same as many assets reject from HTF resistance areas, the correction has been on the cards and isn't too worrying on the face of it.
What I would say is August seasonality is generally not a bullish month and so expecting price to rebound and extend the rally would go against historical trends. I could see more of a ranging environment taking place for several weeks before any next leg up is possible.
This week I would like to see where altcoins find support and establish a trading range where some rotational setups tend to present themselves.

Analytics: Market Outlook and Predictions
📈 WHAT HAPPENED?
Last week, US President Donald Trump once again "shook up" the financial markets.
The report published by the White House was received positively and contributed to the recovery of the Bitcoin price. But soon after, new import duties were introduced, which changed the short-term trend of the first cryptocurrency to a downward one. Unfortunately, no one is immune to FUD.
The local minimum was recorded at $112,000, after which the price rebounded slightly, but didn’t reach the key zone of $110,000-$107,000 (accumulated volumes).
💼 WHAT WILL HAPPEN: OR NOT?
Currently, buyer activity remains weak, with significant volumes concentrated above the current price, and no active demand at the local lows. Another wave of sales is likely from the $115,000-$116,300 zone to the formed low of $112,000.
On the other hand, wave analysis shows the weakening of sellers. The market has already absorbed the last wave of sales, and there was a break on the hourly timeframe. With the growth of buying volumes, a rebound to the nearest volume resistance is possible. However, we’ll most likely not be able to do without strong sales, and we’re highly likely to see Bitcoin at $110,000.
Buy Zones:
$110,000–$107,000 (accumulated volume)
Sell Zones:
$117,600–$118,600 (accumulated volume)
$115,000–$116,300 (mirror volume zone)
📰 IMPORTANT DATES
Macroeconomic events that we’re following this week:
• Tuesday, August 5, 13:45 (UTC) — publication of the business activity index (PMI) in the US services sector for July;
• Tuesday, August 5, 14:00 (UTC) — publication of the US Non-Manufacturing Purchasing Managers' Index (ISM) for July;
• Thursday, August 7, 11:00 (UTC) — announcement of the UK interest rate decision for August;
• August 7, Thursday, 11:30 (UTC) — publication of the Bank of England's letter on UK inflation;
• August 7, Thursday, 12:30 (UTC) — publication of the number of initial jobless claims in the United States for August.
*This post is not a financial recommendation. Make decisions based on your own experience.
#analytics
BTC | Bitcoin - Weekly Recap & Gameplan - 03/08/25📈 Market Context:
Traders are currently anticipating a potential 0.25% rate cut at the September FOMC meeting, which continues to support the broader bullish outlook.
While the market pulled back following weaker-than-expected Non-Farm Payroll data, overall sentiment remains optimistic.
Greed has cooled off into a more neutral stance. Historically, August often brings some consolidation or pullbacks — but the structural bias for Bitcoin remains bullish.
🧾 Weekly Recap:
• After printing new all-time highs, BTC began a healthy retracement.
• Price action closely mirrored the Nasdaq's (NQ) pullback during the week.
• We saw a small bounce mid-week, but no strong reversal confirmation yet.
📌 Technical Outlook & Game Plan:
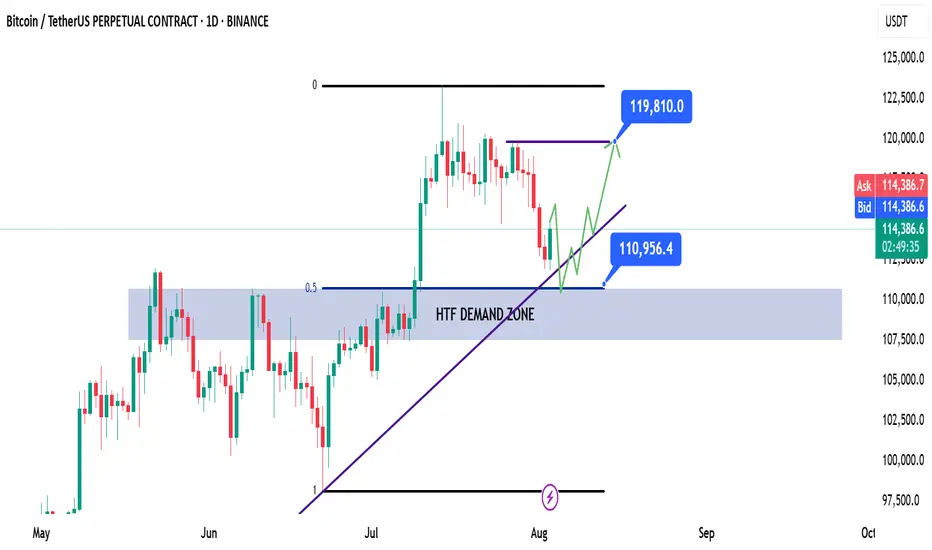
→ I’m watching for price to revisit the long-term bullish trendline.
→ A slight deviation into the HTF demand zone would be ideal for long entries.
→ Bonus confluence: This area also aligns with the 0.5 Fibonacci retracement (Equilibrium level), providing a key discount zone.
🎯 Setup Trigger:
I’ll be watching for a confirmed bullish break of structure (BOS) on the 1H–4H timeframes to signal a reversal.
On confirmation, I’ll look to enter a swing long position.
📋 Trade Management:
• Stoploss: Below the 1H–4H demand swing low
• Take Profit:
→ I’ll trail stops and lock in profits aggressively
→ Main target: $119,820
💬 Like, follow, and comment if this breakdown supports your trading! More setups and market insights coming soon — stay connected!
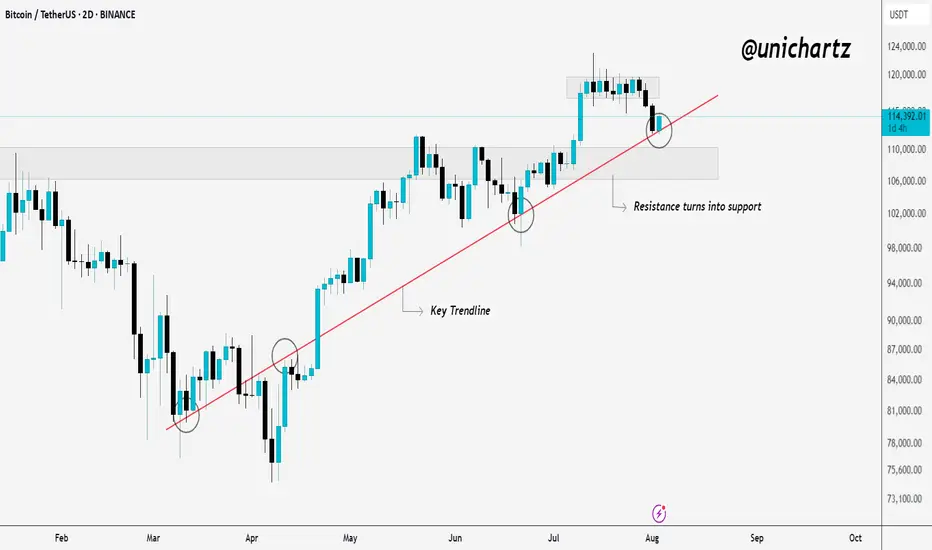
Smart Money Watching This Line — Are You?Bitcoin is holding strong above a key trendline that has acted as dynamic support since March. Every time price touched this line, buyers stepped in, and once again, it’s doing its job.
What was once resistance has now flipped into solid support. The recent pullback seems healthy, and the price is trying to bounce from the trendline area again.
As long as CRYPTOCAP:BTC respects this structure, the bullish momentum remains intact. If it holds, we could see another leg up from here.
DYOR, NFA
Thanks for reading!